OWAO 2025, Практически тур — Задача 3. Beyond the World’s Edge
ΩWAO 2025 ◇ Practical Round ◇ Problems · 20 т.
Условие
Fractal dimension () is a fractional value that measures the complexity and roughness of a shape. It describes how a detail-rich structure fills space and often exhibits self-similarity — meaning parts of the structure resemble the whole, at least statistically, when scaled. For example, a perfectly random distribution of points in a plane would have a fractal dimension equal to the dimension of the space itself, . A value less than 2 indicates a “clumpy” structure with significant empty spaces (voids). The transition scale from a fractal to a homogeneous universe is an active area of research.
The file SN_cat.csv provides observational data for supernova events. The columns are:
sn_namesupernova designation;redshiftmeasured redshift;gal_typemorphological type of the host galaxy;sn_raright ascension in hours, minutes, and seconds;sn_decdeclination in degrees, minutes, and seconds.
a) Plot the objects on a rectangular sky map with axes (Right Ascension; Declination) in degrees. Are there any regions without objects? What does the largest such region represent? [6 т.]
For the remainder of the problem, we will only consider a region of the sky
where the object sample seems to be complete.
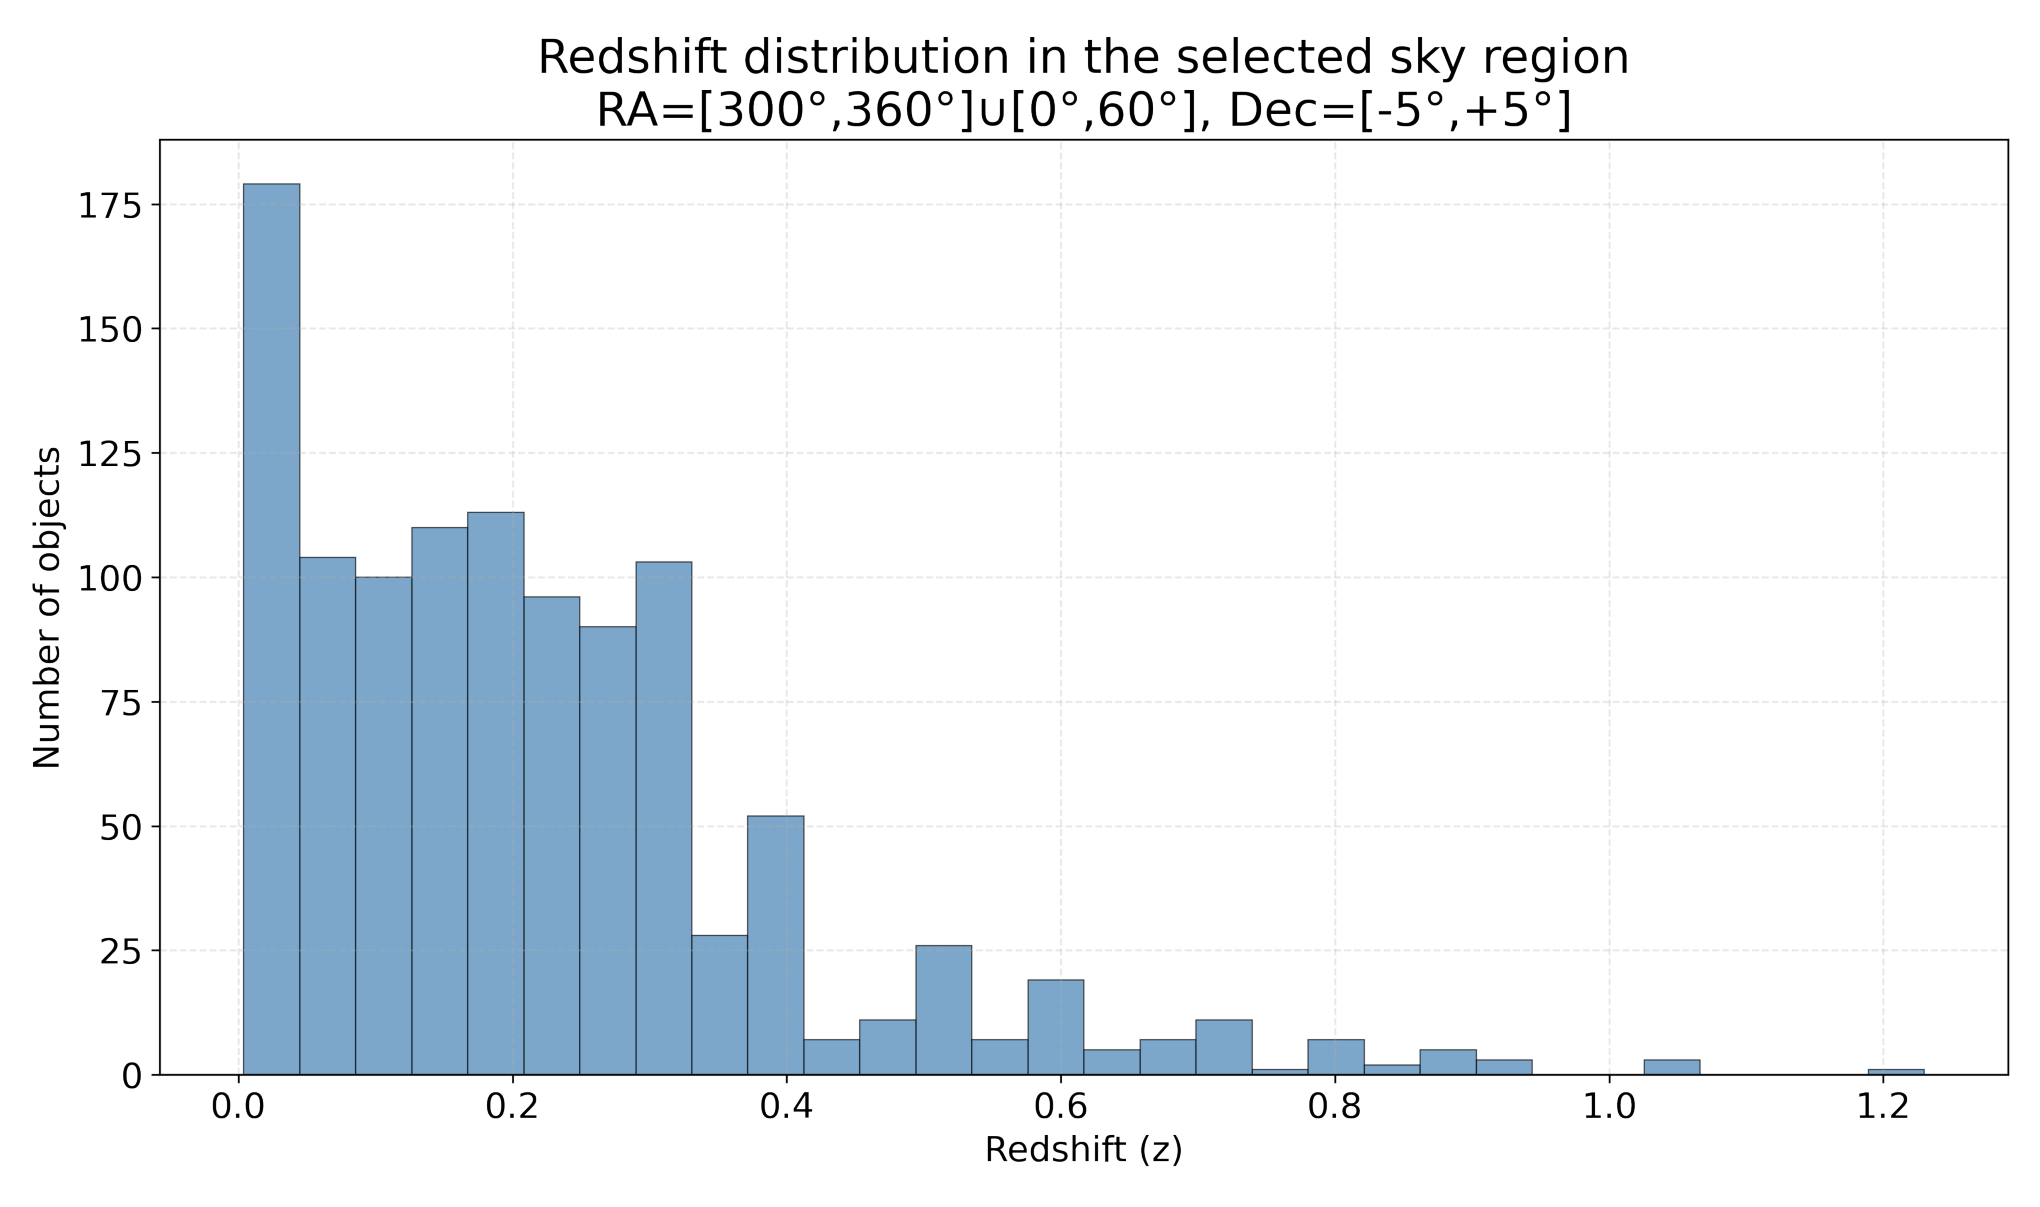
b) For the selected region, plot a histogram of the redshift distribution. [5 т.]
Keep only objects with redshift .
For these objects, we will determine the fractal dimension. To do this, it is necessary to calculate the pairwise distances for all pairs of the remaining objects. The redshift is small — use ordinary Euclidean distance without applying cosmological models.
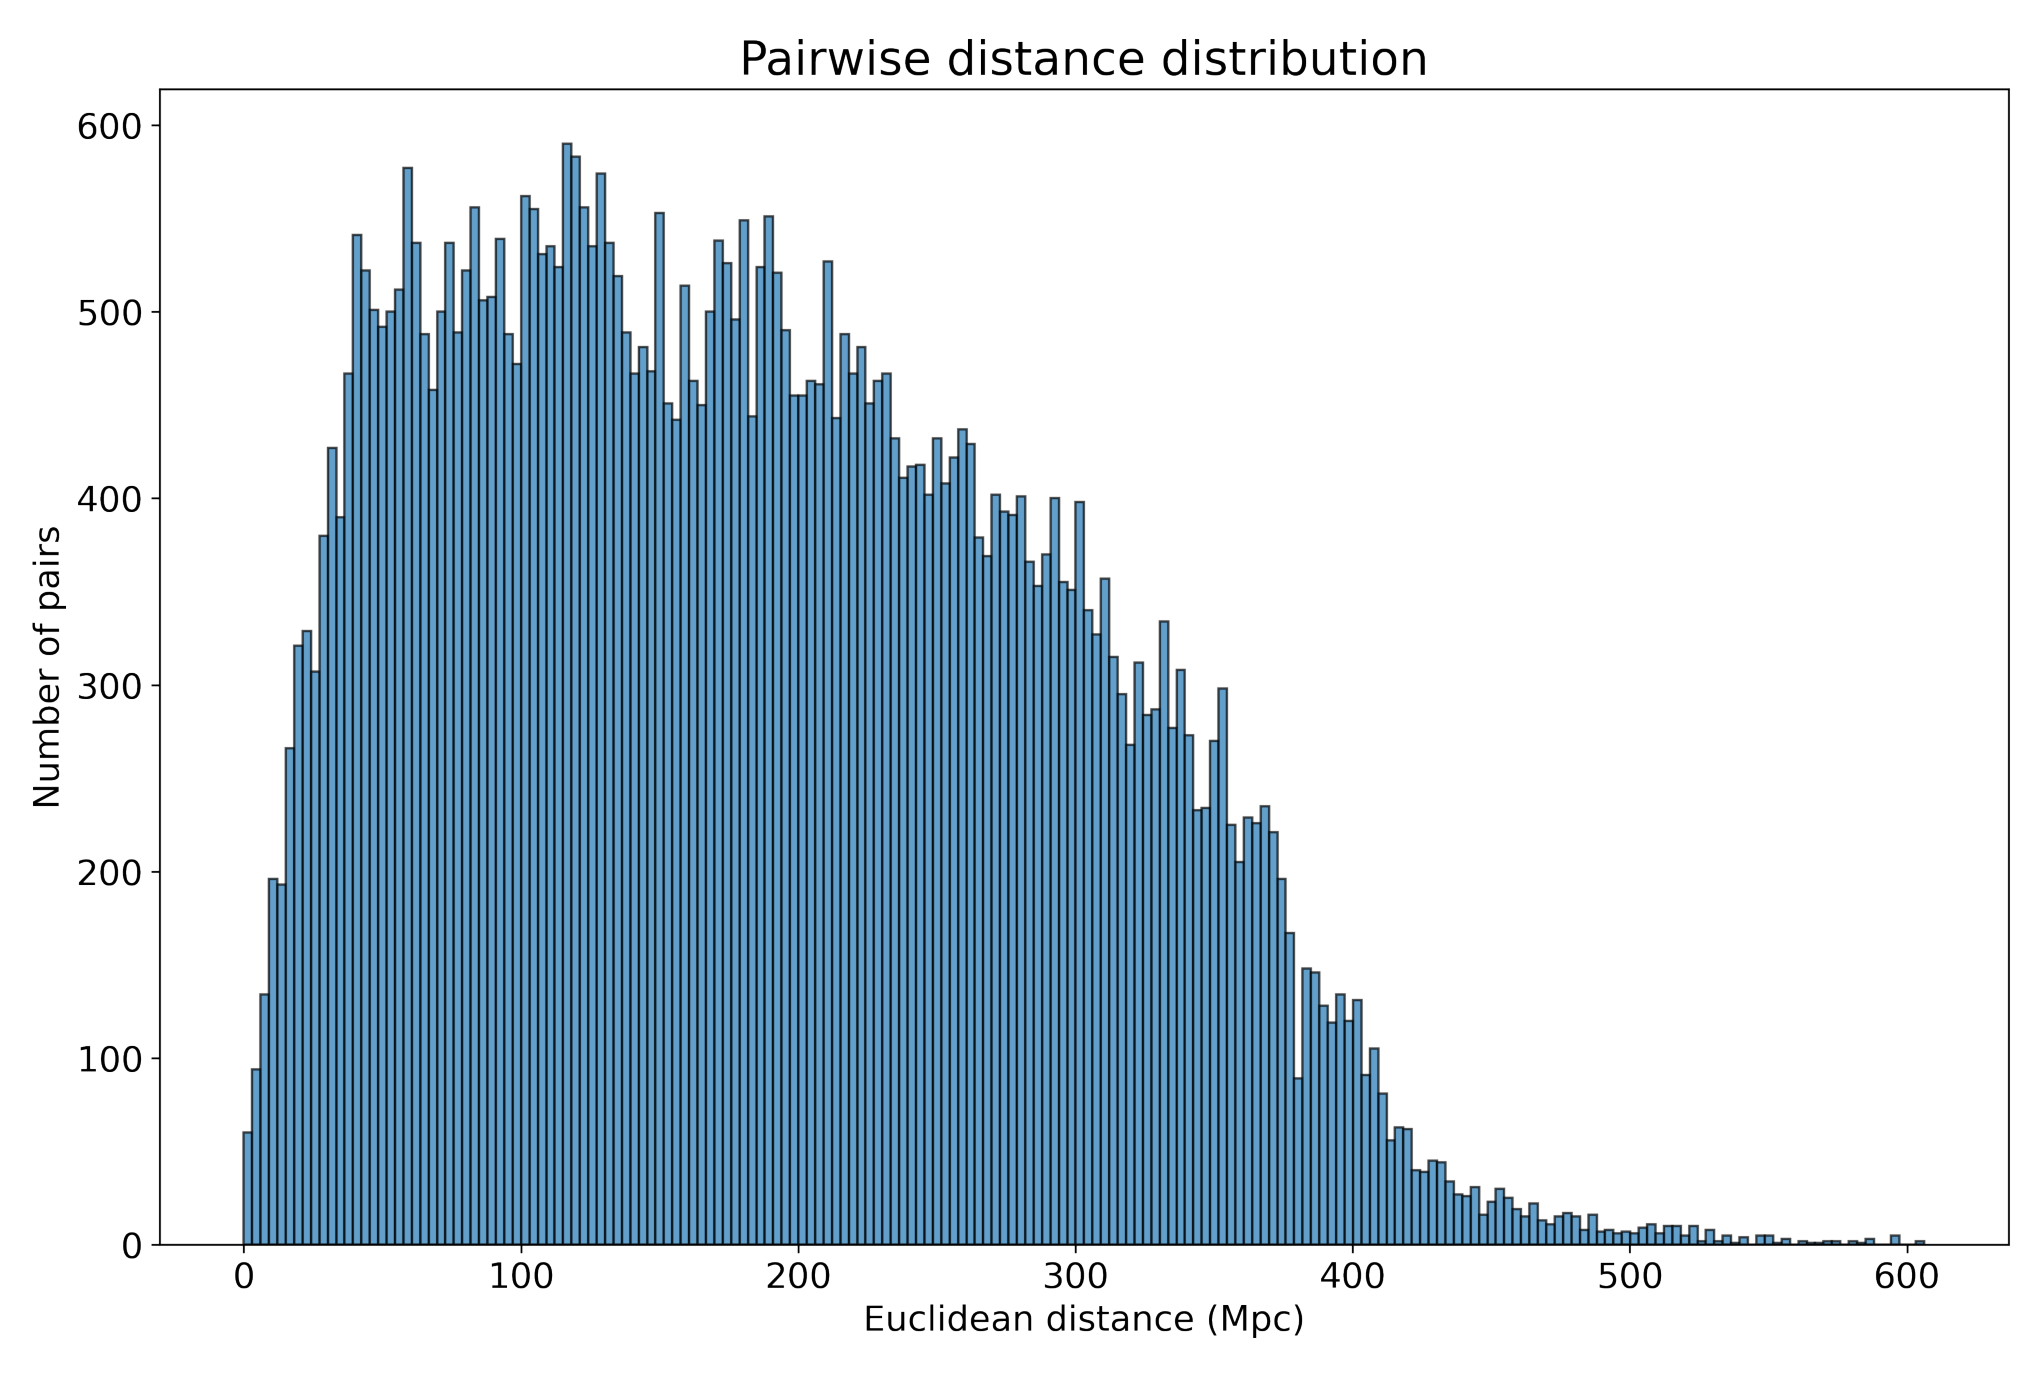
c) Plot a histogram for the distribution of pairwise distance values. [5 т.]
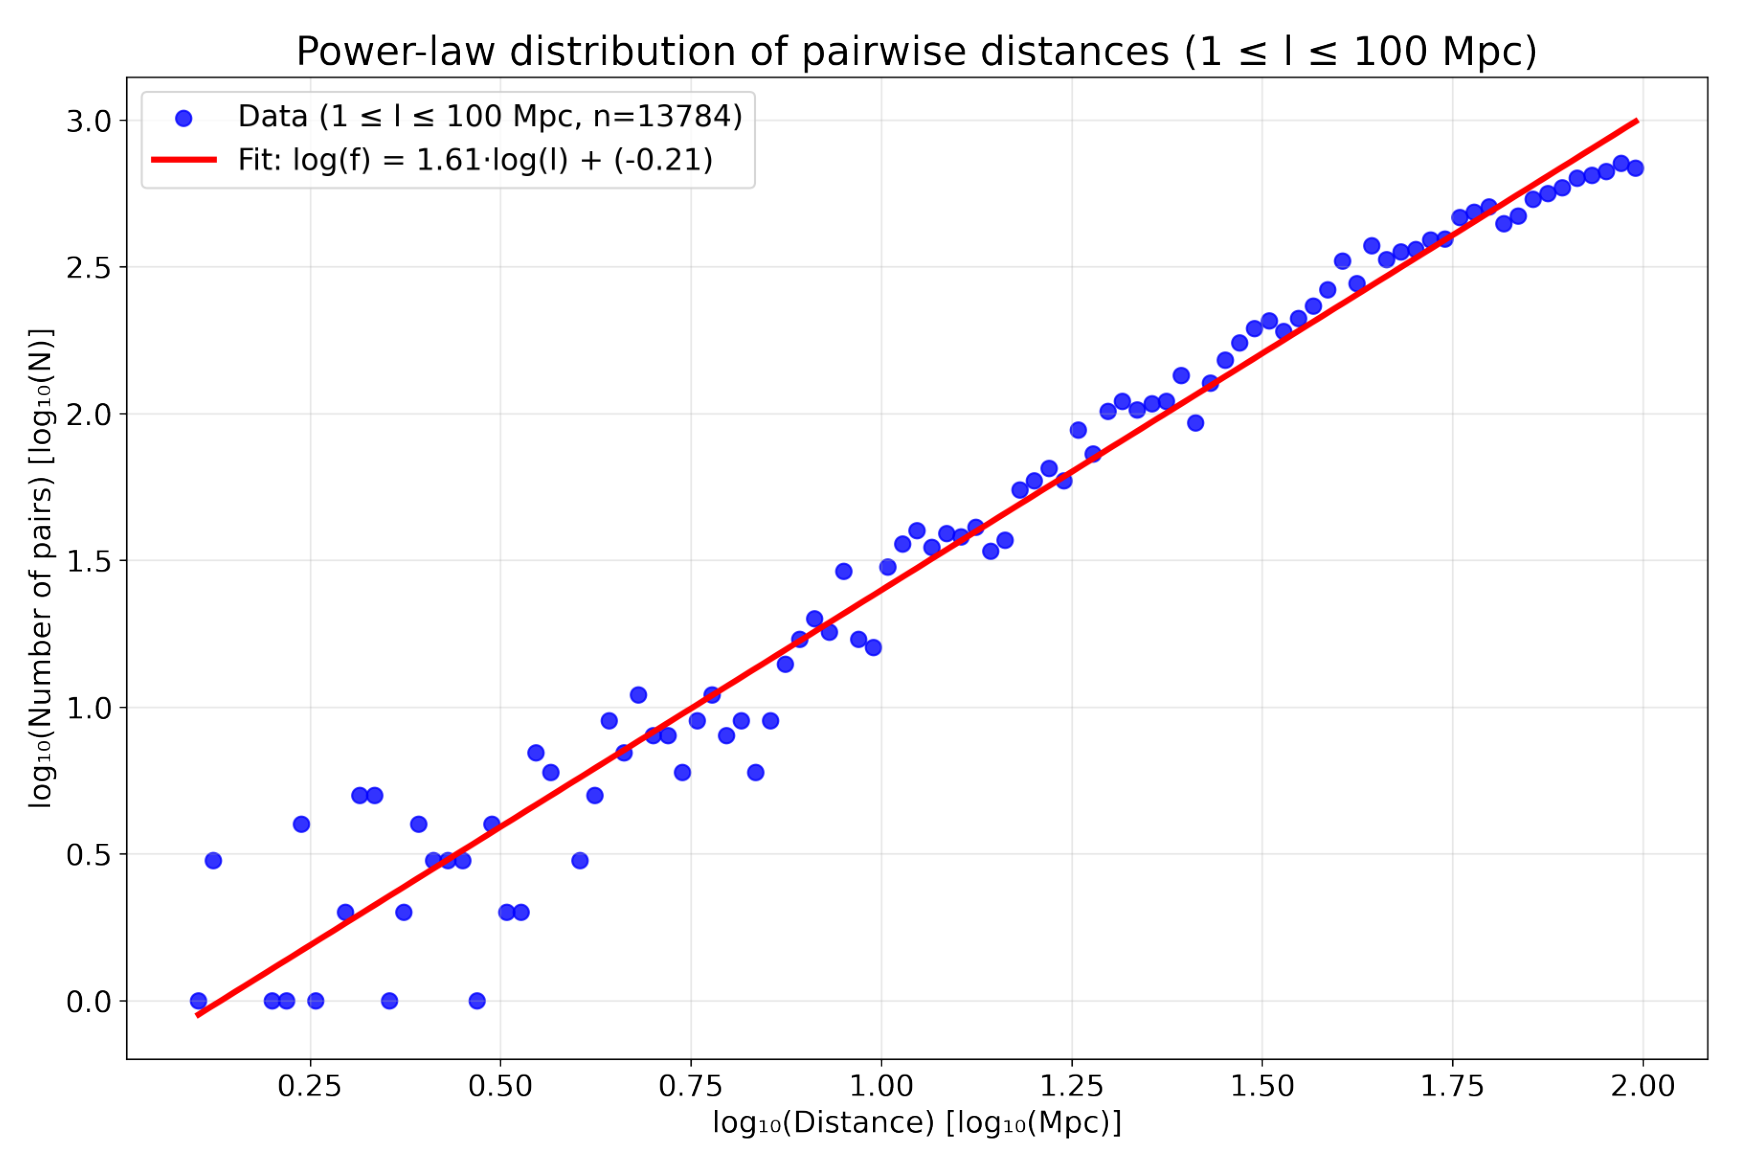
d) To determine the fractal dimension, use pairwise distances in the range from 1 Mpc to 100 Mpc. Fit the distribution with a power law . [2 т.]
The sample objects populate an oblate, practically 2D-region. Therefore, is the fractal dimension of the two-dimensional projection. We may use Mandelbrot’s empirical rule to estimate the fractal dimension of the spatial (3D) distribution of supernovae: .
e) Write down the obtained value of . Is greater or less than 3? [2 т.]
Отговори
a) A broad V-shaped band almost without objects; it is the projection of the Galactic plane, where gas and dust absorb the light of extragalactic supernovae.
d) 1.61
D = 1.61 ≈ 1.6 from the regression
e) 2.6
D0 = D + 1 = 2.6 < 3
Решение
Solution
a) We first convert the right ascension from hours to degrees (using the factor per hour), and then plot the supernovae on a rectangular sky map. As customary in astronomy, right ascension increases from right to left.
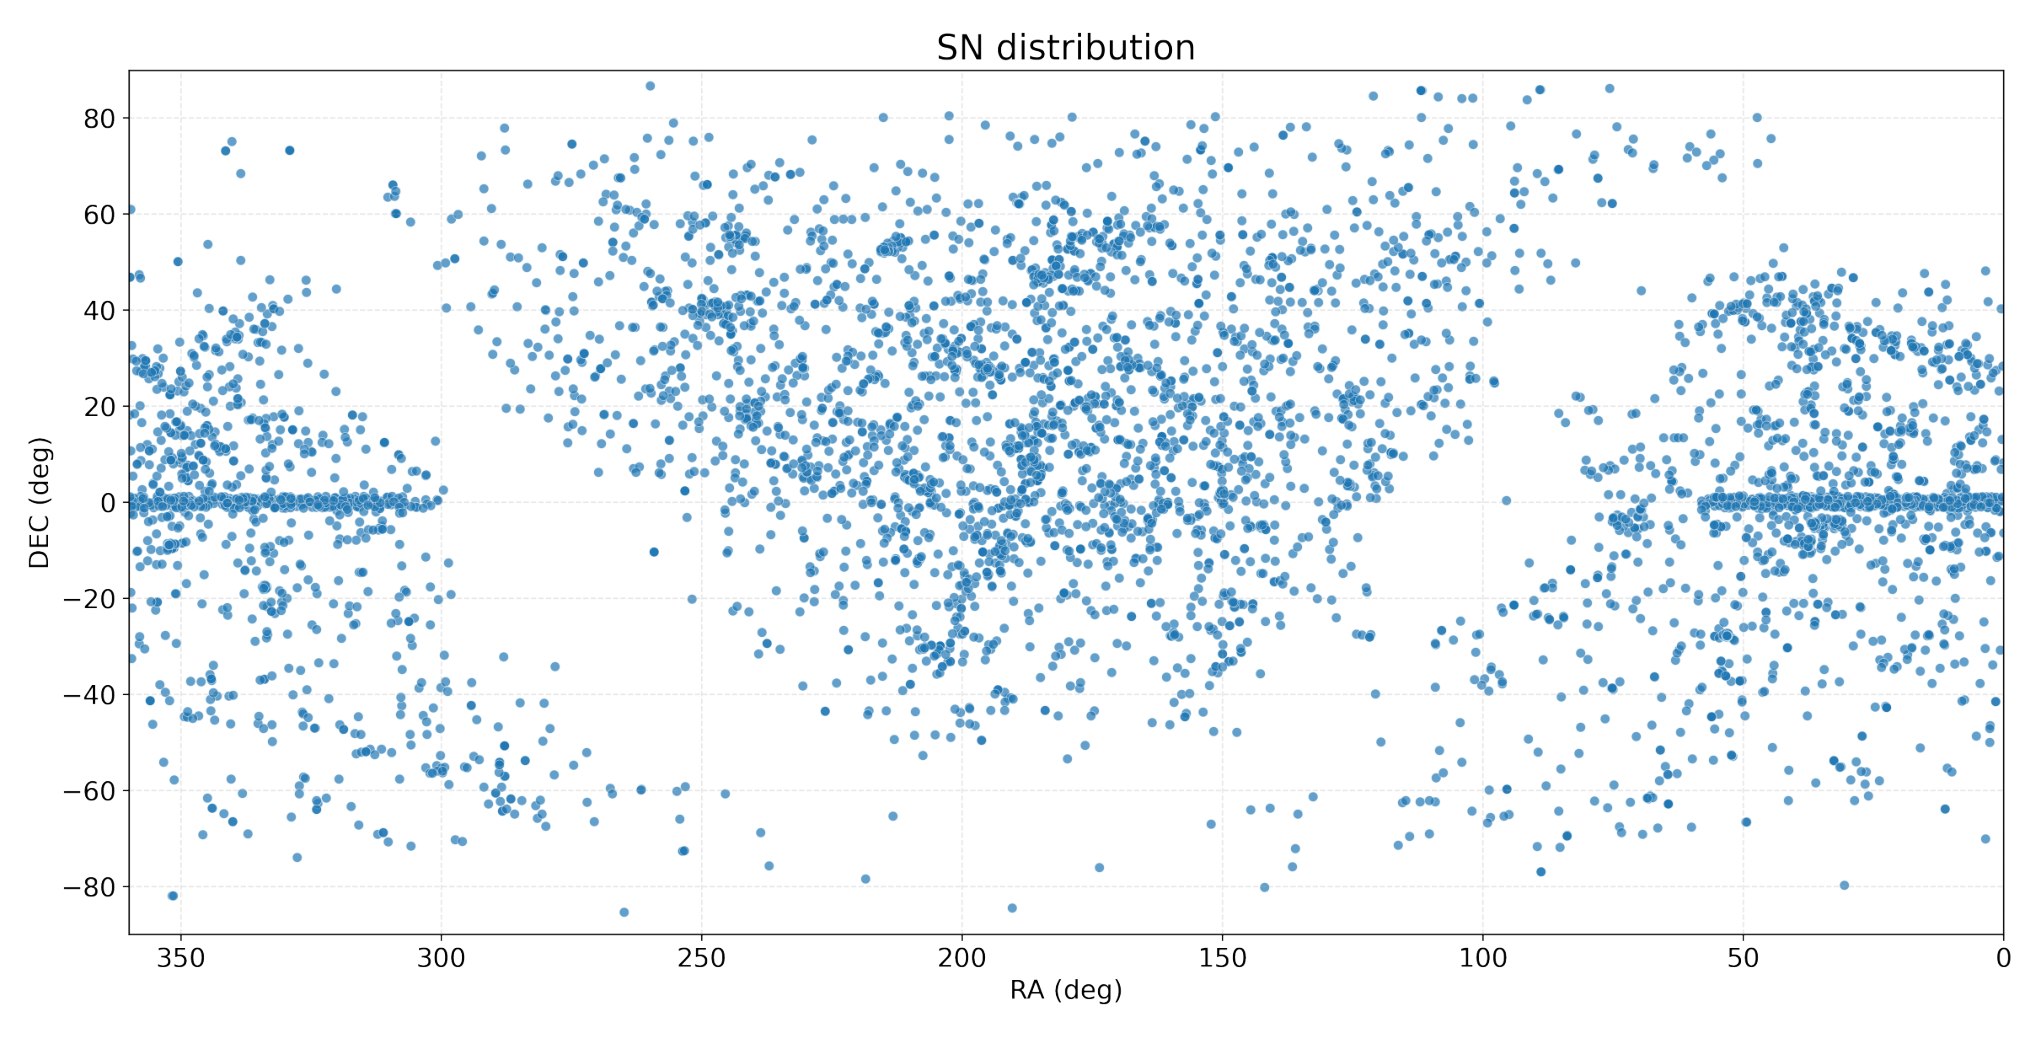
A broad V-shaped band with almost no objects is clearly visible. This feature corresponds to the projection of the Galactic plane onto the celestial sphere. Because the Galactic disk contains large amounts of gas and dust, light from extragalactic supernovae is absorbed, and distant sources in this region remain unobservable.
b) The selected sky region contains a total of 1090 supernovae with redshifts in the range . The corresponding distribution (Fig. 2) shows a sharp decline in the number of detections for .
c) After applying the redshift cut (), the sample is reduced to 329 objects. Although this number may seem modest, it already yields pairwise distances for statistical analysis.
At such low redshifts, distances are estimated from the velocitydistance relation:
The pairwise separations are then obtained using Euclidean geometry. The angular separation follows from the spherical law of cosines:
Finally, the spatial separation is given by the planar law of cosines:
The resulting distribution (Fig. 3) rises up to Mpc and declines thereafter. This behavior reflects both the finite size of the sample and observational selection effects.
d) Within the range Mpc we find 13 784 pairwise distances. To estimate the fractal dimension we fit their distribution with a power law. It is convenient to work in logarithmic form:
The coefficients can be obtained by least-squares regression applied to the binned histogram values. We adopt 100 bins, which is consistent with the heuristic choice for . The resulting distribution on logarithmic axes is shown in Figure 4, together with the best-fitting straight line.
Important remark. When constructing a histogram for logarithmic analysis, the binning must be uniform in , and logarithm of bin counts is taken. Applying logarithms to counts from linearly spaced bins produces a biased slope, since the data points are not uniformly distributed along the -axis. Figure 5 illustrates this incorrect approach.
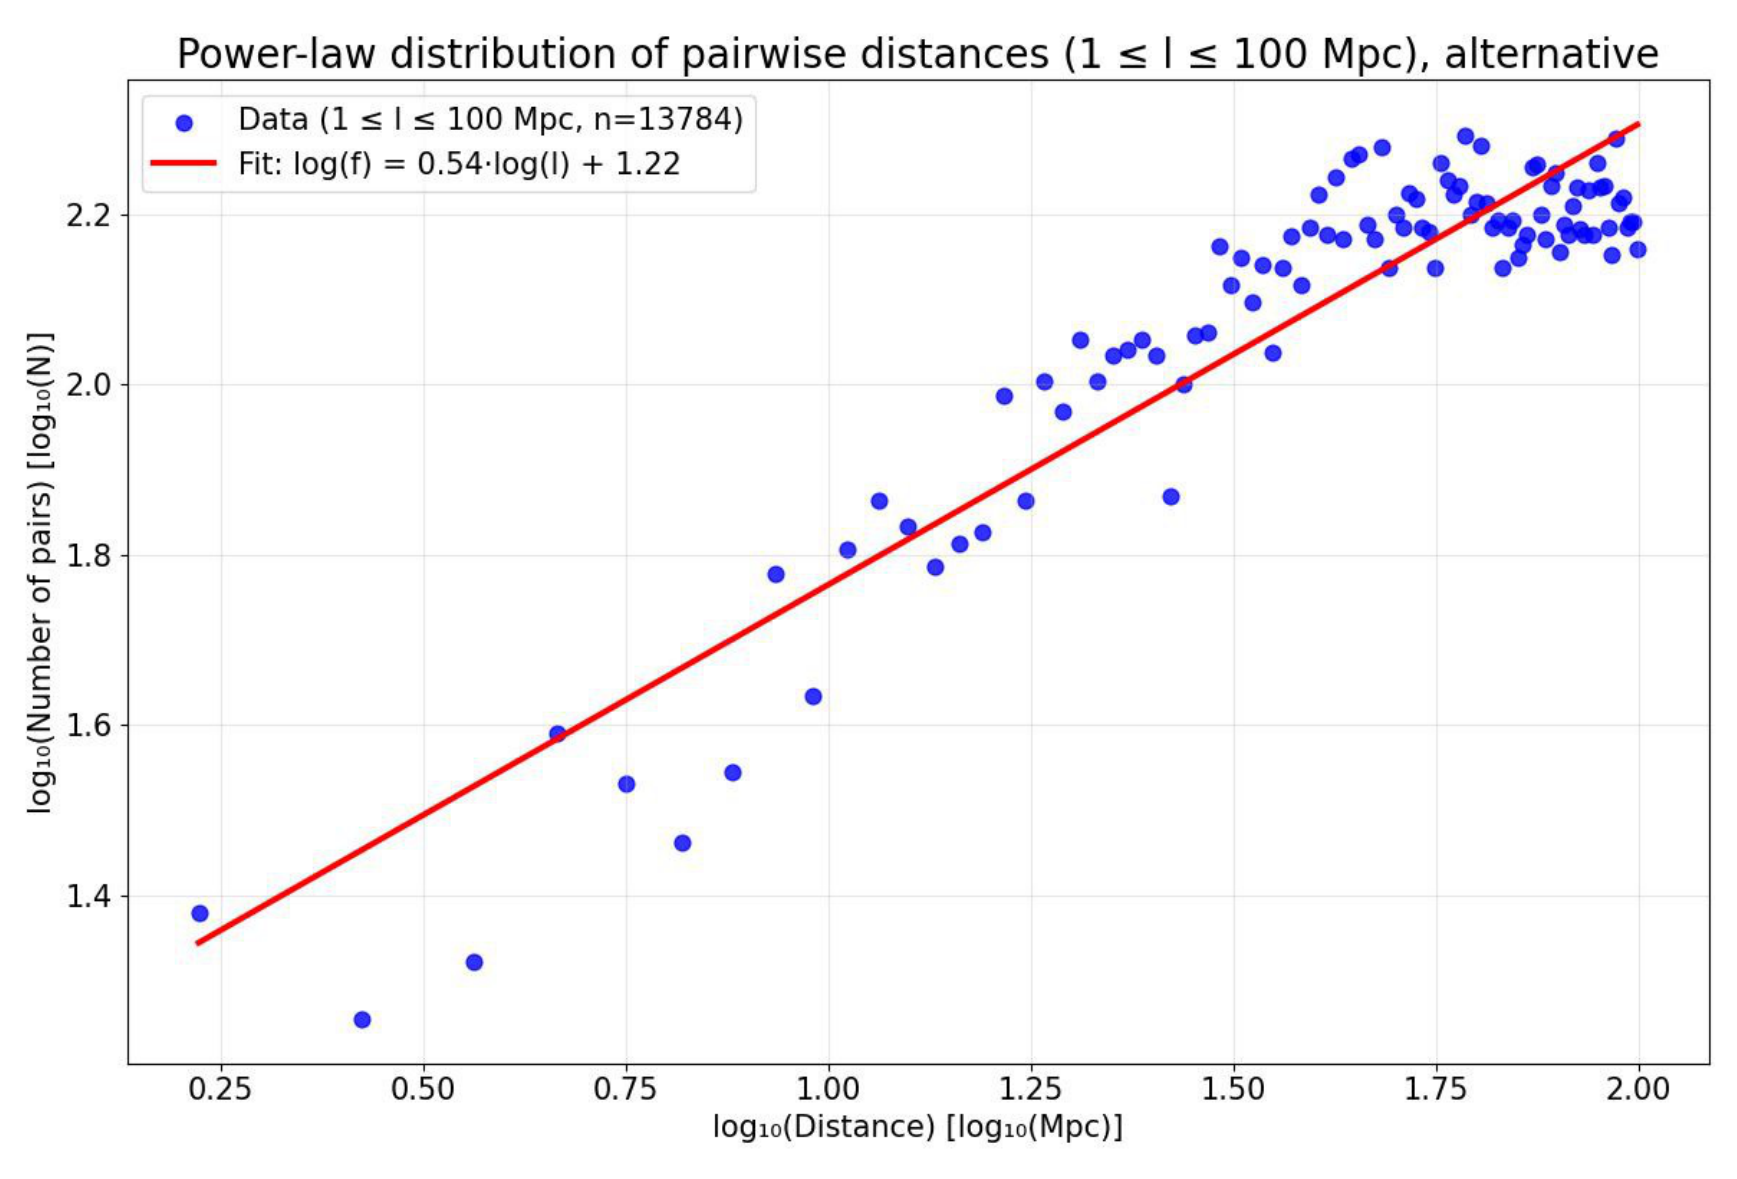
From the regression we obtain . Using Mandelbrots empirical rule, the inferred fractal dimension of the three-dimensional distribution is
which indicates that the supernova distribution remains structured rather than homogeneous on these scales.
Note 1. The algorithm employed in this problem follows the approach developed by V. Orlov, A. Raikov, and R. Gerasim.
Note 2. The fractal dimension of the Universe is not fixed, but depends on the observational scale. On relatively small scales ( Mpc), the distribution is highly inhomogeneous: galaxies cluster into groups and small clusters, which in turn align along filaments surrounding large empty voids. The resulting “cosmic web” is clearly visible. Here the fractal dimension is well below 3, reflecting the spongy, network-like nature of the structure.
In the intermediate range (20–100 Mpc), we encounter the transition or cross-over scale. As the sampling volume grows, individual filaments and voids are averaged over, the enclosed number of galaxies increases more rapidly, and the fractal dimension rises toward the homogeneous value of 3.
On the largest observable scales ( Mpc), the Universe becomes statistically homogeneous. While structure is still present, any sufficiently large region contains approximately the same number of galaxies as any other region of equal size. The effective fractal dimension thus approaches , indicating that matter fills space uniformly when averaged over such vast scales.
See, for example, Raikov, A. A., Orlov, V. V. & Gerasim, R. V. Determination of the Fractal Dimensionality of Large-Scale Structure With Type Ia Supernovae by the Method of Pairwise Distances. Astrophysics 57, 287–295 (2014). https://doi.org/10.1007/s10511-014-9334-9.
Marking Scheme:
Question (a) Distribution on the celestial sphere
Correct processing of the initial data — 2 pt.
Constructing the supernova map — 2 pt.
Here and elsewhere, “constructing” implies obtaining the final image; providing the code that generates it is not sufficient.
Detecting and correctly explaining the void region — 2 pt.
Question (b) Redshift distribution
- Correct data processing — 3 pt.
- Constructing the redshift distribution — 2 pt.
Question (c) Pairwise distances distribution
- Correct calculation of the pairwise distances — 3 pt.
- Constructing the distribution of pairwise distances — 2 pt.
Question (d) Power law fitting — 2 pt.
Question (e) Result for fractal dimension — 2 pt.
Points are awarded if a correct and well-founded estimate of was obtained.
Константи
Universal
- Gravitational constant
- Speed of light
Astronomical
- Astronomical unit
- Parsec
- Hubble constant
Emission constants
- Stefan–Boltzmann
- Wien’s displacement
Earth
- Radius
- Obliquity of ecliptic
- Orbital period
Sun
- Radius
- Mass
- Absolute magnitude (bol.)
- Effective temperature
- Luminosity
Оригинал в Архива: OWAO_2025_Practical_Problems.pdf · решение от архива: OWAO_2025_Practical_Solutions.pdf