RMPh 2017, Експеримент, 28 октомври — Задача 1. Experimental Problem
Romanian Master of Physics 2017 — Experimental Exam - October 28, 2017 · 28 октомври 2017 г.
Внимание: Бележка към темата
The official solutions (answer sheet) exist only in Romanian and are reproduced verbatim in Romanian.
Условие
The experimental problem proposes you to study and calibrate a device dedicated to light polarization measurement and to use the calibrated device to determine the unknown concentration of a sugar solution in water.
For this experimental problem, you are not required to calculate errors.
2. Description of experimental setup
On the work table are components and electrical, optical and mechanical devices.
Warning! Care should be taken not to shine the laser beam or its reflection into your eye or to the eye of another person
Warning! Carefully handle the components of the experimental device, so as not to damage them, as these components will not be replaced!
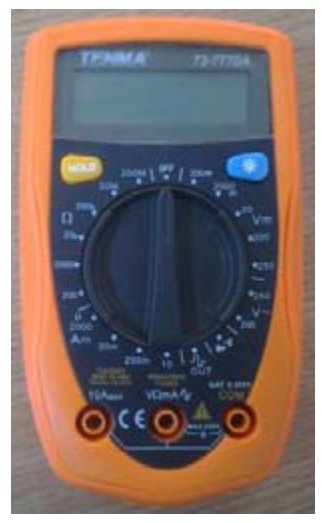
| 1 | Digital multimeter | The appropriate terminals of the multimeter are used to connect the wires. For voltage measurement set the selection knob to in DC range . The indication is expressed in mV. When the multimeter is not in use, turn the selection knob on OFF. |
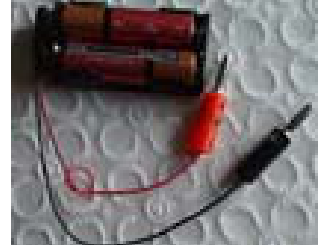
| 2 | Battery | The battery provides voltages up to 3V. The red pin is the positive terminal of the battery |
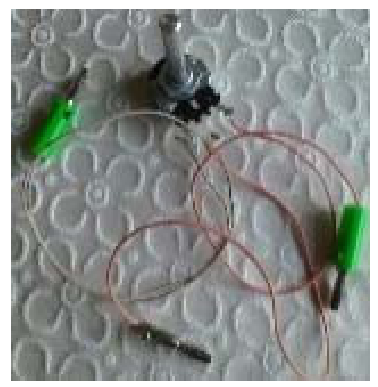
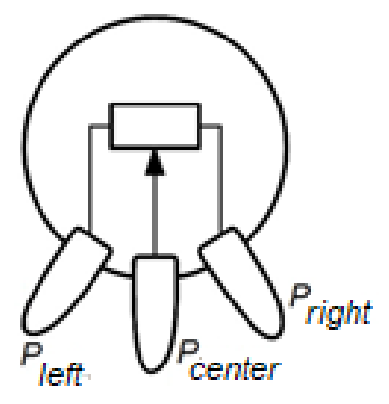
| 3 | Potentiometer | Potentiometer is a 22kΩ variable resistor. The ends of the resistance and the cursor are attached to the three metal terminals(pins) marked with , , .The potentiometer diagram is shown in the figure. |
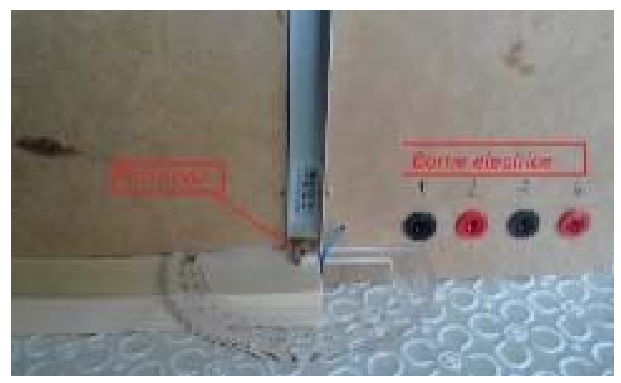
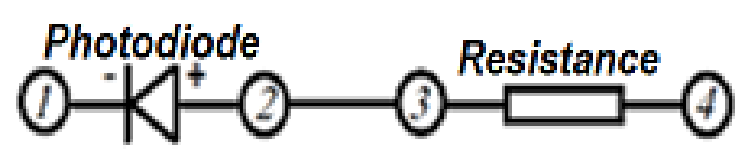
| 4 | Electrical circuit | The electrical circuit is composed of a photodiode, a load resistor and four terminals. Electrical resistance of the resistor is100 Ω. The image below present how to connect to terminals1, 2, 3 and 4. |
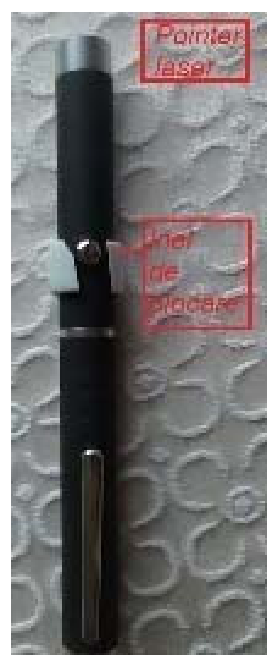
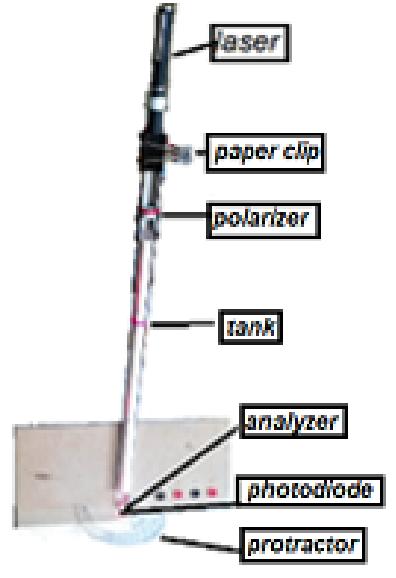
| 5 | Pointer laser | A paper clip can lock the laser button in the closed position. When not in use, the laser closes. Using the ring (see 6) and one of the paper clip (see 7), the laser is fastened to the upper end of the holder (see 8). The beam of the laser must fall on the photodiode. |
| 6 | Ring | The ring is used to properly fix the laser on the vertical support.The ring should be fastened as close to the end the light is emitted. |
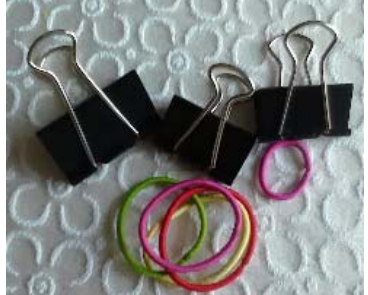
| 7 | Paper clips and rubber bands | The paper clips and the rubber bands serve to adequately fix the laser, polarizer and tank to the vertical holder. |
| 8 | Plate supporting the vertical holder | The plate is used to support the vertical holder on which the laser, polarizer and cuvette are fixed. The laser assembly (laser,ring, paper clip) should be fastened as high as possible on the vertical holder so that the beam can be easily directed towards the surface of the photodiode. A protractor is fixed on the holder to determine the position of the analyzer(see 12).This position is indicated by the toothpick fixed on the analyzer, which can be turned above the photodiode. |
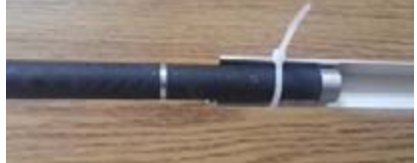
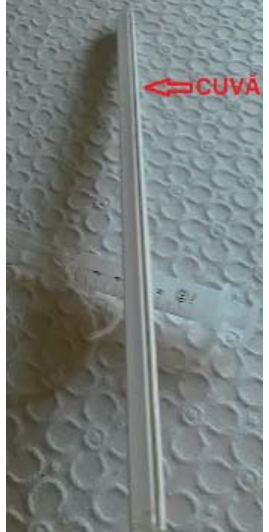
| 9 | Small cylindrical tank(cuvette) | The tank is a transparent cylindrical tube fixed in a plastic rail. The tank is closed at the bottom with a glass plate with plane parallel faces. |
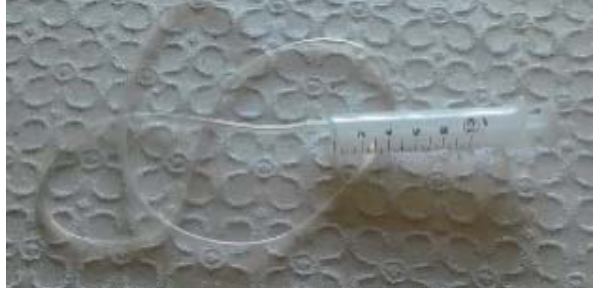
| 10 | Syringe and hose | It is recommended that once fixed, the tank is not moved. Injecting and withdrawing liquids from the cuvette is done using the syringe to which hose is attached. |
| 11 | Storage beakers for solutions | There are four storage beakers on the table with the concentrations listed on the labels. On the work table, there is a beaker in which to pour the liquids you no longer use in the experiment. |
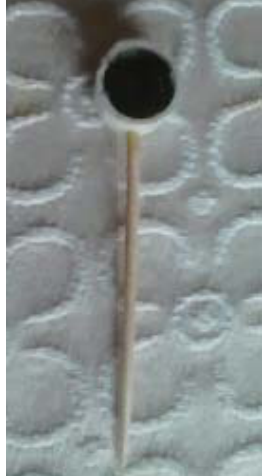
| 12 | The analyzer | The analyzer is a small cylinder, with upper part a piece of polarizing filter film. On the side is attached a toothpick that serves to indicate the angle of rotation. The analyzer is placed above the photodiode. At the beginning of any set of measurements the analyzer needle must points toward the 90-degree angle of the protractor. |
| 13 | The polarizer | The polarizer is a small cylinder having on its upper side a piece of polarizing filter film. The polarizer is fixed on the vertical holder, immediately under the laser. Before finishing, it is rotated so that it is in the „crossed” position with the analyzer. |
| 14 | Ruler | The ruler is used to determine the length of the liquid column in the cuvette. |
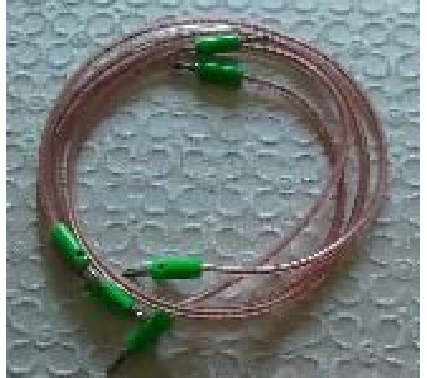
| 15 | Four electrically conductive wires, used for electrical connections | The conductive wires are used to connect the voltmeter to measure the voltage across the photodiode and across the load resistor. |
3. Theoretical considerations
3.1 POLARIZATION
In classical optics, the oscillations of electric and magnetic fields in electromagnetic wave occur in directions perpendicular to the propagation direction. It is said that the light is polarized linearly if the oscillation of each of the fields occurs in one direction; the direction of the electric field oscillation is defined as the polarization direction.
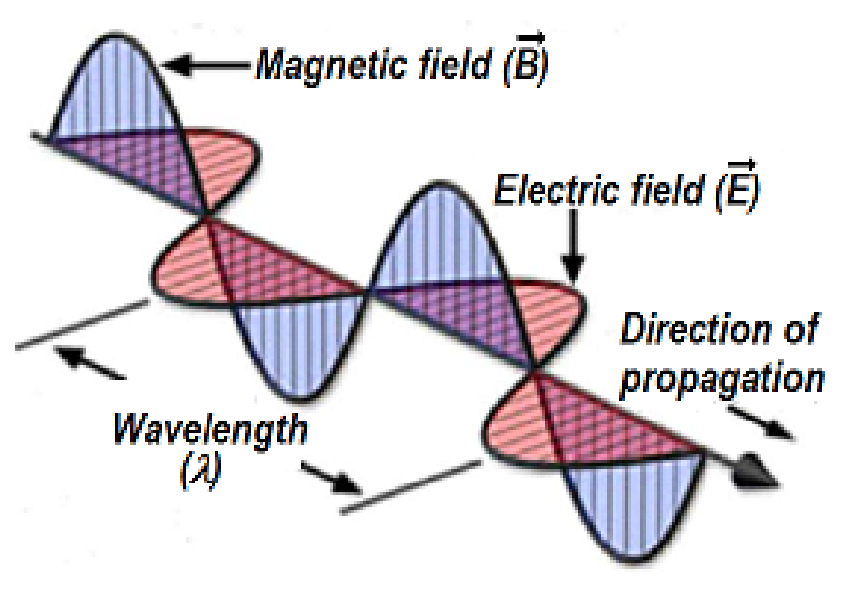
Most naturally occurring light sources emit unpolarized light. Lasers emit polarized light, and laser diodes (of the type used in the laser pointers) emit partially polarized light.
There are polarizing filters-films that select light with a certain direction of polarization. Such a filter transmits only the component of the polarized light along a particular direction and absorbs the perpendicular component on the respective direction.
In Figure 1, the transmission direction of the filters is for the left filter, and for the right filter. From the unpolarized beam that reaches the first polarization filter, called polarizer, only the part that has the electric field parallel to the axis passes on. From the polarized light beam in the direction that reaches the second polarizing filter, called the analyzer, only the part with the electric field parallel to the axis passes on.
As can be seen from the analysis of the bottom right detail of the image in Figure 1, the electric field vector of light polarized due to polarizer, can be resolved into two perpendicular components and . The component can pass through the analyzer, while component is completely blocked.
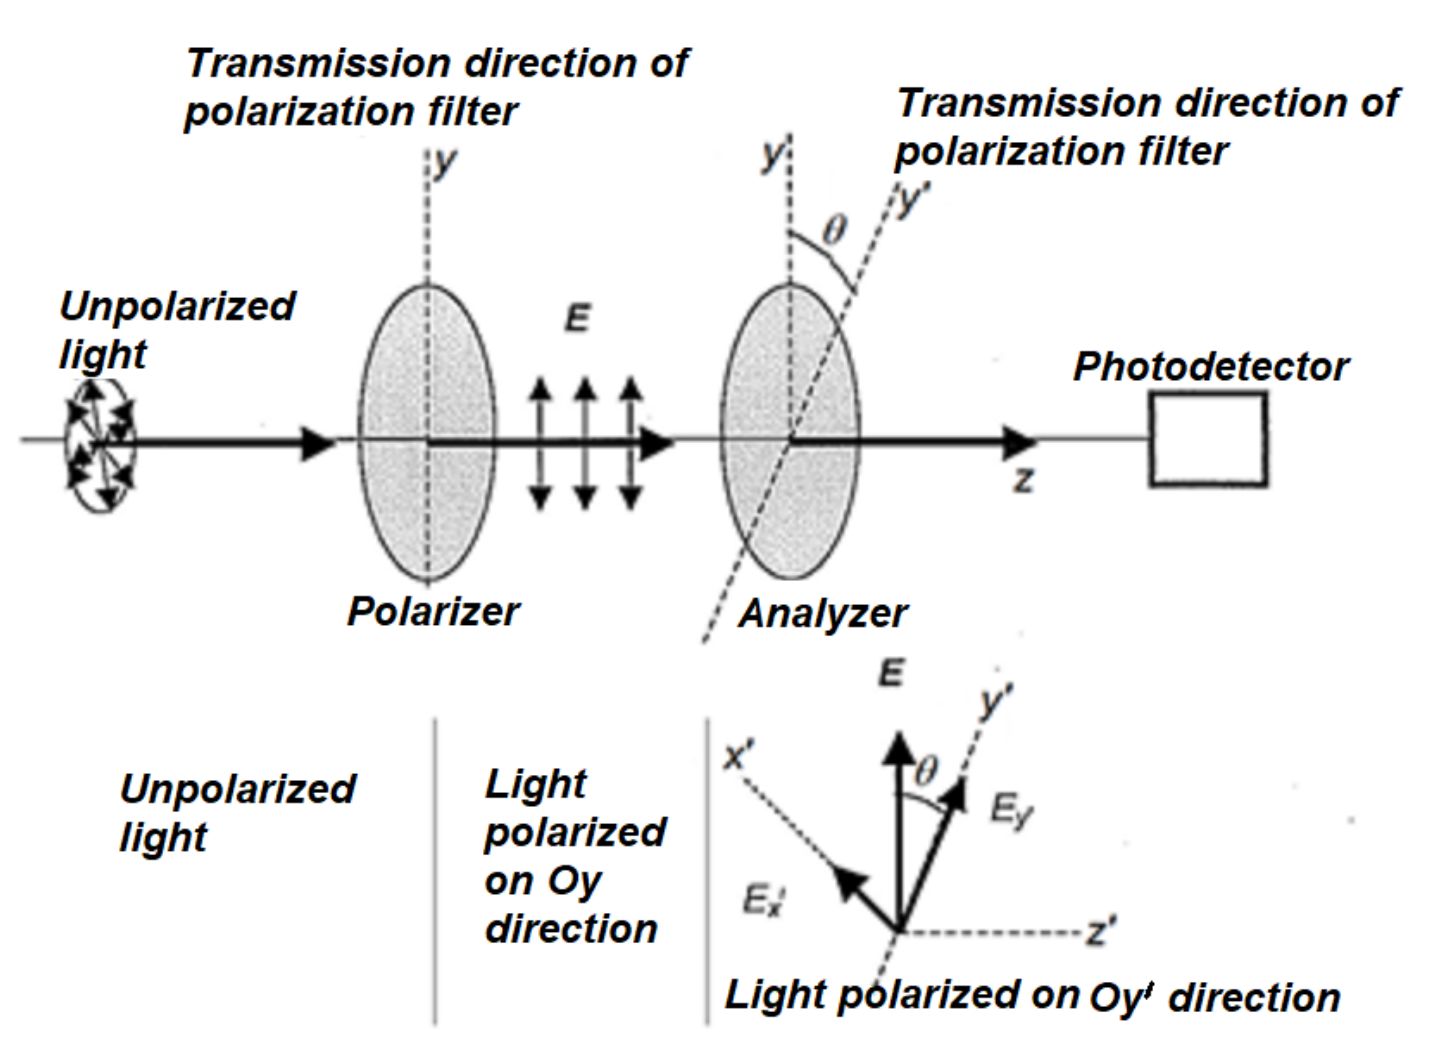
Intensity of light is proportional to the square of the amplitude of the electric field, . Assume that the angle between the polarizer and the analyzer transmission directions is . If is the intensity of light in the space between the two polarization filters, then the intensity of the light passing beyond the analyzer will depend on the angle , according to the relationship
This dependence of the intensity of light transmitted through the polarizer – analyzer system is known as Malus’s law. According to this law, under ideal conditions, light does not reach the photodetector, if the polarizer and analyzer are crossed (they have perpendicular transmission axes). When the transmission axes of the polarizing filters are parallel, the signal of the photodetector is maximum.
3.2 Optical activity
For a linearly polarized light beam, the plane containing the propagation direction and polarization direction is called the polarization plane.
The optical activity is represented by the rotation of polarization plane of a linearly polarized light beam when passing through certain materials. The situation is shown in the image in figure 2. The phenomenon occurs only in materials called chiral which, at the microscopic level, lack the reflection symmetry.
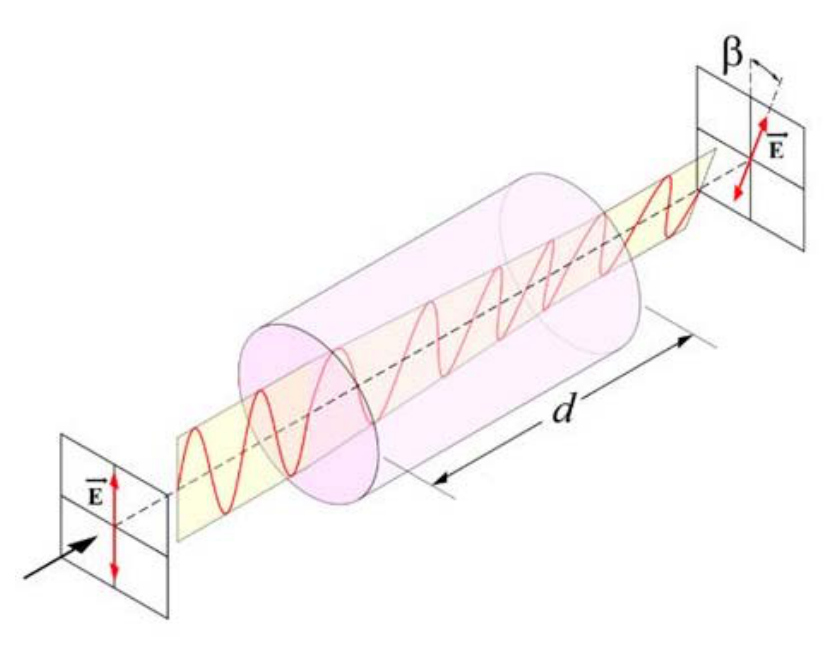
Optical activity can also be seen in solution containing chiral molecules, such as sugars. The rotation of the polarization plane can be either clockwise, right (dextrorotatory compounds) or left (for levorotatory compounds) depending on the stereoisomer that is present or dominant in the medium traversed by the polarized light beam.
For a given substance, the angle of rotation of the polarization plane is proportional to the length of the path through the material and, for a solution, proportional to its concentration :
3.3 Photodiode
In the proposed experiment, a photodiode is used to detect light intensity; this is a diode that allows the conversion of light energy into electrical energy. Characteristic of any diode is its non-ohmic behavior.
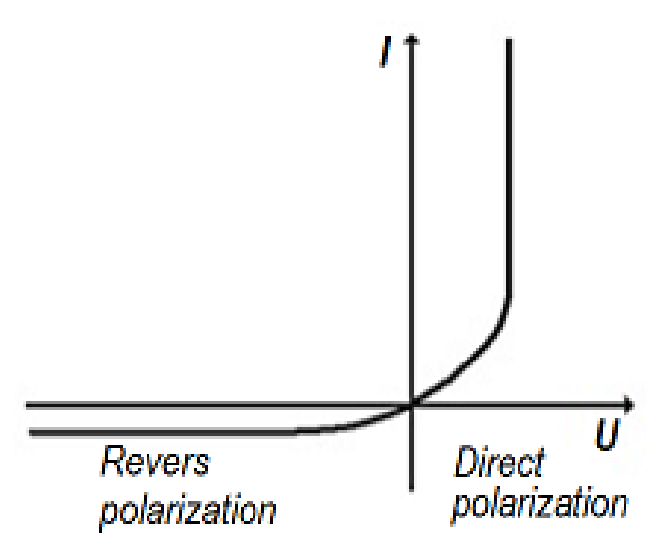
The relationship between the intensity of the electric current flowing through a diode and the potential difference applied to it has the expression:
where is absolute value of elementary charge, and is Boltzmann constant. For experiments under normal conditions, and . The parameters that determine the nonlinear response to potential difference U, are diode factor and saturation current . The specific values of these parameters are: and .
Current versus voltage characteristics is shown in figure 4 and describe the diode feature as one-way” current valve”, which allows the electric current to pass when diode is direct polarized and blocks the current for reverse polarization. For different values of voltage, the diode has different resistance values. At high direct polarization, the diode resistance is zero. At high reverse polarization, the diode resistance became infinity.
A photodiode on which light falls is equivalent to a diode to which a current generator is connected in parallel; the intensity of current is proportional to the light flux falling on the active surface of the photodiode.
In this situation, the expression of characteristic of photodiode becomes:
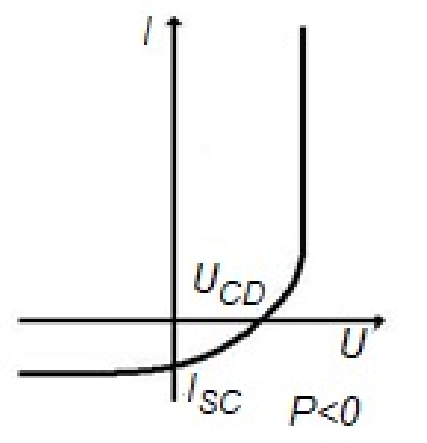
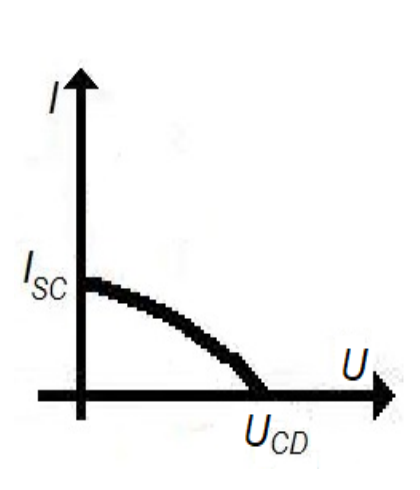
Graphical representation of this characteristic is shown in figure 4. As you can see, the graph is "lowered" and penetrates the forth trigonometrical quadrant. Appears a value range I-U where the currents are negative for positive voltages, which determines negative power values - a characteristic specific to the electric generators. Negative (debited) powers are different for different points of the I-U characteristic. The voltage value for current cancellation is called open circuit voltage, and the value of the zero-voltage electrical current is called the short-circuit current.
The ratio of the maximum photodiode power to the product is called the fill factor .
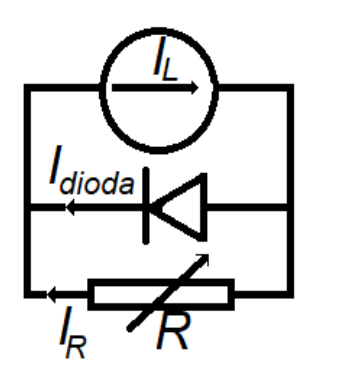
A characteristic I-U of the illuminated photodiode, in the absence of external polarization, can be measured. In such a situation, the diode is said to operate as a photoelement. Its equivalent scheme is - in this case - that shown in Figure 5.
The characteristic points are obtained by varying the load resistance R.
The I-U characteristic obtained, of the type in Figure 6, is actually the part of the fourth quadrant of the photodiode characteristic - for which the axis of the current has the sense inversed.
4. Tasks
Respond to the requirements of the experimental question, by properly completing the boxes in the Answer Sheet.
Please note your student code on the first page of the Answer Sheet.

4.1 Characterization of the photodiode
4.1.1 Measurement of open circuit voltage and short-circuit current
The photodiode is connected to the terminals marked1 (negative terminal) and 2 (its positive terminal). The electrical connections of the photodiode are shown in the diagram in figure 7.
Between the terminals 3 and 4 a resistance is connected. If the positive photodiode terminal is connected to the positive terminal of the battery and its negative terminal at the negative terminal of the battery, the diode is said to be forward biased (the direct polarization). Install the laser pointer at the top end of the vertical holder. Start the laser and adjust its position so that the upper surface of the photodiode is uniformly illuminated.
Use the measurement device provided (function selector in positions and )
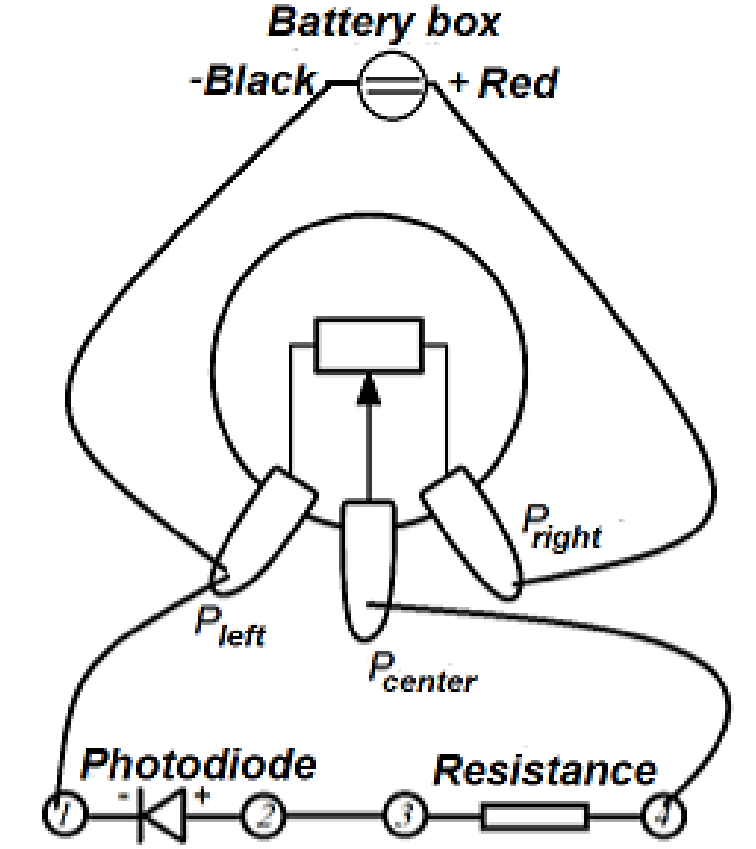
4.1.1.a. Measure the values of the open circuit voltage and the short-circuit current and write measured values in the appropriate box in the Answer Sheet. [0,5 т.]
Pay attention! Next, you will use the multimeter only to measure voltages.
You will determine the value of the current that passes through the diode by measuring the voltage determined by this current on the resistor , connected in series with the photodiode.
4.1.2 Measurement of the characteristic in the fourth trigonometric quadrant (in photoelement mode)
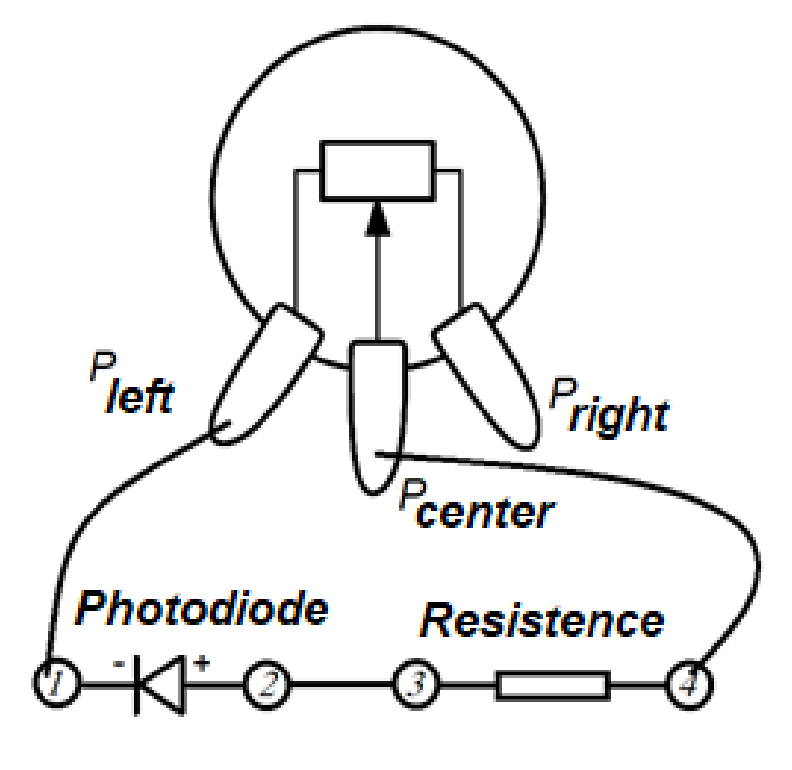
Connect the pins and of the potentiometer to the terminals 1 and 4 of the measuring device. The circuit diagram is shown in figure 8. Rotating the potentiometer knob, vary the resistance of the photodiode circuit.
Turn on the pointer laser and illuminate the surface of the photodiode. Always keep in mind that during the measurements, the illumination of the photodiode will not change. Vary the potentiometer resistance (rotating the knob). For each position of the potentiometer, measure the voltage drops on the photodiode and on the load resistance.
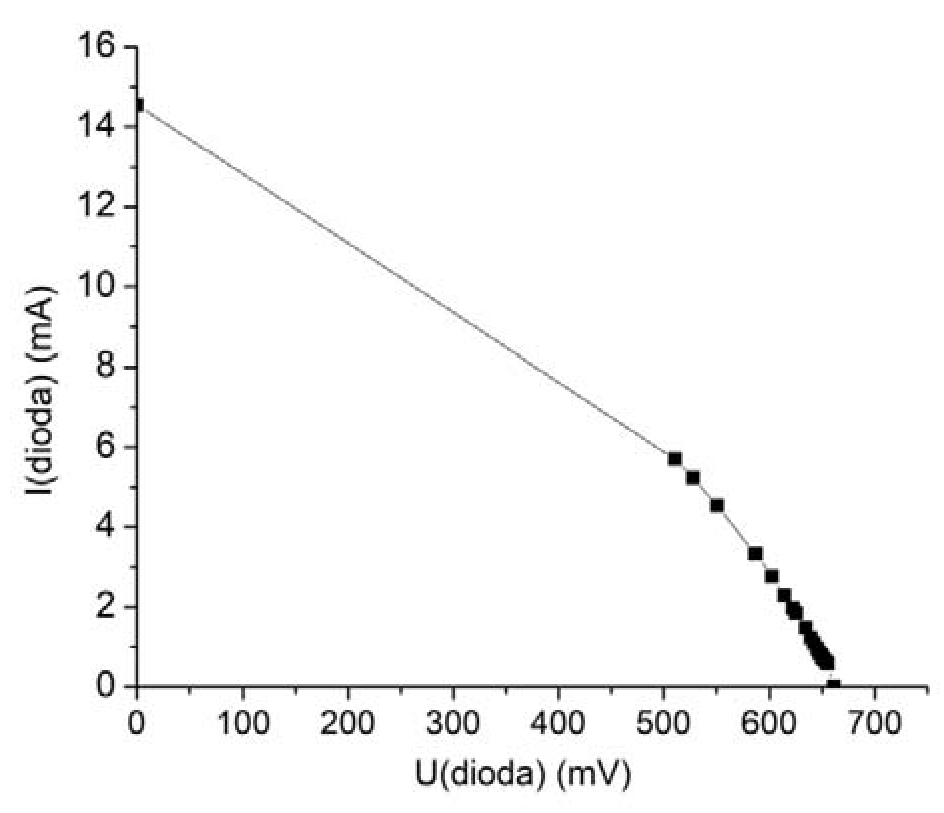
4.1.2.a. Fill in Table 1 of the Answer Sheet with pairs of current-voltage - measured data. [2 т.]
4.1.2.b. Draw the graph of the data recorded, including those obtained in the task4.1.1. a. Name the graph you plotted Graph 1. [1 т.]
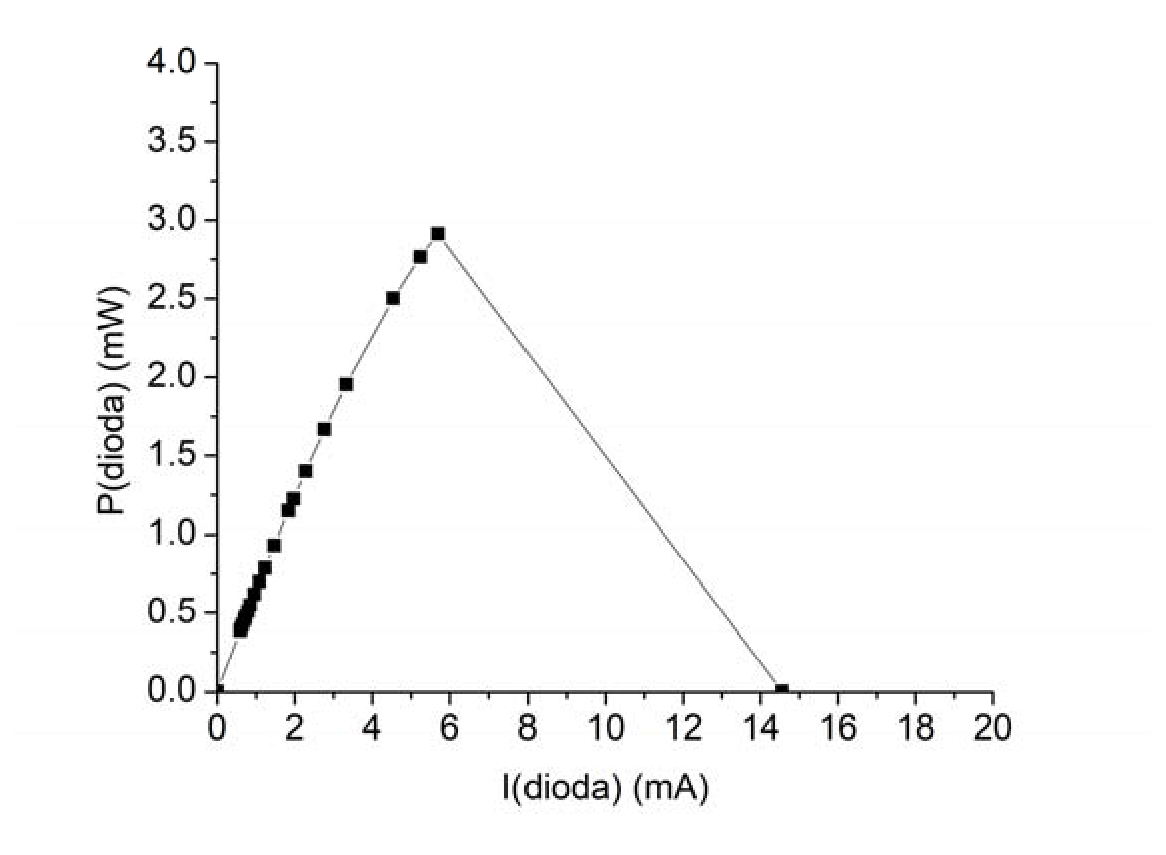
4.1.2.c. Draw the graph of the power output by the diode (as generator) as function of the current through the photodiode. Name the graph you plotted Graph 2. [1 т.]
4.1.2.d. Determine the value of the fulfill factor FFF for the photodiode provided. [0,5 т.]
4.1.3. Measurement of the characteristic in the first trigonometric quadrant
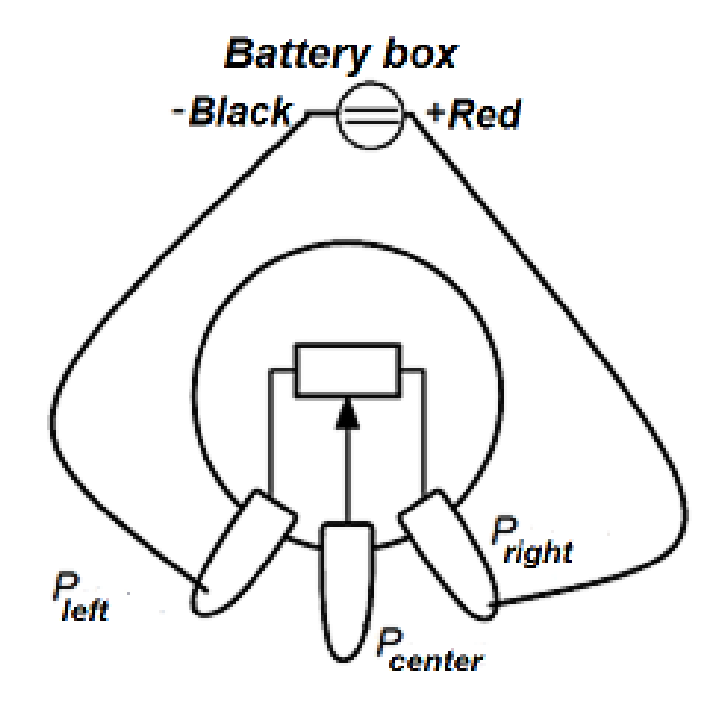
By using the provided voltage source and the potentiometer set up the electrical circuit according to the electrical diagram in Figure 9. The circuit thus constructed provides polarization with variable voltages for the photodiode, playing the role of a variable voltage source. Connect the negative pole of the source to the left contact of the potentiometer. Connect the variable source to the circuit on the board so that the diode is polarized directly (Figure 10). The left pin of the potentiometer connects to terminal 1, and the center pin - the cursor - to terminal 4.
4.1.3.a. With the laser turned off, measures pairs of I-U values for currents . Fill in Table 2 from the Answer Sheet with measured pairs current-voltage. [2 т.]
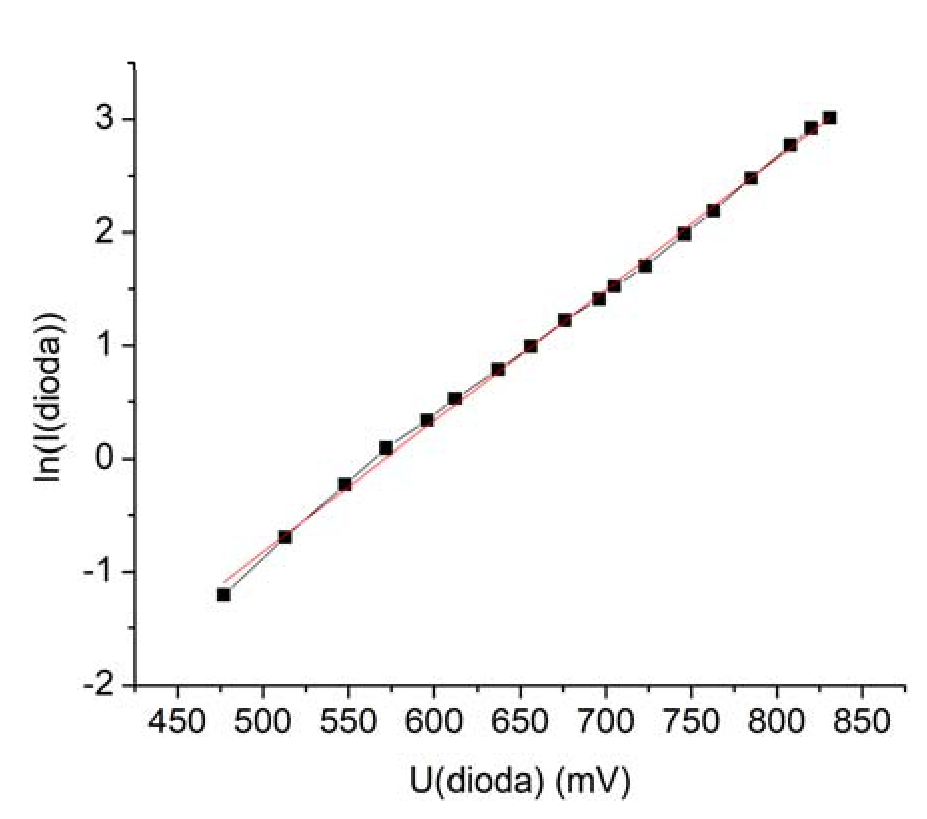
4.1.3.b. Determine a linearized expression of characteristic , suitable for direct polarization. [0,5 т.]
4.1.3.c. Using the experimental data obtained and the expression deduced in the task 4.1.3.b., determine the value of the parameter of the photodiode used. [1 т.]
4.1.4 Measuring the characteristic in the third trigonometric quadrant
By inverting the battery connections to the potentiometer, the photodiode becomes reverse polarized.
4.1.4.a. With the laser on and with the illuminated photodiode, measures pairs of values I-U for polarization voltages . Fill in Table 3 on The Answer Sheet with the current-voltage pairs measured in this task. [2 т.]
4.1.4.b. Draw the graph of I-U characteristic in the third quadrant, for the illuminated and polarized photodiode. Name the graph you plotted in Graph 3. [1 т.]
4.2 Calibration of the electrical system for measurements on the intensity of light
This part of the problem has the goal to establish a link between the photodiode's electrical signal (reverse polarization current) and the intensity of the light. To vary the light intensity, use the laser assembly, the polarizer, the analyzer, and consider the Malus law, described by relation (1).
Mutual orientation of polarizer and analyzer
Make a primary adjustment of the reciprocal position of the polarizer and analyzer transmission directions. For this, look through the polarizer and analyzer overlapped; rotates the polarizer until the light don’t pass through the area where the polarizing filters overlap. Mark the position on the polarizer next to the indicator needle on the analyzer. The determined position is the approximate position in which the polarizer and the analyzer are crossed. Place the analyzer over the photodiode with the needle in position and fix the polarizer crossing with the analyzer.
4.2.1 Measuring the electrical signal of the photodiode
Place the analyzer over the photodiode with the indicator needle at position 90 degrees. Attaches the polarizer to the top of the vertical holder in the cross position with the analyzer - underneath the laser that is also attached to the vertical support. Adjusts the position of the laser so that the surface of the photodiode is fully illuminated.
4.2.1.a. Rotates the analyzer from 5 to 5 degrees across the range of possible values (). For each position of the analyzer, write down in Table 4, the indication of the voltmeter coupled to the resistance R corresponding to the inverse current intensity value of the photodiode. The intensity value of this electrical current is directly proportional to the light intensity that reaches the photodiode. [1 т.]
4.2.2 Calibration of the electrical system for light intensity measurements
4.2.2.a. Identifies the correct position of cross-filters. Correct - if appropriate - the values of angle between the polarizer and the analyzer transmission directions. Fill in the values of this angle in Table 4, used in the task 4.2.1.a. Also, fill in the same table the values , for all values of the angles measured and corrected. [0,5 т.]
4.2.2.b. Plot the graph of the dependence . Name Graph 4, this graphical representation. [1 т.]
4.2.2.c. Determine the numerical values of the and parameters and indicate their physical meaning. [1 т.]
4.3 Polarimetric measurements
In optically active solutions, the angle of rotation of the polarization plane is proportional to the solution concentration c and the length d of the light pathway through the solution. In this part of the problem, you will experimentally check the dependence and determine the unknown concentration of a sugar solution in water.
Assemble the cuvette for the sugar solutions on the vertical holder. Align the laser beam so that the light falls on the photodiode without reflections on the walls of the cuvette or on the edges of the vertical support. Reverse the battery's polarity, so that the diode becomes reverse-biased. Since the cross-filter situation (minimum electrical signal) is easier to observe than the condition of the filters with parallel transmission axes (reverse current maximum), it is recommended to track the minimum electrical signal.
4.3.a. With the empty cuvette, and the analyzer positioned so that the needle indicates , rotate the polarizer until the crossed filter situation is reached.
Using the syringe and the hose, add the liquid with the concentration , step by step, so that the length of the fluid column increases each time by three centimeters. For each of the lengths d of the liquid column, write down the value of the indicated angle and determine the value of the angle of the polarization plane at which the minimum signal is achieved, which corresponds to the crossed polarizer-analyzer.
Write down in Table 5 the values of the d column lengths, the angles indicated by the indicator needle and the corresponding angles. [1 т.]
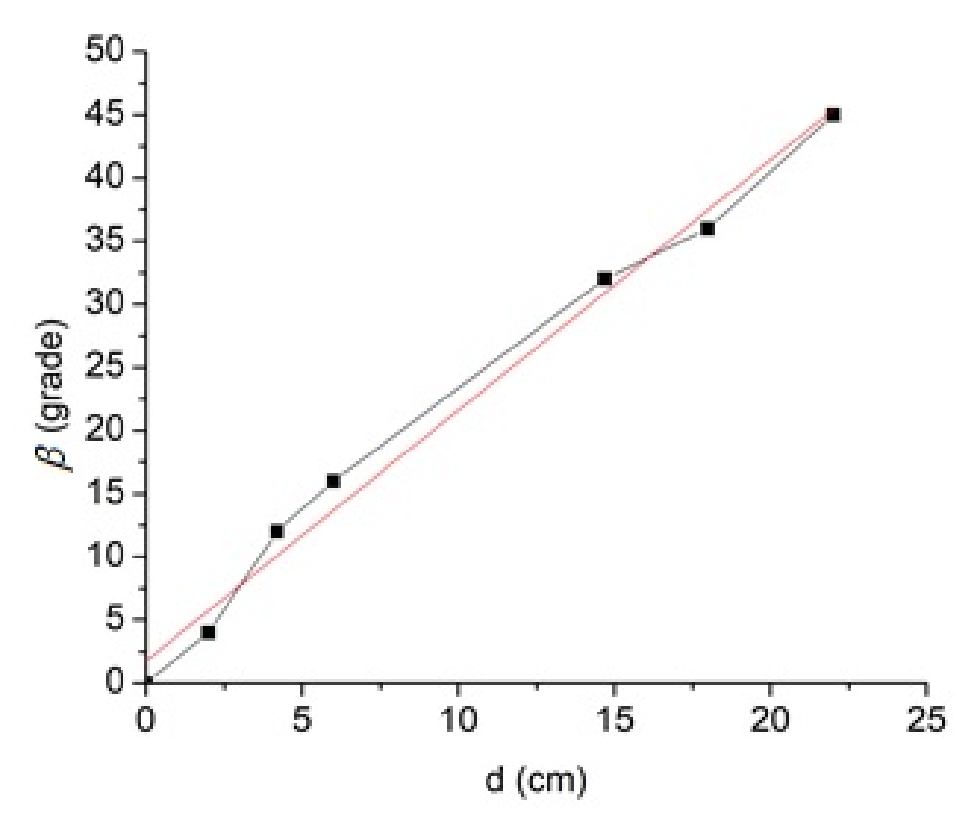
4.3.b. Plot the graph . Name Graph 5, the graphical representation that you obtained in this task. [1 т.]
4.3.c. Measure the values of the angle for columns of equal lengths of the solutions with the concentrations , , . Write down the numerical values in Table 6. [1 т.]
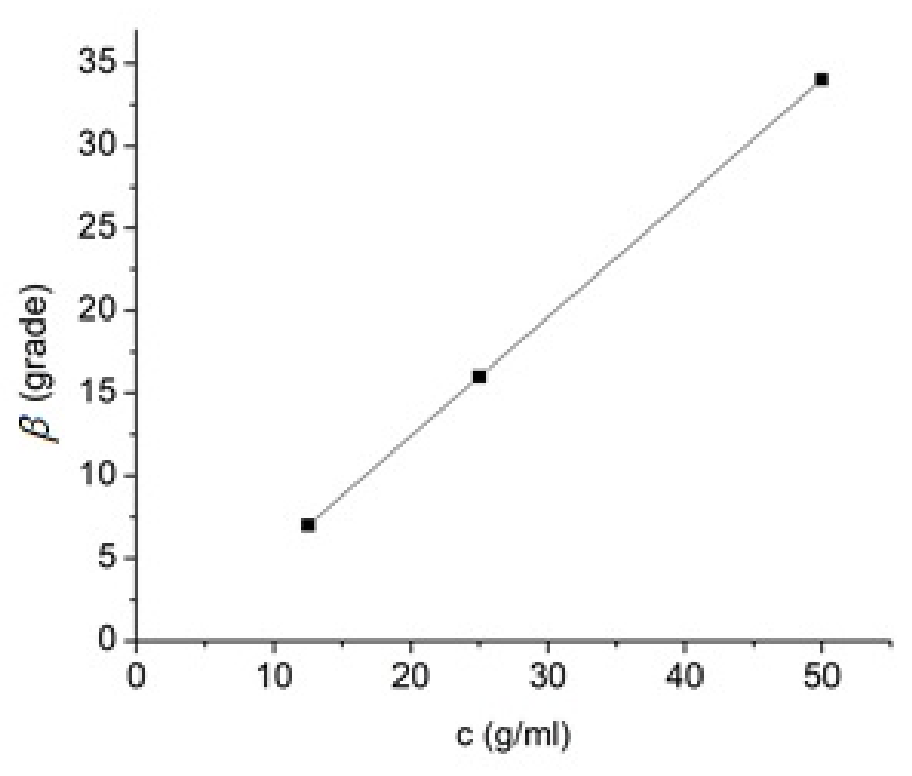
4.3.d. Plot the graph and name it Graph 6. [1 т.]
4.3.e. Measure the value of the angle for a column of length of the unknown concentration solution and notes the value obtained in the appropriate box on the Answer Sheet. Use the graphical representation obtained in the task 4.3.d., determine the value of unknown concentration and write down the value obtained in the appropriate box on the Answer Sheet. [1 т.]
© Subject proposed by:
Prof. Dr. Delia DAVIDESCU
Conf. Univ. Dr. Adrian DAFINEI
Prof. Dr. Dan Ovidiu CROCNAN
Отговори
4.1 Characterization of the photodiode, 4.1.1.a. UCD = 667 mV; ISC = 16,3 mA
Valori măsurate din foaia de răspunsuri oficială.
4.1 Characterization of the photodiode, 4.1.2.d. 0.27
FFF = 0,27 (Pmax = 2,91 mW, UCD = 667 mV, ISC = 16,3 mA).
4.1 Characterization of the photodiode, 4.1.3.b.
4.1 Characterization of the photodiode, 4.1.3.c. 3.3
Se acordă punctajul integral pentru orice valoare a factorului de diodă între 2 și 3,5.
4.2 Calibration of the electrical system for measurements on the intensity of light, 4.2.2.c. a = 0,883; b ≅ 0
Panta a este coeficientul de proporționalitate dintre intensitatea curentului invers al diodei și intensitatea luminii; intercepția b ≅ 0 confirmă legea Malus. Valorile absolute pot fi diferite.
4.3 Polarimetric measurements, 4.3.e. β = 23°; cx = 35 g/cm³
Valori din foaia de răspunsuri oficială; unitatea „g/cm³” este tipărită așa, deși Table 6 și Graph 6 folosesc g/ml.
Решение
Foaie de Răspunsuri
4.1 Caracterizarea fotodiodei
4.1.1 Măsurarea tensiunii de circuit deschis si a curentului de scurtcircuit
4.1.1.a. Măsoară valoarea tensiunii de circuit deschis și pe cea a intensității curentului electric de scurtcircuit și scrie aceste valori în caseta de mai jos (0,50p)
4.1.2 Măsurarea caracteristicii în cadranul trigonometric patru în regim de fotoelement
4.1.2.a. Completează în Table 1 perechile de date curent – tensiune măsurate (2,00p)
Table 1
| Nr | ||||||
|---|---|---|---|---|---|---|
| 1 | 661 | 0 | 0 | 0.00 | ||
| 2 | 655 | 59 | 0.59 | 0.39 | 1110 | |
| 3 | 654 | 61 | 0.61 | 0.40 | 1072 | |
| 4 | 653 | 65 | 0.65 | 0.42 | 1005 | |
| 5 | 651 | 70 | 0.7 | 0.46 | 930 | |
| 6 | 650 | 73 | 0.73 | 0.47 | 890 | |
| 7 | 649 | 79 | 0.79 | 0.51 | 822 | |
| 8 | 647 | 85 | 0.85 | 0.55 | 761 | |
| 9 | 645 | 96 | 0.96 | 0.62 | 672 | |
| 10 | 642 | 109 | 1.09 | 0.70 | 589 | |
| 11 | 639 | 123 | 1.23 | 0.79 | 520 | |
| 12 | 634 | 147 | 1.47 | 0.93 | 431 | |
| 13 | 625 | 184 | 1.84 | 1.15 | 340 | |
| 14 | 622 | 197 | 1.97 | 1.23 | 316 | |
| 15 | 614 | 228 | 2.28 | 1.40 | 269 | |
| 16 | 602 | 277 | 2.77 | 1.67 | 217 | |
| 17 | 587 | 333 | 3.33 | 1.95 | 176 | |
| 18 | 551 | 454 | 4.54 | 2.50 | 121 | |
| 19 | 528 | 524 | 5.24 | 2.77 | 101 | |
| 20 | 511 | 570 | 5.7 | 2.91 | 90 | |
| 21 | 0 | 1455 | 14.55 | 0.00 | 0 | |
Observații:
1. Se acordă tot punctajul dacă în Table 1 sunt înregistrate cel puțin 10 seturi de date experimentale.
2. Se acordă jumătate din punctaj dacă în Table 1 sunt înregistrate 5 - 9 seturi de date experimentale.
3. Nu se acordă punctaj, dacă în Table 1 sunt înregistrate mai cel puțin 5 seturi de date experimentale.
4.1.2.b. Trasează graficul al datelor prelevate, inclusiv a celor obținute în cadrul sarcinii de lucru 4.1.1.a.- Graph 1 (1,00p)
4.1.2.c. Trasează graficul puterii debitate de generatorul electric reprezentat de diodă, ca funcție de intensitatea curentului prin fotodiodă. - Graph 2 (1,00p)
4.1.2.d. Determină valoarea FFF pentru fotodioda utilizată (0,50p)
Între valorile măsurate, puterea maximă debitată apare pentru punctul experimental 20 din Table 1 și are valoarea .
Ținând seama că , rezultă că valoarea factorului de umplere pentru fotodioda utilizată în experiment este
4.1.3. Măsurarea caracteristicii în cadranul unu
4.1.3.a. Cu laserul oprit, măsoară perechi de valori pentru curenți . Completează Table 2 perechile de date curent – tensiune măsurate. (2,00p)
Table 2
| Nr | ||||
|---|---|---|---|---|
| 1 | 831 | 2030 | 20.3 | 3.01062 |
| 2 | 820 | 1860 | 18.6 | 2.92316 |
| 3 | 808 | 1600 | 16 | 2.77259 |
| 4 | 785 | 1190 | 11.9 | 2.47654 |
| 5 | 763 | 890 | 8.9 | 2.18605 |
| 6 | 746 | 730 | 7.3 | 1.98787 |
| 7 | 723 | 550 | 5.5 | 1.70475 |
| 8 | 705 | 460 | 4.6 | 1.52606 |
| 9 | 696 | 410 | 4.1 | 1.41099 |
| 10 | 676 | 340 | 3.4 | 1.22378 |
| 11 | 656 | 270 | 2.7 | 0.99325 |
| 12 | 637 | 220 | 2.2 | 0.78846 |
| 13 | 612 | 170 | 1.7 | 0.53063 |
| 14 | 596 | 140 | 1.4 | 0.33647 |
| 15 | 572 | 110 | 1.1 | 0.09531 |
| 16 | 548 | 80 | 0.8 | -0.22314 |
| 17 | 513 | 50 | 0.5 | -0.69315 |
| 18 | 477 | 30 | 0.3 | -1.20397 |
| 19 | 343 | 1 | 0.01 | -4.60517 |
| 20 | 207 | 0 | ||
| 21 | 63 | 0 | ||
| 22 | 0 | 0 |
Observații:
1. Se acordă tot punctajul dacă în Table 2 sunt înregistrate cel puțin 10 seturi de date experimentale.
2. Se acordă jumătate din punctaj dacă în Table 2 sunt înregistrate 5 - 9 seturi de date experimentale.
3. Nu se acordă punctaj, dacă în Table 2 sunt înregistrate mai cel puțin 5 seturi de date experimentale.
4.1.3.b. Determină o expresie liniarizată a caracteristicii , adecvată pentru polarizare directă. (0,50p)
Pentru tensiuni de polarizare pozitive în expresia caracteristicii, exponențiala este mult mai mare decât unu. Prin urmare expresia caracteristicii devine
sau, prin logaritmare
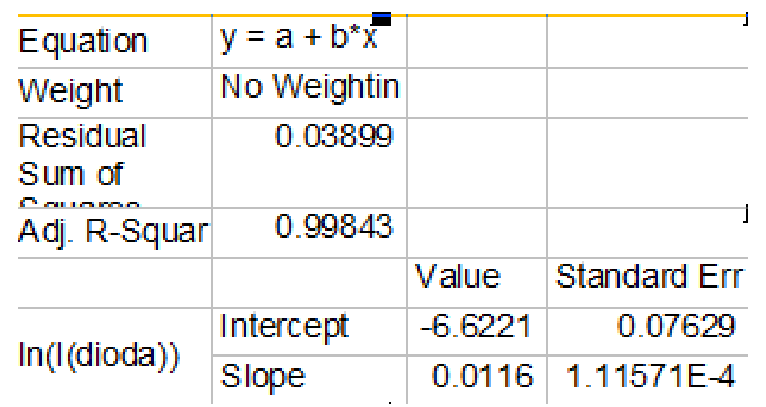
4.1.3.c. Folosind datele experimentale obținute și expresia dedusă la sarcina de lucru 4.1.3.b., determină valoarea parametrului al fotodiodei utilizate. (1,00p)
Ținând seama că sau , se observă că dependența liniară dedusă la sarcina de lucru 4.1.3. devine
și că împreună cu datele din Table 2 mai sus permit determinarea factorului de diodă .
Graficul dependenței descrise de relația (1) pentru datele din Table 2 este prezentat în figura de mai jos
Datele dreptei de fit pentru această reprezentare grafică sunt
Panta dreptei de fit, a cărei expresie este are valoarea . Prin urmare valoarea factorului de diodă este
Observații: 1.Trasarea dependenței grafice este opțională.
2. Se punctează oricare metodă prin care factorul de diodă este determinat corect
3. Se acordă punctajul integral pentru orice valoare a factorului de diodă mai mare decât 2 și mai mică decât 3,5.
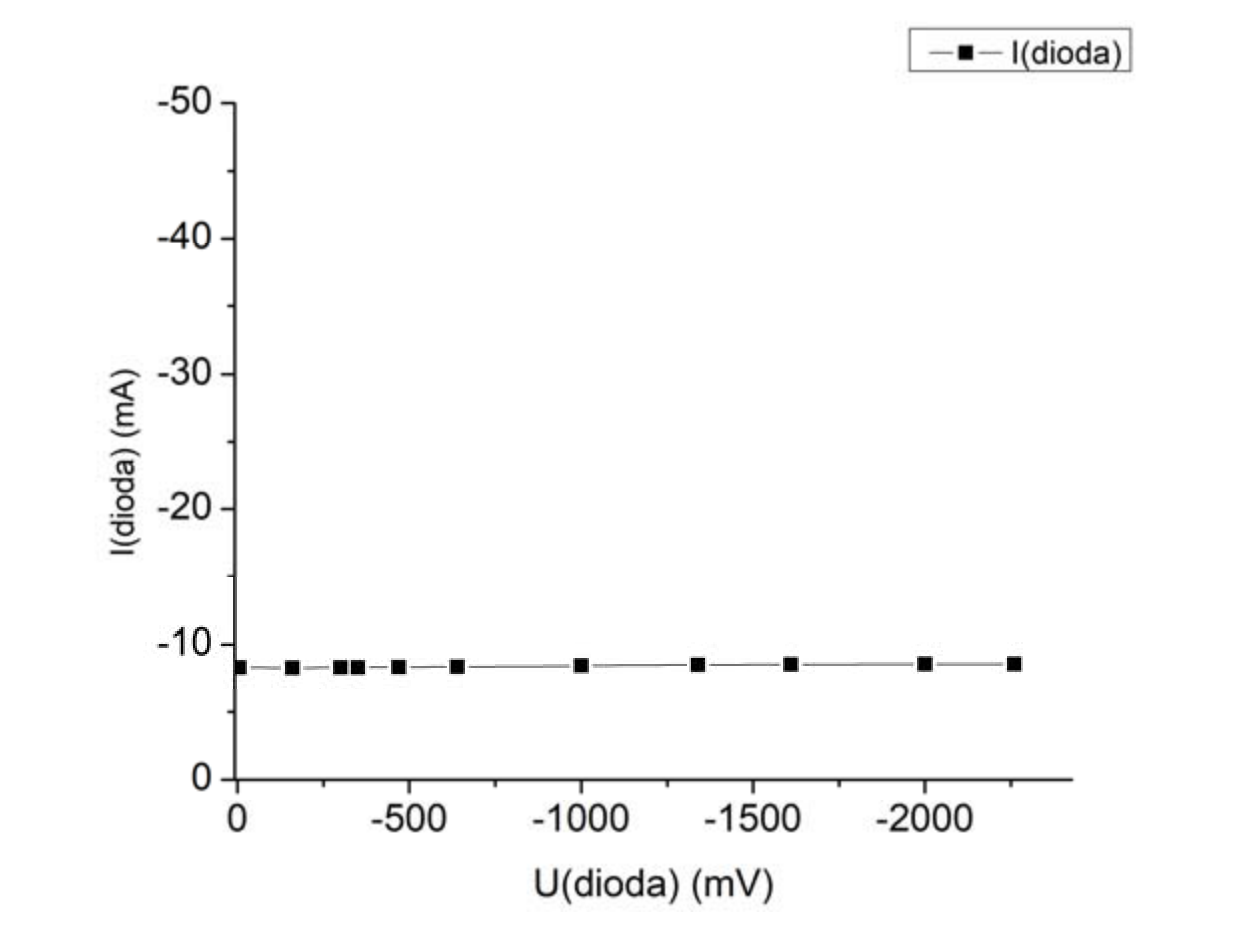
4.1.4 Măsurarea caracteristicii în cadranul trei
4.1.4.a. Cu laserul pornit și cu fotodioda iluminată, măsoară perechi de valori pentru tensiuni de polarizare . Completează Table 3 cu perechile de date curent – tensiune, măsurate în cadrul acestei sarcini de lucru. (2,00p)
Table 3
| Nr | |||
|---|---|---|---|
| 1 | -5 | -832 | -8.32 |
| 2 | -160 | -830 | -8.30 |
| 3 | -300 | -833 | -8.33 |
| 4 | -350 | -833 | -8.33 |
| 5 | -470 | -836 | -8.36 |
| 6 | -640 | -837 | -8.37 |
| 7 | -1000 | -845 | -8.45 |
| 8 | -1340 | -853 | -8.53 |
| 9 | -1610 | -854 | -8.54 |
| 10 | -2000 | -856 | -8.56 |
| 11 | -2260 | -857 | -8.57 |
Observații:
1. Se acordă tot punctajul dacă în Table 3 sunt înregistrate cel puțin 10 seturi de date experimentale.
2. Se acordă jumătate din punctaj dacă în Table 3 sunt înregistrate 5 - 9 seturi de date experimentale.
3. Nu se acordă punctaj, dacă în Table 3 sunt înregistrate mai cel puțin 5 seturi de date experimentale.
4.1.4.b. Trasează graficul caracteristicii din cadranul trei pentru fotodioda iluminată și polarizată - Graph 3 (1,00p)
4.2 Etalonarea sistemului electric pentru măsurări asupra intensității luminii
4.2.1 Măsurarea semnalului electric al fotodiodei
4.2.1.a. Rotește analizorul din în în tot domeniul de valori posibile (). Pentru fiecare poziție a analizorului, notează în Table 4 indicația a voltmetrului cuplat pe rezistența , corespunzătoare valorii intensității curentului invers al fotodiodei. (1,00p)
Table 4
| Nr | Unghi | |||
|---|---|---|---|---|
| 1 | 90 | 0.09 | 6.34136E-7 | 9E-4 |
| 2 | 95 | 1.9 | 0.00745 | 0.019 |
| 3 | 100 | 4.8 | 0.02985 | 0.048 |
| 4 | 105 | 8.4 | 0.06652 | 0.084 |
| 5 | 110 | 12.4 | 0.11635 | 0.124 |
| 6 | 115 | 17.6 | 0.17783 | 0.176 |
| 7 | 120 | 22.9 | 0.24908 | 0.229 |
| 8 | 125 | 28.4 | 0.32795 | 0.284 |
| 9 | 130 | 36.8 | 0.41204 | 0.368 |
| 10 | 135 | 43.4 | 0.49881 | 0.434 |
| 11 | 140 | 50.6 | 0.5856 | 0.506 |
| 12 | 145 | 58.8 | 0.6698 | 0.588 |
| 13 | 150 | 65.9 | 0.74885 | 0.659 |
| 14 | 155 | 70.7 | 0.82034 | 0.707 |
| 15 | 160 | 78.6 | 0.88211 | 0.786 |
| 16 | 165 | 83.7 | 0.93228 | 0.837 |
| 17 | 170 | 87.8 | 0.96933 | 0.878 |
| 18 | 175 | 90.3 | 0.99213 | 0.903 |
| 19 | 180 | 92.1 | 1 | 0.921 |
Observații:
1. Se acordă tot punctajul dacă în Table 4 sunt înregistrate cel puțin 10 seturi de date experimentale.
2. Se acordă jumătate din punctaj dacă în Table 4 sunt înregistrate 5 - 9 seturi de date experimentale.
3. Nu se acordă punctaj, dacă în Table 4 sunt înregistrate mai cel puțin 5 seturi de date experimentale.
4.2.2 Etalonarea sistemului electric pentru măsurări ale intensității luminii
4.2.2.a. Identifică poziția corectă a filtrelor încrucișate. Corectează - dacă este cazul - în mod corespunzător valorile unghiului dintre direcțiile de transmisie ale polarizorului și analizorului. Completează valorile acestui unghi în Table 4, folosit în cadrul sarcinii de lucru 4.2.1.a. De asemenea, completează în același tabel și valorile , pentru toate valorile unghiurilor măsurate și corectate. (0,50p)
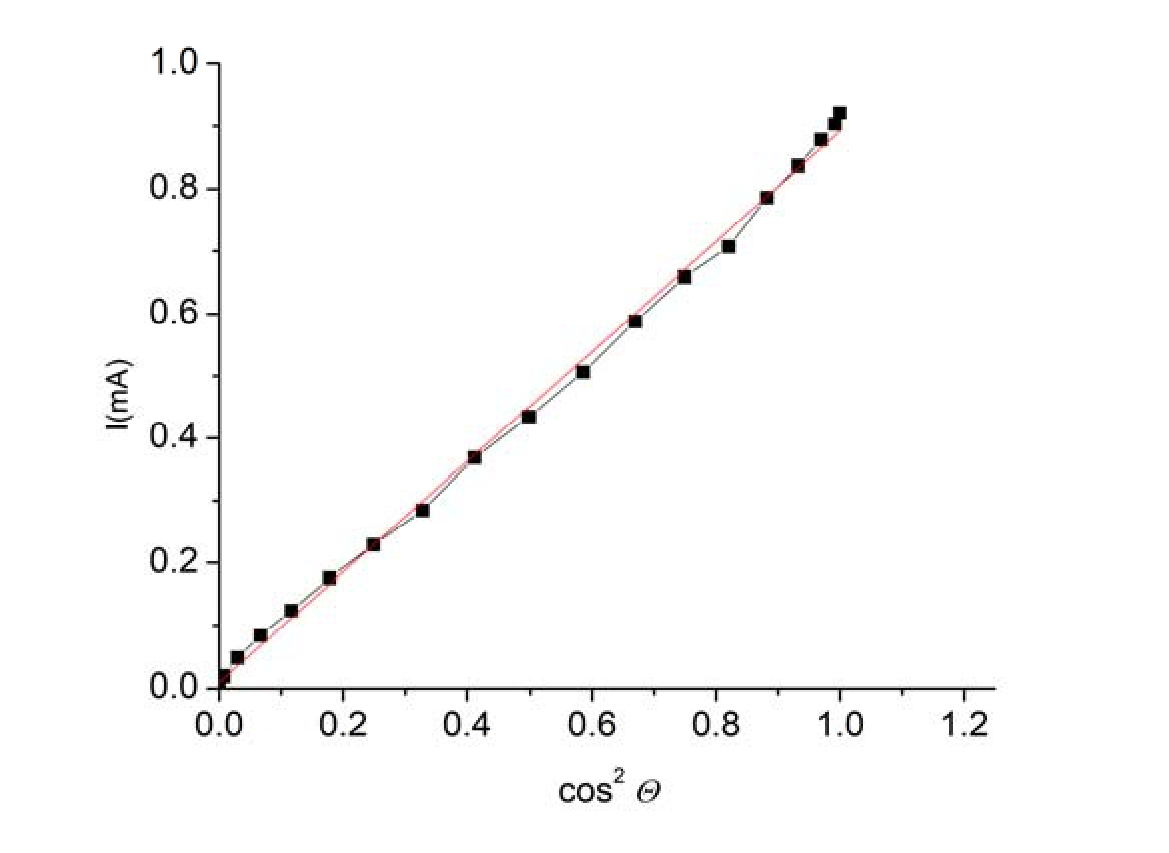
4.2.2.b. Trasează graficul dependenței - Graph 4 (1,00p)
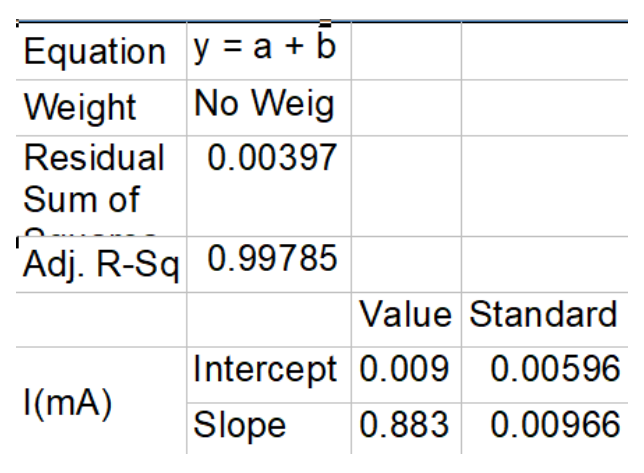
4.2.2.c. Determină valorile parametrilor și și precizează semnificația lor fizică. (1,00p)
Caracteristicile dreptei de fit pentru dependența sunt
Prin urmare,
și
Deoarece intercepția dreptei de fit este practic nulă, se observă respectarea remarcabil de bună a legii Malus.
Panta graficului reprezintă coeficientul de proporționalitate dintre intensitatea curentului electric invers al diodei și intensitatea luminii.
Notă: În aprecierea rezultatelor concurenților este importantă liniaritatea dependenței ; valorile absolute ale intensității curentului electric pot fi diferite.
4.3 Măsurări polarimetrice
4.3.a. Având cuva goală, rotește analizorul până la realizarea situației de filtre încrucișate și notează unghiul indicat de acul indicator, la care s-a realizat această situație.
Pentru fiecare dintre lungimile ale coloanei de lichid, notează valoarea unghiului indicat și determină valoarea unghiului de rotire a planului de polarizare, la care se realizează minimul semnalului electric – ceea ce corespunde situației polarizor-analizor încrucișați. Notează în Table 5 valorile lungimilor ale coloanei de lichid, ale unghiurilor indicate de acul indicator și ale unghiurilor corespunzătoare. (1,00p)
Table 5
| Nr | Unghi indicat de acul indicator pe raportor | Lungime (cm) | Unghi |
|---|---|---|---|
| 1 | 90 | 0 | 0 |
| 2 | 86 | 2 | 4 |
| 3 | 78 | 4.2 | 12 |
| 4 | 74 | 6 | 16 |
| 5 | 58 | 14.7 | 32 |
| 6 | 54 | 18 | 36 |
| 7 | 45 | 22 | 45 |
Observații:
1. Se acordă tot punctajul dacă în Table 5 sunt înregistrate cel puțin 6 seturi de date experimentale.
2. Se acordă jumătate din punctaj dacă în Table 5 sunt înregistrate 4 - 5 seturi de date experimentale.
3. Nu se acordă punctaj, dacă în Table 1 sunt înregistrate mai cel puțin 4 seturi de date experimentale.
4.3.b. Trasează graficul dependenței - Graph 5, (1,00p)
Observații: 1. Dependența este liniară și trece prin origine – ceea ce confirmă teoria referitoare la tipul dependenței dintre lungimea drumului luminii prin mediul activ optic și rotirea direcției de polarizare a luminii.
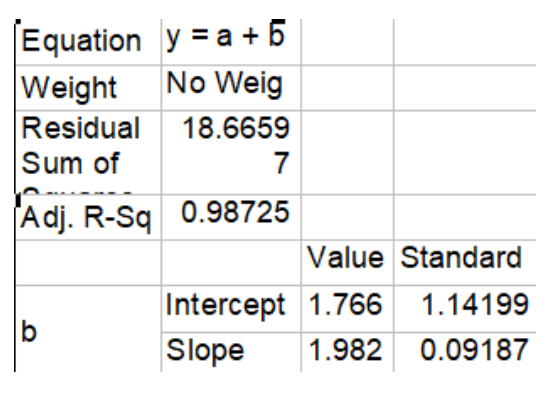
2. Caracteristicile dreptei de fit a punctelor experimentale ale dependenței
3. Coeficientul de corelație al dependenței este remarcabil de aproape de 1.
4.3.c. Măsoară valorile unghiului pentru coloane de lungimi egale din soluțiile cu concentrațiile , , . Tabelează rezultatele în Table 6. (1,00p)
Table 6
| Nr | Unghi indicat de acul indicator pe raportor | Concentrație | Unghi |
|---|---|---|---|
| 1 | 54 | 50 | 36 |
| 2 | 73 | 25 | 17 |
| 3 | 83 | 12.5 | 7 |
4.3.d. Trasează graficul și denumește-l Graph 6. (1,00p)
4.3.e. Măsoară valoarea unghiului pentru o coloană de lungime din soluția de concentrație necunoscută și notează valoarea obținută. Folosind reprezentarea grafică pe care ai trasat-o în cadrul sarcinii de lucru 4.3.d., determină valoarea concentrației necunoscute și notează valoarea obținută în caseta caseta de mai jos. (1,00p)
Se măsoară valoarea unghiului pentru o coloană de lungime din soluția de concentrație necunoscută și se obține:
Folosind reprezentarea grafică trasată în cadrul sarcinii de lucru 4.3.d.(Graph 6) se determină valoarea concentrației necunoscute
Оригинал в Архива: exp.pdf · официални решения: exp_sol.pdf