BAAO 2021, Теория — Задача 2. Great Conjunctions and the Star of Bethlehem
British Astronomy and Astrophysics Olympiad 2020-2021 — Astronomy & Astrophysics Competition Paper — Saturday 27th February 2021 · 27 февруари 2021 г. · 35 т.
Указания
Time: 3 hours ( minutes for Q1, minutes for Q2 and minutes for Q3).
Questions: All three questions should be attempted. Each question contains independent parts so that later parts can be attempted even if earlier parts are incomplete.
Solutions: Answers and calculations are to be written on loose paper ON ONE SIDE ONLY. Students should ensure their name and school is clearly written on the first answer sheet and that all pages are numbered. EACH QUESTION ANSWERED must be started on a new page. A standard formula booklet with standard physical constants may be used if desired.
Instructions: This paper will be invigilated over Zoom with all candidates starting at 9am, however please do not discuss any aspect of the paper on the internet until 9am Saturday 6 March.
Clarity: Solutions must be written legibly, in black pen (the papers are scanned), and working down the page. Scribble will not be marked and overall clarity is an important aspect of this exam.
Eligibility: The International Olympiad will be held during November 2021; all sixth form students are eligible to participate.
Calculators: Any standard calculator may be used, but calculators cannot be programmable and must not have symbolic algebra capability.
Training Dates and the IOAA (Bogota, Colombia, November 2021)
The team will be selected from Y12 students taking this paper as well as Y12 students taking the Senior Physics Challenge paper in March. The best students that are eligible to represent the UK at the IOAA will be invited to attend the Training Camp to be held online from (Tuesday 6 April to Saturday 10 April 2021). Astronomy material will be covered; problem solving skills and observational skills (telescope and naked eye observations) will be developed. At the Training Camp a Data Analysis exam along with a Round 3 theory paper will be sat. A team of five students (plus one reserve) will be selected for further training, mostly done remotely with (hopefully) additional training camps in the summer.
Important Constants
| Constant | Symbol | Value |
|---|---|---|
| Speed of light | ||
| Earth’s rotation period | 1 day | 24 hours |
| Earth’s orbital period | 1 year | 365.25 days |
| parsec | pc | |
| Astronomical Unit | au | |
| Radius of the Sun | ||
| Radius of the Earth | ||
| Mass of the Sun | ||
| Mass of the Earth | ||
| Luminosity of the Sun | ||
| Stephan-Boltzmann constant | ||
| Gravitational constant | ||
| Boltzmann constant | ||
| Permittivity of free space | ||
| Permeability of free space | ||
| Planck’s constant | ||
| Elementary charge | ||
| Proton rest mass | ||
| Electron rest mass | ||
| Wien’s displacement law | ||
| Avagadro’s constant |
Basic calculus formulae:
Chain rule
Product rule
Quotient rule
Integration by parts
Standard integral
Important Formulae
You might find the diagram of an elliptical orbit below useful in solving some of the questions:
Elements of an elliptic orbit:
| semi-major axis | |
| semi-minor axis | |
| eccentricity | |
| focus | |
| periapsis distance (shortest distance from ) | |
| apoapsis distance (longest distance from ) |
Kepler’s Third Law: For an elliptical orbit, the square of the period, , of an object about the focus is proportional to the cube of the semi-major axis, (as defined above), such that
where is the total mass of the system (typically dominated by the central object) and is the universal gravitational constant.
Vis-Viva Equation: For an elliptical orbit, the speed of an object at a distance from the focus is related to the semi-major axis, , total mass of the system, , and universal gravitational constant, , (as defined above), such that
Magnitudes: The apparent magnitudes of two objects, and , are related to their apparent brightnesses, and , via the formula
The absolute magnitude of an object, , is the same as its apparent magnitude when viewed from 10 pc, hence the relationship between apparent and absolute magnitude and distance is
where is measured in parsecs.
BAAO 2020/21 Solutions and Marking Guidelines
Note for markers:
- Answers to two or three significant figures are generally acceptable. The solution may give more in order to make the calculation clear. Units should be present on final answers when appropriate.
- There are multiple ways to solve some of the questions; please accept all good solutions that arrive at the correct answer. Students getting the answer in a will get all the marks available for that calculation / part of the question (as indicated in red), so long as there are no unphysical / nonsensical steps or assumptions made (students may not explicitly calculate the intermediate stages and should not be penalised for this so long as their argument is clear).
Условие
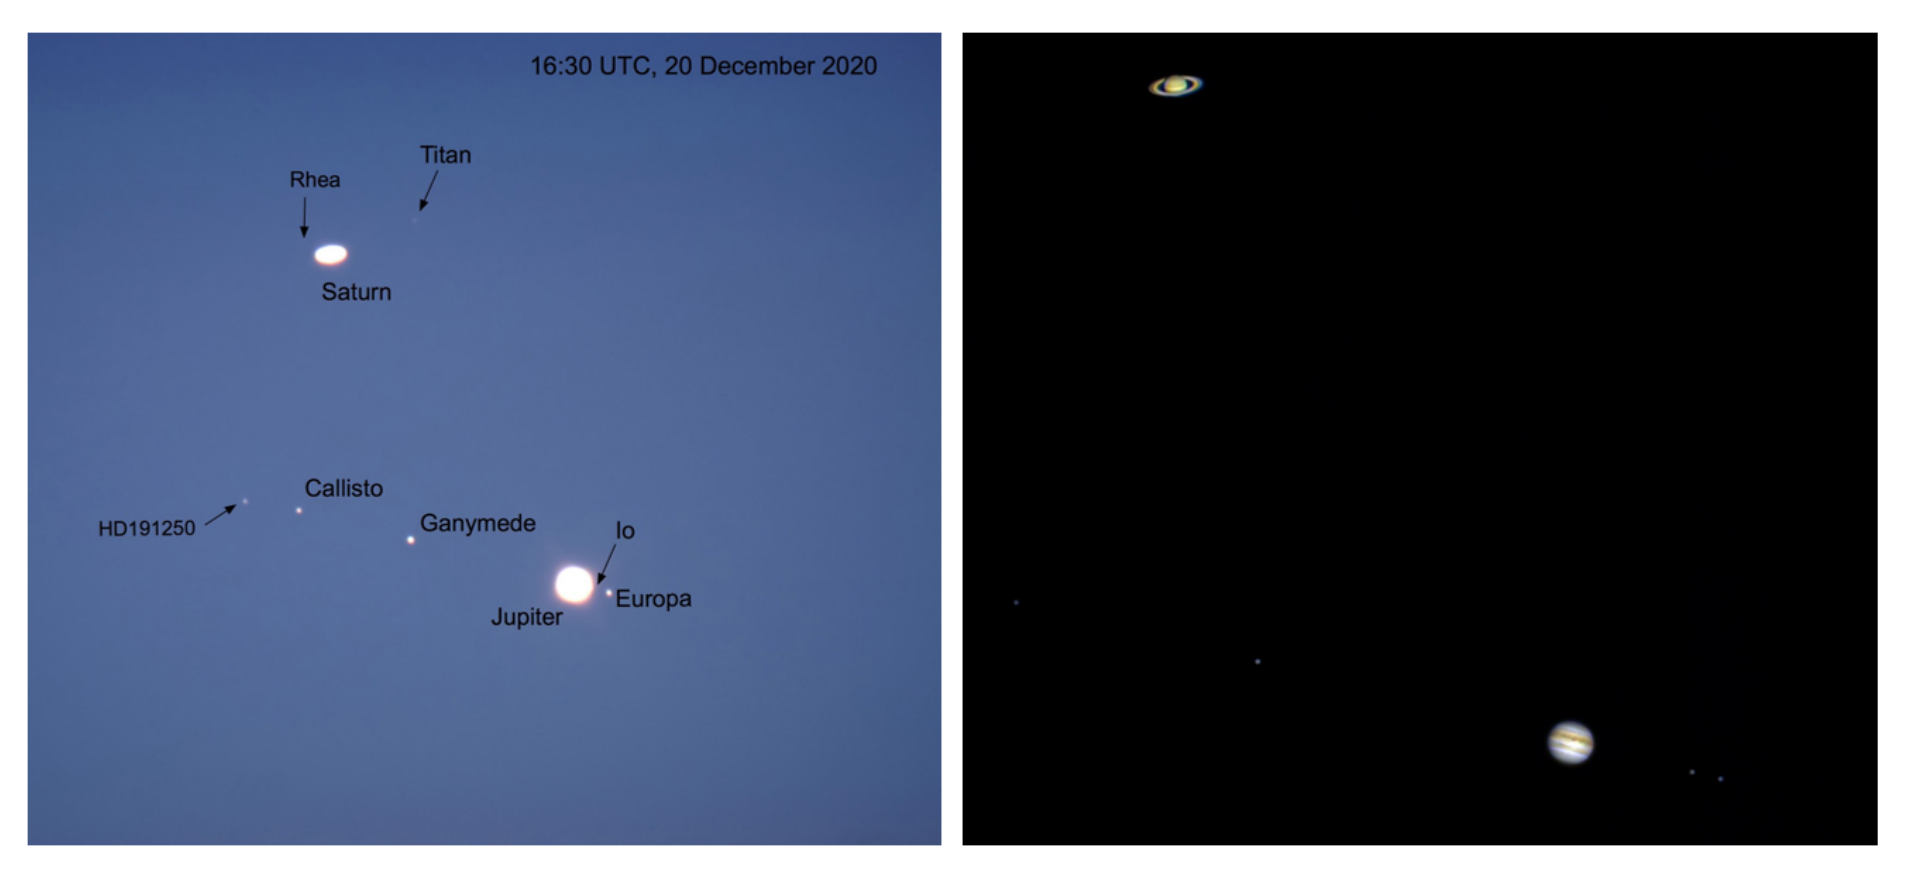
On 21 December 2020, Jupiter and Saturn formed a true spectacle in the southwestern sky just after sunset in the UK, separated by only . This is close enough that when viewed through a telescope both planets and their moons could be seen in the same field of view (see Fig 4).
When two planets occupy the same piece of sky it is known as a conjunction, and when it is Jupiter and Saturn it is known as a great conjunction (so named because they are the rarest of the naked-eye planet conjunctions). The reason it happens is because Jupiter’s orbital velocity is higher than Saturn’s and so as time goes on Jupiter catches up with and overtakes Saturn (at least as viewed from Earth), with the moment of overtaking corresponding to the conjunction. The process of the two getting closer and closer together has been seen in sky throughout the year (see Fig 5).
a. (i) In ideal observing conditions the two planets are far enough apart that they should be (just about) distinguishable to the naked eye, however to some observers in imperfect conditions they would appear as a single bright dot, brighter than either planet on its own.
During the conjunction, the apparent magnitudes of Jupiter and Saturn were and , respectively (ignoring dimming by the atmosphere). What would be the apparent magnitude of the two planets if they appeared to an observer as a single point? [Hint: it is not simply .] [3 т.]
a. (ii) Although they appeared close in angle, there was a very considerable distance between the two planets. At conjunction, Jupiter was au from Earth whilst Saturn was au (see Fig 5). If they were actually next to each other in space such that they could be treated as a single object, how far from the Earth (in au) would they need to be to have the same apparent magnitude as calculated in the previous part? For simplicity, assume that both planets can be modelled as (very low luminosity) stars so that the change in brightness is only due to changing the distance from the Earth (i.e. ignore the complications from the changing distance from the Sun affecting the number of reflected photons and the changing geometry affecting the illuminated fraction of the planet’s surface). [3 т.]
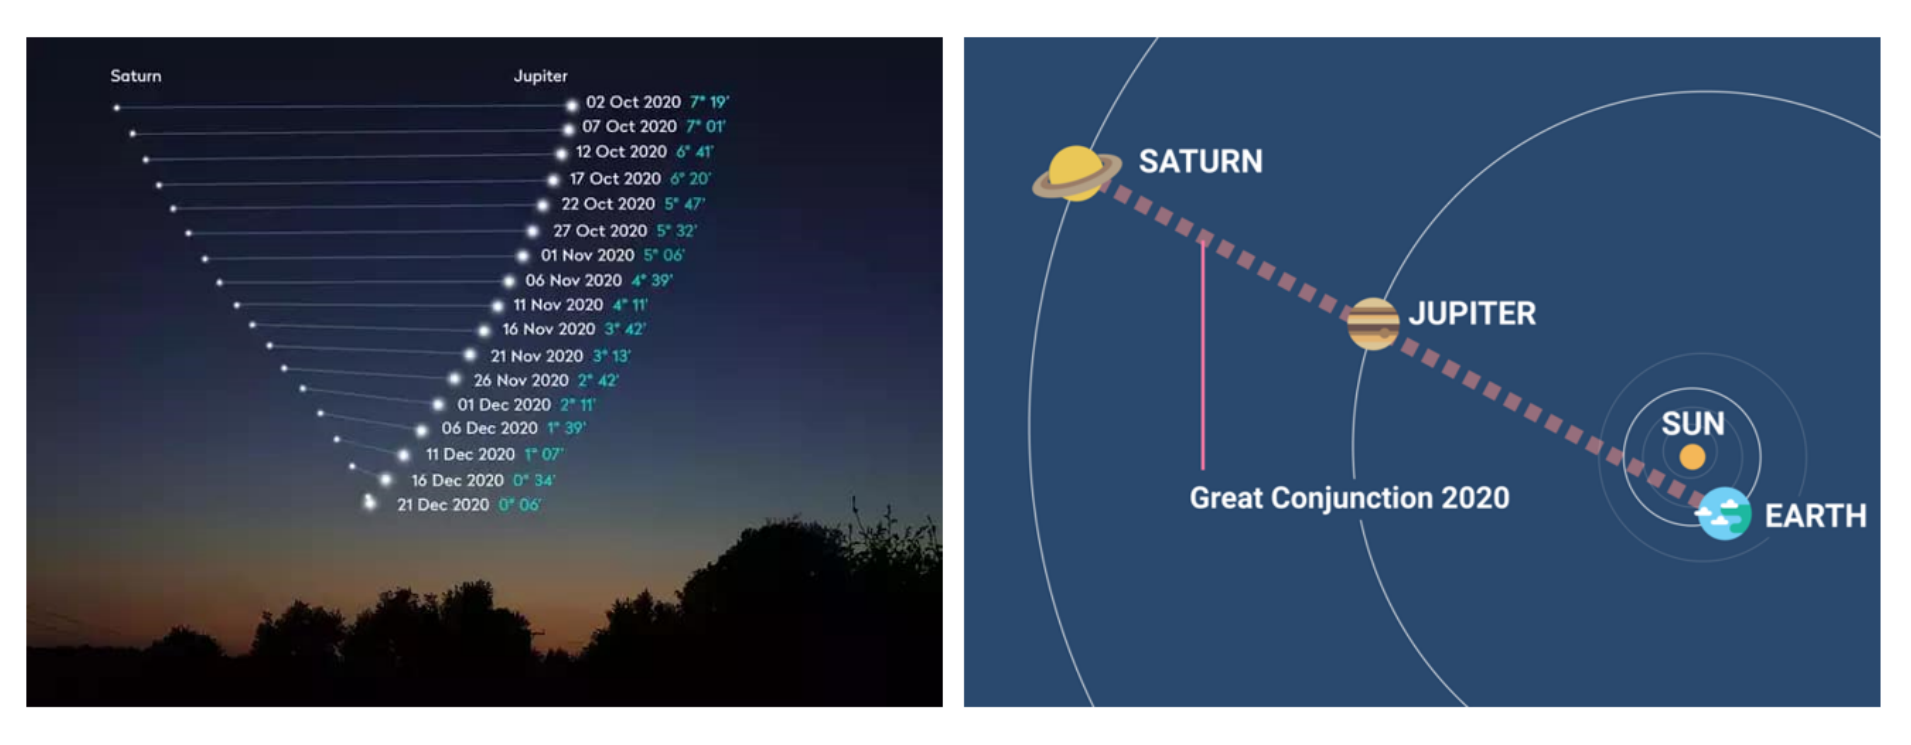
The time between conjunctions is known as the synodic period. Although this period will change slightly from conjunction to conjunction due to different lines of perspective as viewed from Earth (see Fig 5), we can work out the average time between great conjunctions by considering both planets travelling on circular coplanar orbits and ignoring the position of the Earth.
b. (i) Jupiter has a period of days and Saturn has a period of days (where day hours). Note: be careful as your calculations will be very sensitive to rounding errors.
Calculate the time between great conjunctions as viewed from the centre of the Solar System (this will be equal to the average synodic period). Give your answer in years (where year days). [Hint: consider a reference frame rotating at the same rate as Jupiter.] [2 т.]
b. (ii) Use your answer to predict the date (to the nearest day) of the next great conjunction. [3 т.]
b. (iii) Some astronomers have suggested that the ‘Star of Bethlehem’ seen by the magi (‘wise men’) on their way to Jesus’ birth was in fact a great conjunction. Use your average synodic period to find the date of the great conjunction in the first decade BC and give your answer to the nearest month. [Note: be careful with BC years as year 0 in your calculation is equivalent to 1 BC, since 31 December 1 BC is followed by 1 January 1 AD] [5 т.]
For circular coplanar orbits the centre of Jupiter’s disc would pass in front of the centre of Saturn’s disc every conjunction, and hence have an angular separation of (it is measured from the centre of each disc). In practice, the planets follow elliptical orbits that are in planes inclined at different angles to each other.
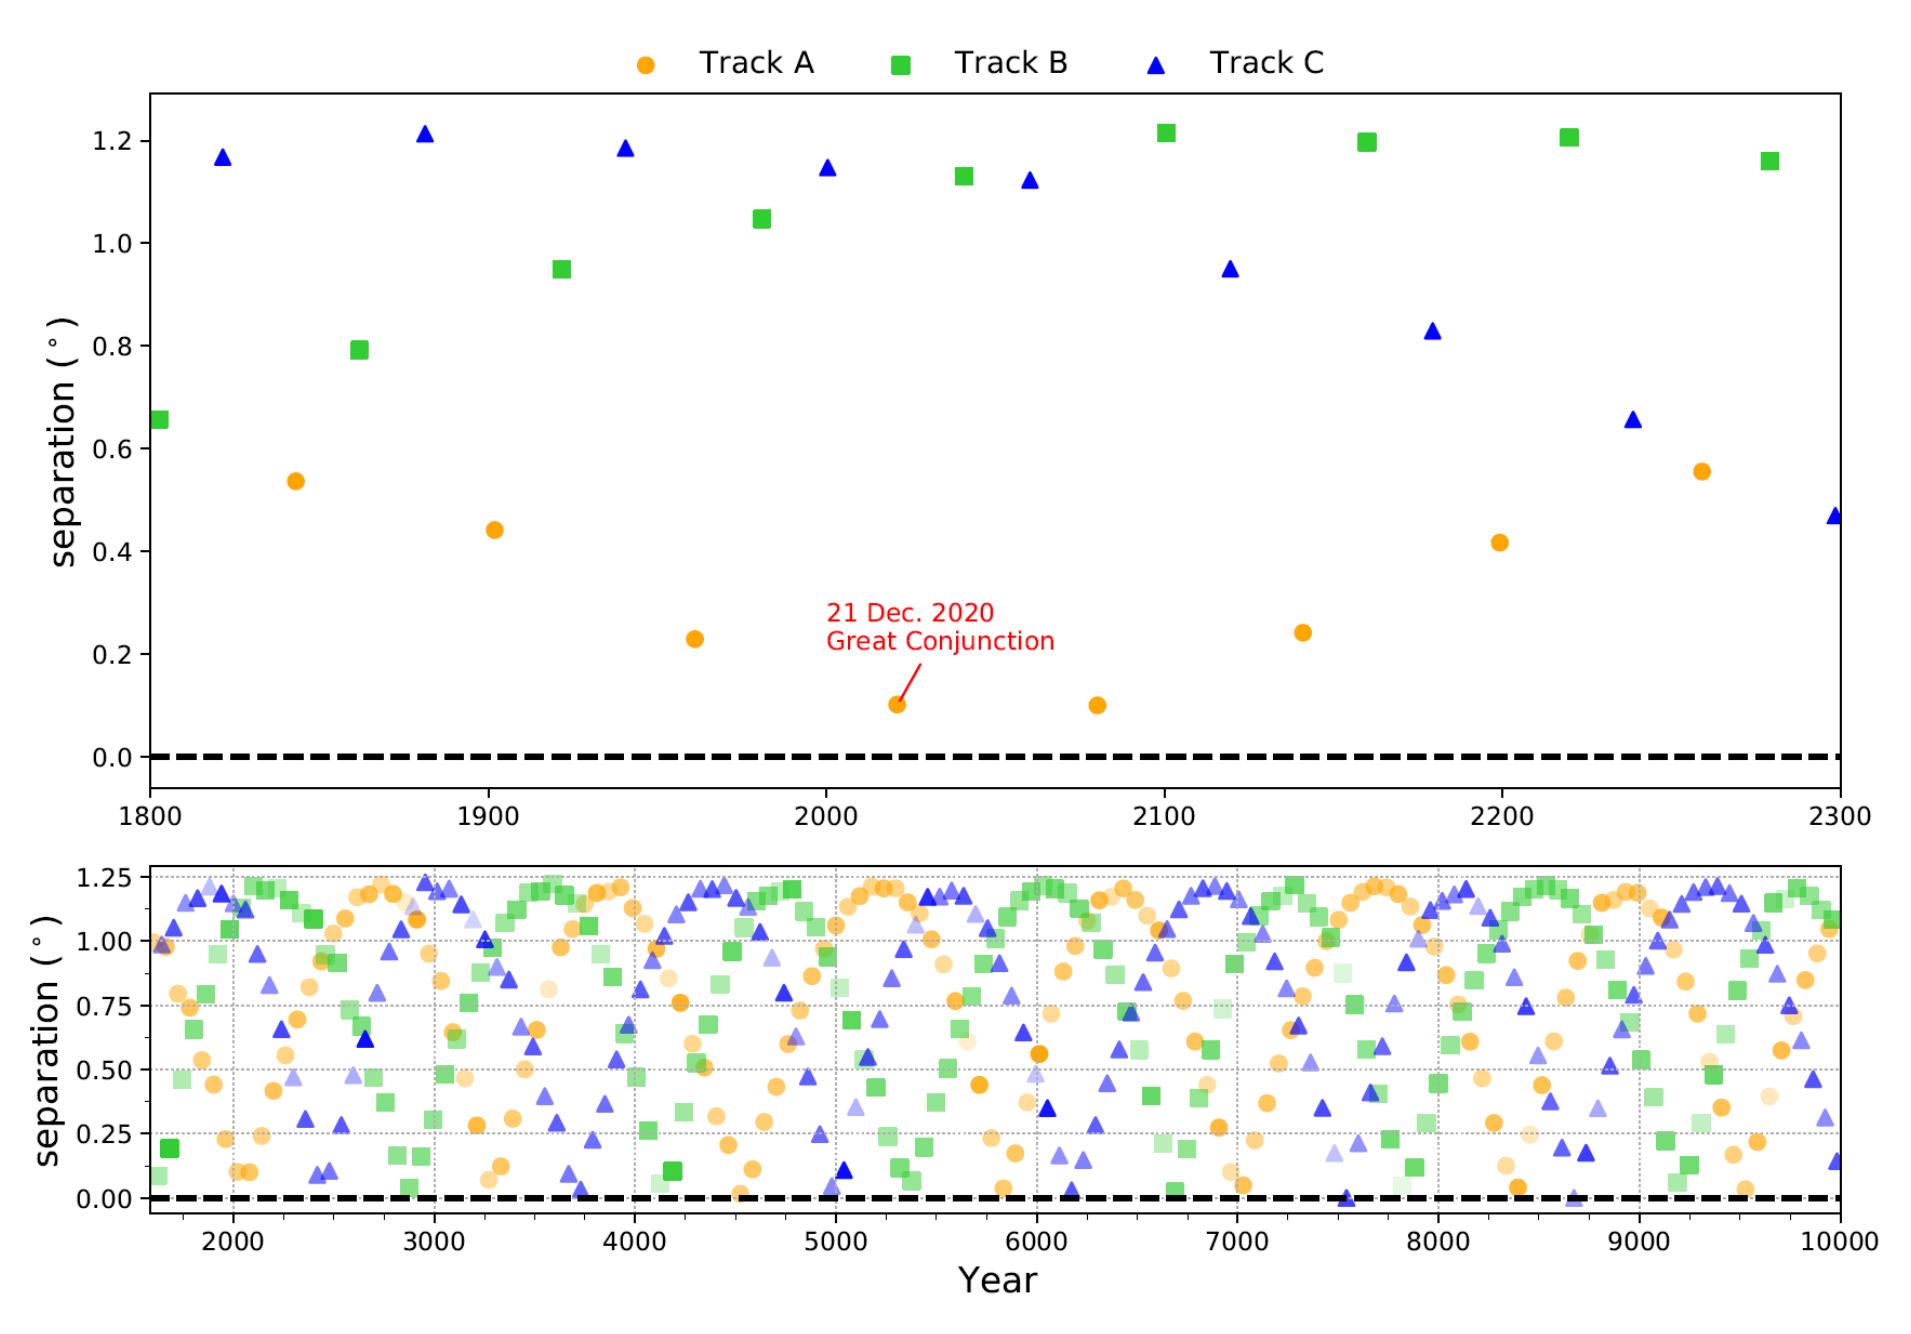
Fig 6 shows how this affects the real values for over 8000 years’ worth of data, which along with different synodic periods between conjunctions makes it a difficult problem to solve precisely without a computer. However, after one synodic period Saturn has moved about of the way around its orbit, and so roughly every synodic periods it is in a similar part of the sky. Consequently every third great conjunction follows a reasonably regular pattern which can be fit with a sinusoidal function.
c. (i) By empirically fitting a sinusoidal function (which is assumed to be the same for each track, just with a fixed phase difference between them) and assuming all conjunctions are separated by the average synodic period, we can give rough estimations for the separations of any given great conjunction. Note: be careful as your calculations will be very sensitive to rounding errors.
By reading off the graph, give an equation for Track A of the form , where is the (decimalised) date in years, and , , and are values that need to be determined. [Hint: ensure your function passes through the 2020 data point, and the function is decreasing as it does.] [4 т.]
c. (ii) Without having to read anything else off the graph, write down the equations for Tracks B and C, given the same restrictions on and . [3 т.]
c. (iii) State which track the ‘Star of Bethlehem’ great conjunction is on, and hence use the relevant equation to predict its separation. How does it compare to the 2020 great conjunction? [3 т.]
c. (iv) When is the next great conjunction at least as close as the 2020 one (i.e. )? Give its year and the value of . [2 т.]
c. (v) Similarly, when was the last great conjunction at least as close as the 2020 one? Give its year and the value of . [4 т.]
c. (vi) Using your equations, calculate the probability that a great conjunction has . [3 т.]
Отговори
a. (i) -2.06 mag
a. (ii) 6.48 au
b. (i) 19.86 years
b. (ii) 30 October 2040
Allow ±1 day (official marking scheme).
b. (iii) May 6 BC
Allow ±1 month (official marking scheme).
c. (i)
D = 1.20° (allow 1.10°–1.30°), λ = 2500 years (allow ±300 years), φA = 1.12 rad (official marking scheme).
c. (ii)
c. (iii) Track A; θ ≈ 1.07°, much further apart than the 2020 great conjunction
c. (iv) 2080; θ ≈ 0.078°
c. (v) 1623; θ ≈ 0.043°
c. (vi) 5.42 %
Values 5.00%–5.91% accepted within the allowed range of D (official marking scheme).
Решение
Q2 – Great Conjunctions and the Star of Bethlehem [35 marks]
a. i. Given that brightness adds linearly, given the brightness of Jupiter (b) and of Saturn (b), the joint brightness of Jupiter and Saturn b is
Using the formula connecting magnitudes and brightness given at the start of the paper,
[Coincidentally, ; this approach receives 0 marks]
ii. To balance the magnitudes for being at the same distance, we can use absolute magnitudes given the formula at the beginning of the paper (with distances converted into pc)
Similarly, [need both absolute magnitudes for the mark] [1]
Using a similar approach to the previous part of the question to get the combined absolute magnitude,
[Must be in au for final mark. Make some allowance for high sensitivity to rounding errors]
[Even at a standardised distance, Jupiter is still considerably brighter. If we had kept it as reflected photons and thus had to take into account the change in incident radiation, we would get au, showing that our simplifying approximation is reasonable]
b. i. Moving into a frame of reference where Jupiter is stationary,
[Must be in years for the final mark. First mark is for any sensible approach in terms of ω]
ii. Rewriting into something more convenient
∴ next conjunction 52 days before 21 Dec [1]
52 days = 21 in Dec + 30 in Nov + 1 in Oct ∴ [2] [3]
[One mark for the year (2040), one for the date. Allow day. Alternatively, some students may look for the 304 day in 2040]
[The real date is 31 Oct 2040 so this model has done remarkably well – due to the dependence on the Earth’s position in its orbit the gap between conjunctions can vary up to days above or below the average value]
iii. In 2020 years there have been cycles
∴ need 102 cycles before 2020 conjunction [1]
Start date = 10 days before the end of the year [1]
[Give this mark if they have already calculated a decimalised start date in b) ii) instead. The top of the fraction must be 356 as 2020 is a leap year – lose this mark for other values]
∴ end date [1]
0.63 years = 7.57 months before 31 Dec ∴ May [1]
Since a number between 0 and 1 corresponds to 1 BC, between -1 and 0 corresponds to 2BC, and so on, ∴ a number between -5 and -4 corresponds to 6 BC ∴ [1] [5]
[One mark for the year (6BC), one for the month. Allow month]
[From our data a more precise prediction is 230.4 days before 31 Dec and so 14 May 6 BC. The real great conjunction in that decade occurred on 3 June 6 BC, so is rather close to our predicted date. This is before the death of King Herod in 4 BC, as required to fit in with the story, but it would have been seen in the constellation of Pisces in the NNE, so is unlikely to have been a ‘star in the East’]
c. i. Reading off the graph the amplitude (D) and the period (λ) of the sine wave:
[allow ] [1] [1]
years [allow years] [1] [1]
[Throughout the rest of this question, propagate the student’s values accordingly]
[Note: in reality D is set by the difference in the inclinations of Jupiter and Saturn’s orbits]
For the required properties are:
Correct behaviour (i.e. function is decreasing as it passes through 2020) [1]
In the specified range (i.e. ) [1] [2]
Guidance on awarding the marks for :
— Not in right range, or right behaviour so 0 marks
— Not in right range, or right behaviour so 0 marks
— In right range, but not right behaviour so 1 mark
— Not in right range, but right behaviour so 1 mark
— In right range and right behaviour so 2 marks
[So final formula is , but do not penalise students for not writing this so long as their values of D, λ and are clear]
ii. D and λ remain the same [this can be implied by calculations in later parts] [1] [1]
The phase difference is , the only extra consideration being staying in the required range
[1] [1]
[1] [1]
[If they go outside the required range e.g. then lose that mark, unless they have already been penalised in part i. for being outside the range (in which case allow full ecf) . As in the previous part, do not penalise students for not writing the equations in the form so long as their values of D, λ and are clear]
iii. Want 102 cycles before 2020 great conjunction, and 102 is divisible by 3
∴ Track A [1] [1]
This is much further apart than the 2020 great conjunction [1] [1]
[Note: other tracks coincidentally give similar values of θ; award 0 marks if wrong track used]
[Since this separation is over 10 times larger than the 2020 great conjunction (the real separation was almost the same as in this model), this adds evidence to suggest it would not have been as spectacular in the sky (and certainly not close enough to look like a single star), so that particular great conjunction is probably not an explanation for the Star of Bethlehem]
iv. Rather than using brute force to find it, the graph suggests a good one to try is the next point after 2020 on Track A
[1] [1]
(so good guess) [1] [1]
[Using intuition here saved us a lot of time. The real date is 15 March 2080, and the real separation will actually be almost identical to the 2020 great conjunction]
v. Again, to avoid brute force, the graph suggests we see whether there is anything suitable around Track B’s last x-intecept
These repeat every ½ λ so the last one was [1]
Looking at the number of track intervals you need to go back,
try 7 intervals back from 2040 [1]
[1] [3]
(good guess) [1] [1]
[Another example of intuition saving us lots of time. We have added the 19.86 to the 2020.975 to move from Track A to Track B. The real one was on 16 July 1623 (our model predicts 19 October) and had a separation of 0.086°. Some closer separations do happen, including transits (where the disc of Jupiter overlaps with the disc of Saturn), the next of which are due to happen in 7541 and 8674, and occultations (where Jupiter completely blocks out Saturn) in 7541, 13340 and 13738. (Note: 7541 sees part of a sequence called a triple conjunction, where retrograde motion means that Jupiter and Saturn meet three times in a short period. The transit is in February and the occultation is in June)]
vi. We need to know for how long in each cycle the curve has a value below 0.102° and compare that to the length of each cycle to get the overall probability
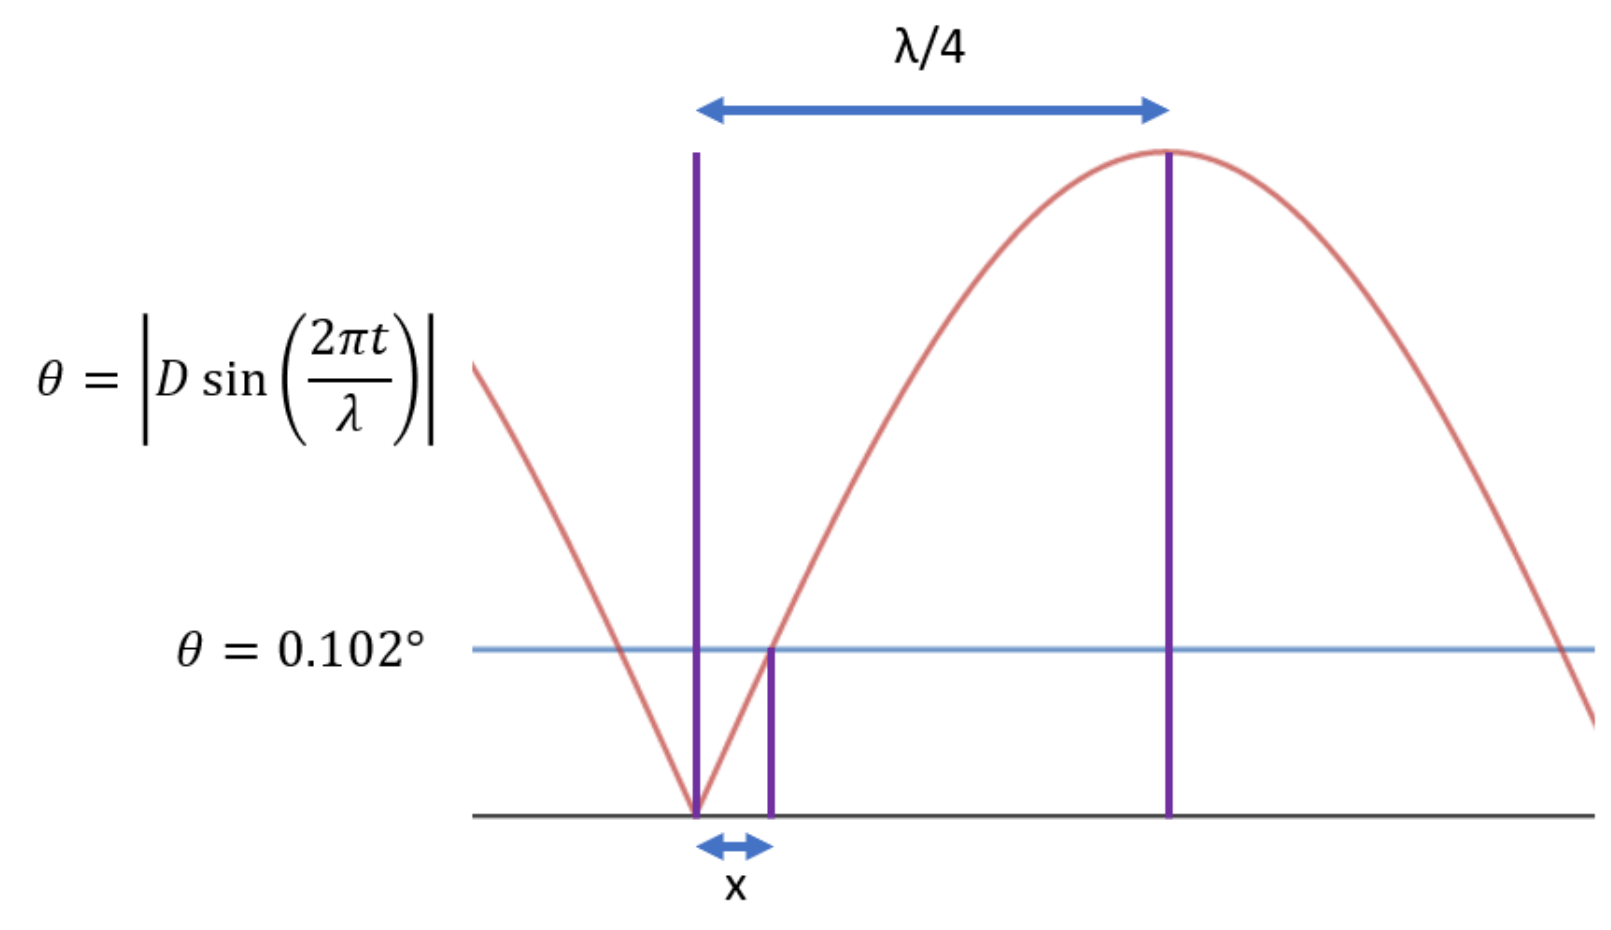
Using the notation of the diagram above,
We can ignore phase information as that will not affect the size of , just the co-ordinates of its start and end points, and hence we can simplify the expression for to find
[Accept it given as either a decimal or a percentage. Note that λ cancels in the expression for probability so it is only dependent on their value of D, giving prob ; this approach gains all the marks and gives values ranging from 5.00% to 5.91% in the allowed range of D. Allow any other sensible approaches that give results within this range]
[The real value (taken from the number of conjunctions satisfying this condition over 16000 years of conjunctions) is 5.34% (38 instances out of 711) showing how well this model does. The orbits of the planets change slightly over time due to their gravitational interactions, so extending this pattern arbitrarily far into the future or past is unlikely to give precise results]
END OF PAPER
END OF PAPER
Questions proposed by:
Dr Alex Calverley (Royal Grammar School, Guildford)
Niam Vaishnav (University of Oxford)
Nick Koukoufilippas (University of Oxford)
Оригинал в Архива: BAAO_2021.pdf · официални решения: BAAO_2021_solutions.pdf