GeCAA 2020, Анализ на данни — Задача 2. Minor Planet
GeCAA-2020 — Data Analysis · 50 т.
Условие
Table 1 contains the ecliptic longitude () and parallax () at different times () for a certain hypothetical minor planet. The baseline for the parallax is the diameter of the Earth. The time is expressed in years. For your reference, the ecliptic longitudes of the Sun () are also given in the table for the same dates. Let us assume that the orbital inclination of this minor planet with respect to the ecliptic is negligible and so is the eccentricity of the Earth’s orbit.
| [year] | [°] | [°] | [″] |
|---|---|---|---|
| 2012.3 | 336.73 | 40.95 | 3.82 |
| 2012.6 | 3.44 | 134.83 | 7.24 |
| 2012.9 | 50.71 | 242.08 | 7.09 |
| 2013.4 | 94.52 | 64.84 | 2.40 |
| 2013.6 | 121.40 | 134.59 | 2.16 |
| 2013.9 | 154.31 | 241.82 | 2.75 |
| 2014.2 | 25.33 | 353.29 | 3.16 |
| 2014.5 | 148.51 | 99.04 | 1.99 |
| 2014.8 | 176.26 | 205.45 | 1.83 |
| 2015.0 | 216.33 | 280.19 | 2.03 |
| 2015.3 | 187.5 | 28.55 | 2.897 |
(a) Calculate the coordinates of the minor planet in the heliocentric polar coordinate system and put them in a polar plot. The x-axis in the plot should be directed towards the initial position of the minor planet. Draw the major axis of the orbit of the minor planet.
Identify erroneous observation(s), if any. [38 т.]
(b) Assuming the heliocentric orbit of the minor planet to be elliptical, determine:
- Semi-major axis length in au
- Eccentricity
- Period in years [6 т.]
(c) Estimate the errors in the values of , , and . [6 т.]
Отговори
(a) The observation at t = 2014.2 (p = 3.16″) is an outlier and is excluded.
(b) ap ≈ 2.98 au, e ≈ 0.33, P ≈ 5.15 yr
(c) ap = (2.98 ± 0.04) au, P = (5.2 ± 0.1) yr, e = 0.33 ± 0.01
The official solution prints the unit of ap here as yr: „aP = (2.98 ± 0.04) yr“.
Решение
Table 1 gives ecliptic longitude () and parallax () at different times (), for a certain hypothetical minor planet. The baseline for the parallax is the diameter of the earth. The time is expressed in years and for your reference ecliptic longitudes of the Sun () for the same dates are also given the table. Let us assume that the orbital inclination of this minor planet, with respect to the ecliptic, is negligible and the eccentricity of the Earth’s orbit is negligible.
(a) (38 points) Calculate the coordinates of the minor planet in the heliocentric polar coordinate system and put them in a polar plot. The x-axis in the plot should be directed towards the initial position of the minor planet. Draw the major axis of the orbit of the minor planet.
Identify erroneous observation(s), if any.
(b) (6 points) Assuming the heliocentric orbit of the minor planet to be elliptical, determine
(i) the semimajor axis length .
(ii) eccentricity .
(iii) the period .
(c) (6 points) Estimate the errors in the values of , and .
Table 1: Minor planet data
| [year] | [°] | [°] | [″] |
|---|---|---|---|
| 2012.3 | 336.73 | 40.95 | 3.82 |
| 2012.6 | 3.44 | 134.83 | 7.24 |
| 2012.9 | 50.71 | 242.08 | 7.09 |
| 2013.4 | 94.52 | 64.84 | 2.40 |
| 2013.6 | 121.40 | 134.59 | 2.16 |
| 2013.9 | 154.31 | 241.82 | 2.75 |
| 2014.2 | 25.33 | 353.29 | 3.16 |
| 2014.5 | 148.51 | 99.04 | 1.99 |
| 2014.8 | 176.26 | 205.45 | 1.83 |
| 2015.0 | 216.33 | 280.19 | 2.03 |
| 2015.3 | 187.5 | 28.55 | 2.897 |
Solution
(a) We consider the , the vertices of which are Earth (E), Sun (S) and the minor planet (P).
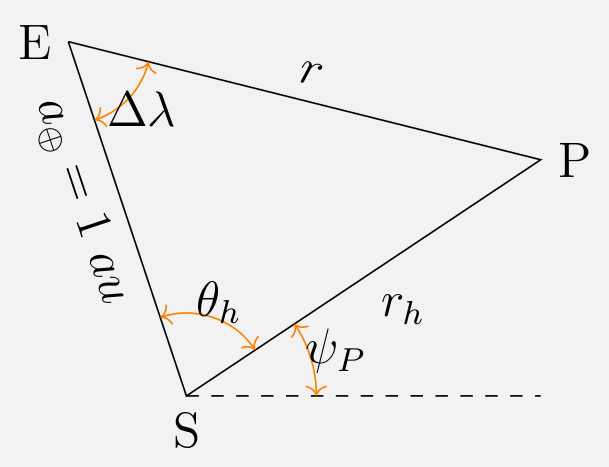
where . 2.0
1.0
By using the cosine rule and sine rule,
1.0
1.0
An angle is defined as angle swept by the vector from an arbitrary x axis (see figure). Let us fix the direction of the x-axis as the direction at the initial moment . In other words, . Using the same x-axis, let us define corresponding angle for the Earth, . Thus, we have
If we take any two consecutive measurements,
2.0
This is preferred over the conversion of time difference to angle as this data has better accuracy.
Using these formulae, one can find , , and for every measurement instance in the data. and can be used to plot locations of the minor planet.
Alternatively, one can also convert these to rectangular coordinates, i.e.
| t [year] | r [au] | [au] | [°] | [°] | [°] | x [au] | y [au] | |
|---|---|---|---|---|---|---|---|---|
| 2012.3 | 2.302 | 2.073 | -1.0000 | 270.00 | 270.00 | 0 | 2.073 | 0 |
| 2012.6 | 1.215 | 2.020 | -0.4510 | -26.81 | 3.88 | 30.69 | 1.737 | 1.031 |
| 2012.9 | 1.240 | 2.229 | 0.1097 | 6.30 | 111.13 | 104.83 | -0.571 | 2.155 |
| 2013.4 | 3.664 | 2.839 | 0.6391 | 140.27 | 293.89 | 153.62 | -2.543 | 1.262 |
| 2013.6 | 4.071 | 3.106 | -0.2991 | 197.40 | 3.64 | 166.24 | -3.017 | 0.739 |
| 2013.9 | 3.198 | 3.309 | -0.9655 | -74.92 | 110.87 | 185.79 | -3.292 | -0.334 |
| 2014.2 | 2.783 | 2.007 | 0.7357 | 132.63 | 222.34 | 89.71 | 0.010 | 2.007 |
| 2014.5 | 4.419 | 3.845 | 0.8735 | 119.13 | 328.09 | 208.96 | -3.364 | -1.862 |
| 2014.8 | 4.805 | 3.962 | -0.5914 | 216.26 | 74.50 | 218.24 | -3.112 | -2.453 |
| 2015.0 | 4.332 | 3.994 | -0.9738 | -76.85 | 149.24 | 226.09 | -2.770 | -2.877 |
| 2015.3 | 3.035 | 3.985 | 0.2736 | 15.88 | 257.6 | 241.72 | -1.888 | -3.509 |
there are 11 rows. Two points for each row. 22.0
Note. The parallax value for is obviously an outlier. Due to this, the corresponding position of the minor planet is also an outlier. Therefore, it should not be included in the plot or in the next analysis. 1.0
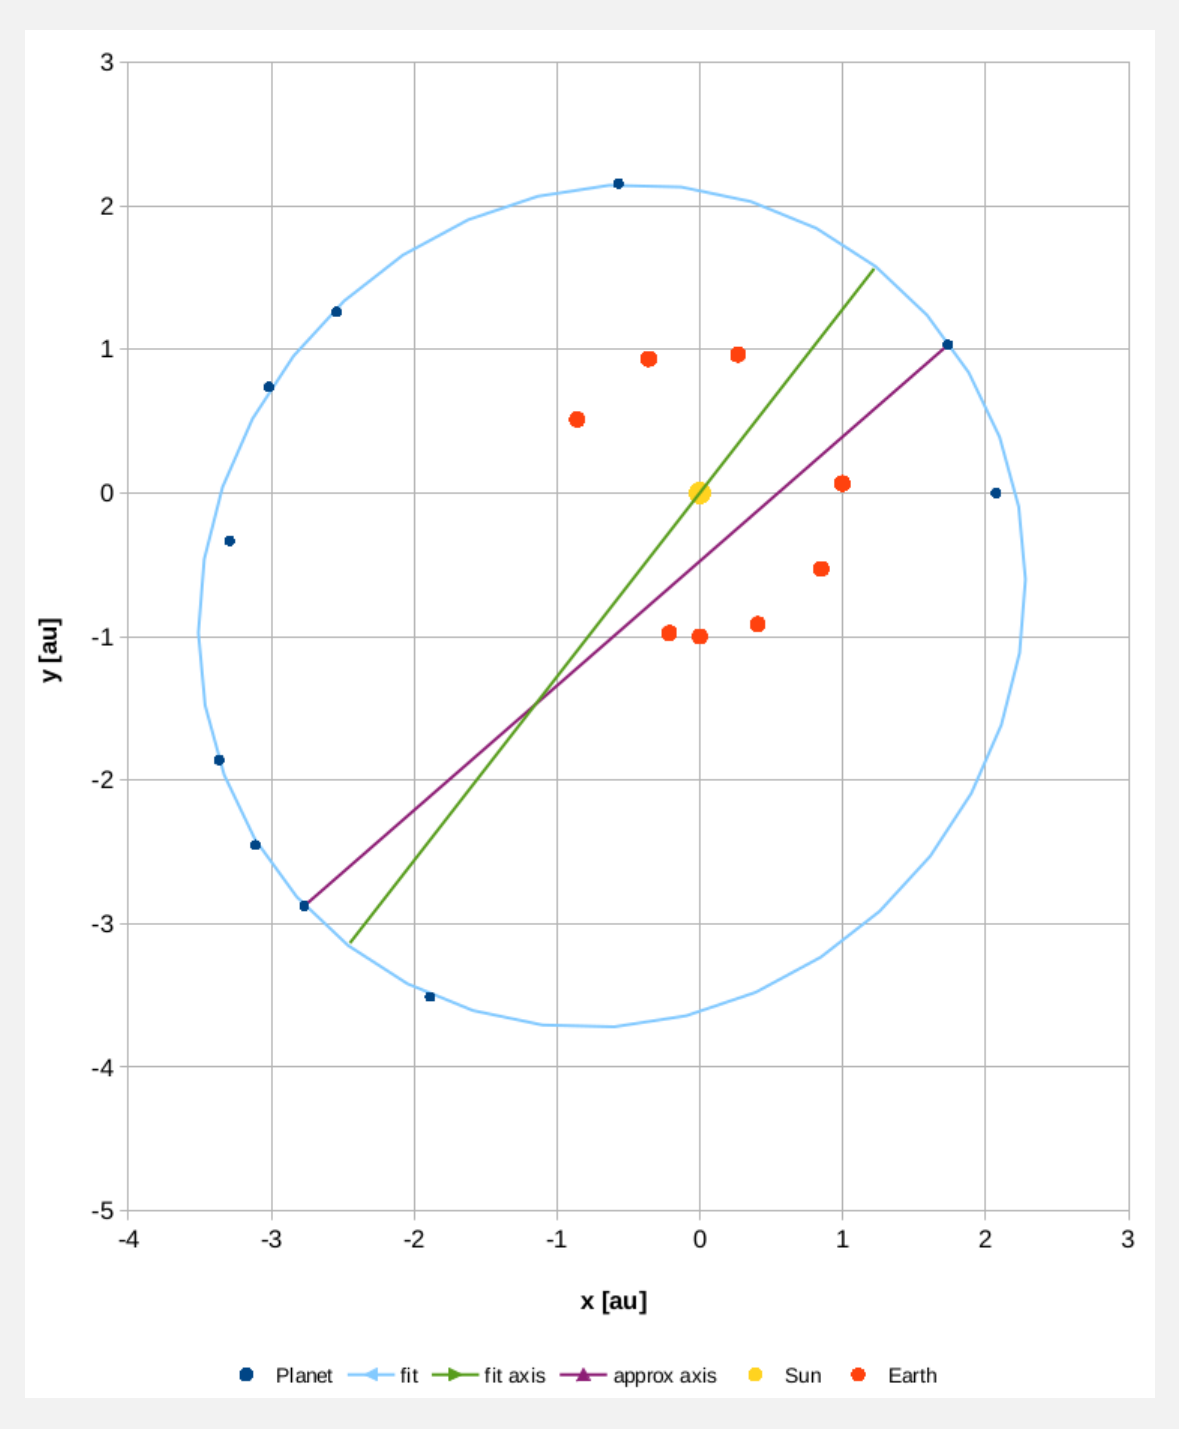
4.0
These 4 points are for merely drawing the approximate polar or rectangular plot. Points for the line of apsides are separate (see below). Marking the earth positions or drawing the visually fit ellipse (blue line) is NOT expected.
One may try to identify a minimum and a maximum and maximum in the calculated values of and take these as the aphelion and perihelion. In the figure these two points are shown and the line between drawn , i.e. the magenta line. 1.0 Clearly these are not the aphelion and perihelion (as evidenced by the fact that the line connecting them does not pass through the focus), but they lie close. 1.0
We see that the points on either side of supposed aphelion are reasonably close (and the planet will be moving slower close to aphelion). However, there is a big gap between the second and third point, we take the aphelion position to be the correct one and draw the line of apsides to pass through aphelion and (0,0). (see below for the actual calculation of that does not rely on the graphical identification of the line of the apsides.) 2.0
(b) (i) Assuming that the points above are close to the perihelion and aphelion, we should realise that the distance between them is roughly equal to the length of the major axis. Using the cosine rule,
3.0
(ii)
2.0
Some students may visually fit an ellipse to the data and draw this line up to this visually fit ellipse. For the fit ellipse in the figure, the length of the major axis (green line) is and , rotated by .
(iii) From Kepler’s Laws,
1.0
The semi-period will be . Note that the time difference between our chosen points is only . This is fine, as we can see from the best fit ellipse that these points are not exactly along the line of apsides.
At the same time, this is precisely the reason why one should not take between these two points as the semi-period.
(c) The error in the semimajor axis is determined by the error in and which, in turn, depend on and . The latter is dominated by the uncertainty in the orientation of the ellipse (i.e., the assumption that and are close to the line of the apsides).
In order to take this into account we take as the difference with the value that corresponds to the difference in angles of the actual perihelion and aphelion (); i.e., , corresponding to . The geocentric distance is determined via parallax, the other quantities are constants, so it may be written . The immediate consequence is where is the designation for the relative error. Thus,
This gives and .
The error in is then
3.0
The uncertainty in the period can then be obtained from Kepler’s law and is
1.0
The eccentricity can be calculated from . Error propagation leads to
2.0
Оригинал в Архива: GeCAA-2020_Data_Analysis.pdf · официални решения: Data Analysis Solutions.pdf