GPhO 2017, Експеримент — Задача 1. Problem E1. Electric guitar
The 2nd Gulf Physics Olympiad — Experimental Competition. Riyadh, Saudi Arabia — Monday, April 3rd 2017 · 3 април 2017 г. · 20 т.
Корица
- The examination lasts for 5 hours. There is one problem worth in total 20 points.
- Initially the experimental equipment on one table is covered. You must neither remove the cover nor open the envelope with the problems before the sound signal of the beginning of competition.
- You are not allowed to leave your working place without permission. If you need any assistance (malfunctioning equipment, broken calculator, need to visit a restroom, etc), please raise and keep your hand raised until an organizer arrives.
- Use only the front side of the sheets of paper.
- For each problem, there are dedicated Solution Sheets (see header for the number and pictogramme). Write your solutions onto the appropriate Solution Sheets. For each Problem, the Solution Sheets are numbered; use the sheets according to the enumeration. Always mark which Problem Part and Question you are dealing with. Copy the final answers into the appropriate boxes of the Answer Sheets. There are also Draft papers; use these for writing things which you don’t want to be graded. If you have written something what you don’t want to be graded onto the Solution Sheets (such as initial and incorrect solutions), cross these out.
- If you need more paper for a certain problem, please raise your hand and tell an organizer the problem number; you are given two Solution sheets (you can do this more than once).
- You should use as little text as possible: try to explain your solution mainly with equations, numbers, symbols and diagrams. Though in some places textual explanation may be unavoidable.
- After the signal signifying the end of examination you must stop writing immediately. Put all the papers into the envelope at your desk. You are not allowed to take any sheet of paper out of the room. If you have finished solving before the final sound signal, please raise your hand.
Условие
In this experiment we measure different physical properties of steel guitar string material. The properties of steel vary a lot depending on the exact alloy composition and treatment. This guitar string is made of specific tempered high carbon steel (sometimes called “music wire”) to get the high tensile strength required.
First we measure electrical resistivity and Young’s modulus of the string material. Then we use those properties to measure the coefficient of thermal expansion of the steel. As we can see from our measurements, the temperature can greatly affect the tune of musical instruments.
Equipment
Stand (including a guitar string, piezoelectric contact microphone and an amplifier), DC supply, test leads (in total 9 of different kinds), two multimeters, a set of resistors (values , , , the values are not exact), measuring tape.
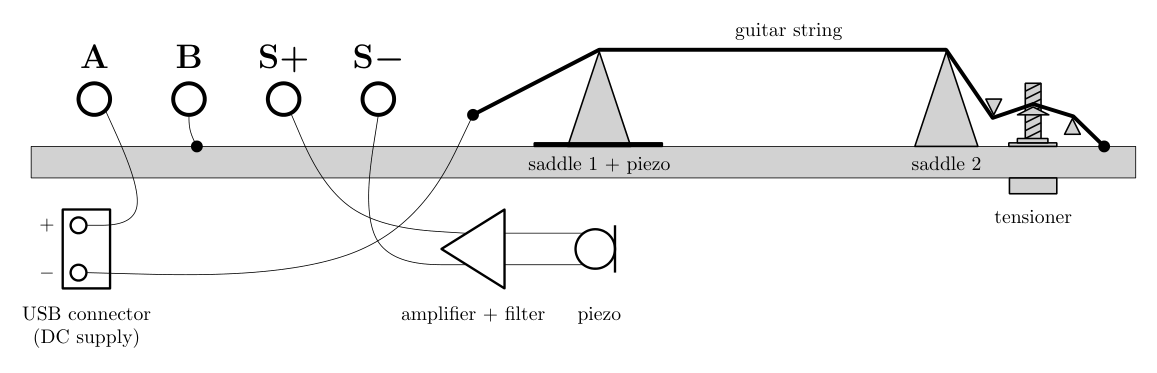
The stand has a guitar string tensioned over two main supports (“saddles” in guitar terminology) followed by a simple tensioner for further stretching the string. The amount of tensioning can be deduced from the number of turns of the tensioning screw. The first saddle is glued to a piezoelectric contact microphone for transforming the mechanical vibrations into an electrical signal, which is then amplified and filtered (to remove some noise) and output between S+ and S−. The contacts A and B allow you to pass a controllable electric current through the string, if connected either directly or through a resistor. One end of the string is in electrical contact with stand body (and contact B), other end is connected to . You are allowed to connect the test leads directly to stand body or string.
The smaller multimeter can be used to measure the frequency of the string oscillations from S+ and S−. When doing so, ensure that the USB power supply is connected; pluck the string strongly enough to hear a clear sound; take the reading when it has stabilized (immediately after plucking the string, the multimeter may show the frequency of higher harmonics). Keep in mind that the final reading may be inexact, again, because the oscillations amplitude becomes too small for the multimeter to register them. Try several times to exclude any false readings. Correct reading should be between and . The measurement is easiest for range, so you might want to first tension the string, measure and work down in tension from there.
WARNINGS:
- Do not tension the string so strongly that its fundamental frequency is over , otherwise you can damage the string (and ruin your measurements)!
- Use the input of the multimeter when measuring currents that are larger than .
Constants
- The pitch of the thread of the tensioning screw is (the string tensioner will rise by when the knob is turned by ). Assume the string has a circular cross section.
- When heated, the relative change of the resistivity of the string is .
- The linear density of the string at room temperature is .
You may assume that all the constants given in this section are exact.
Accuracies
The accuracy of the measuring tape is . The internal resistance of the multimeters in the DC voltmeter mode is for AX-100 and for AX-MS811. The accuracy (maximum allowed error) of a digital multimeter is usually given in the form “” meaning percent of the reading plus units of the final digit. The values relevant for this experiment are as follows.
| Range | Accuracy of AX-100 |
|---|---|
| DC | |
| DC | |
| Range | Accuracy of AX-MS811 |
|---|---|
| DC voltage | |
| Resistance | |
| Frequency |
Part A. String dimensions Measure the length of the part of the string that is under tension. Estimate its uncertainty. You can assume that in the least tensioned position, the string is unbent over tensioner and that the string supports are small enough so that you can ignore the error from their curvature.
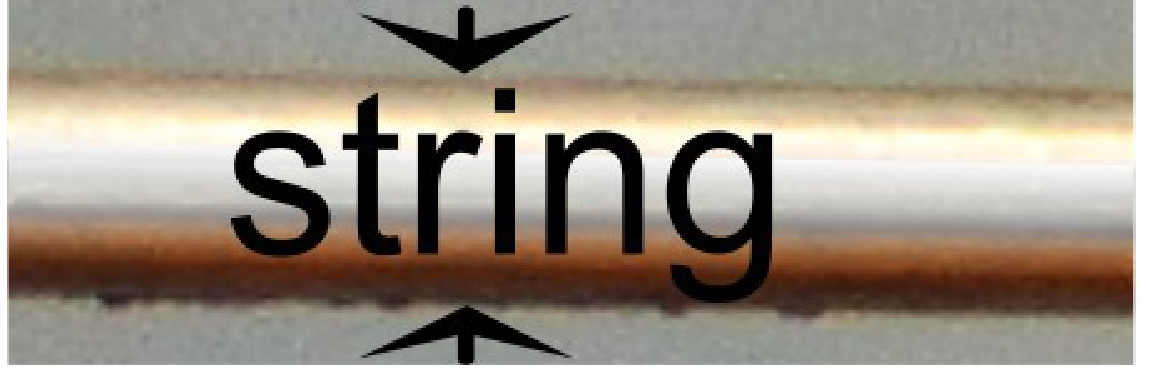
Here is a photo of the string, magnified . From the photo, measure the diameter of the string. Estimate its uncertainty. [2 т.]
Part B. Resistivity The electric resistance between the ends of a cylindrical piece of material is characterized by its resistivity , where is its resistance, its cross section area and its length.
Measure as exactly as possible the resistivity of the string at room temperature. Estimate the uncertainty. Draw the circuit diagram used, indicating the exact placement of all the used leads, which multimeter(s) you used and what were their settings. [3 т.]
Part C. String oscillations A string on a guitar is characterized by its fundamental frequency — the lowest frequency of its free oscillations. Measure and plot how the fundamental frequency of the string depends on its length .
To find the length, you may use the following approximation:
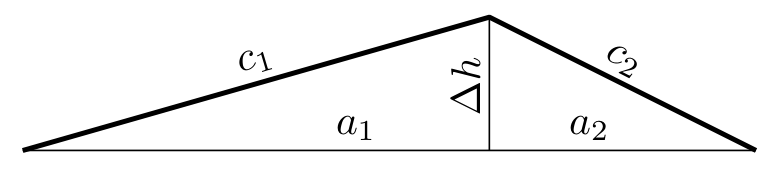
where the lengths are defined in the figure. [3 т.]
Part D. Young’s modulus of the string The elasticity of a cylindrical piece of material can be characterized by its Young’ modulus , where is the applied tension (or compression) force, is its cross section area, is the original (unstretched) length and is the final (stretched) strength. It is known that waves travel along the string with a speed , where is the tension force and is the linear density (mass per unit length) of the string. (Note that string oscillations are standing waves.)
Using the results of the previous task, plot an appropriate graph for finding the Young’s modulus of the string. Find it and estimate the uncertainty. [4,5 т.]
Part E. Heated string You can heat the string by passing some electric current through it (by connecting A and B either directly or through a resistor). At some fixed length, measure and plot how its fundamental frequency depends on its temperature . Hint: Temperature can be determined by measuring the resistance of the string and using ; for room temperature use . [3 т.]
Part F. Thermal expansion of the string When heated, the length (and similarly the width) of a piece of material follows the formula , where the constant is called the coefficient of linear heat expansion, is the original length, the original temperature, the final length and the final temperature. Note that if stretching is also involved, then this formula describes only the unstretched length!
Plot the results of the previous task in appropriate axes for finding the coefficient of linear heat expansion for the guitar string. Find it and estimate the uncertainty. [4,5 т.]
Отговори
Part A. String dimensions l1 = 674 ± 4 mm; d = 0.195 ± 0.010 mm
Values from the official solution's own measurement.
Part B. Resistivity Ω·m
Official solution: ρ ≈ 1.89 × 10⁻⁷ Ω·m with Δρ ≈ 0.17 × 10⁻⁷ Ω·m.
Part D. Young’s modulus of the string 237 GPa
Official solution: E = 237 GPa with ΔE = 48 GPa.
Part F. Thermal expansion of the string 0.0000048 K⁻¹
Official solution: α = 4.8 × 10⁻⁶ with Δα = 1.3 × 10⁻⁶; the solution prints the value without a unit (per kelvin).
Решение
Part A. String dimensions (2 points)
For length , directly measured quantities and calculations:
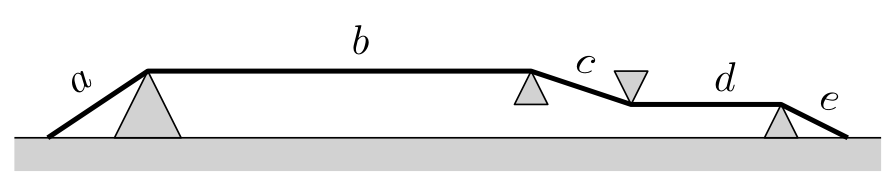
Length and its uncertainty:
The error of , , , and can be roughly estimated to be , because the roundness of the supports hinders any more precise measurement. These errors are random and not correlated, thus the uncertainty
For string diameter , directly measured quantities and calculations:
in the figure the diameter (the error is combined from the accuracy of the measuring tape and the roughness of the string’s surface).
String diameter and its uncertainty:
. [0.5 p for the value and 0.5 p for the uncertainty]
Part B. Resistivity (3 points)
Draw measurement circuit(s):
The string should be heated as little as possible, thus we should use as big a resistor as possible to limit the current. The most precise measurement can be done by connecting a resistor and an ammeter between A and B and a voltmeter between the saddles (with the leads as close to the saddles as possible).
For string resistivity , directly measured quantities, calculations and multimeter settings:
multimeters’ ranges: AX-100 at , AX-MS811 at DCV.
String resistivity and its uncertainty:
[0.5 p for using the least current possible (largest resistor), 1 p for connecting the voltmeter as close to the saddles as possible (a correct 4-point measurement), 0.5 p for measuring the values, 0.5 p for calculations and 0.5 p for a reasonable uncertainty calculation]
[Max 1.5 p if measured with an ohmmeter (much less precise)]
Part C. String oscillations (3 points)
Draw measurement circuit(s):
The circuit consists in a Hz-meter connected between S+ and S−.
Measurements and calculated data (you don’t have to fill the entire table):
For calculating the lengths, we measure the tensioner’s dimensions and , and calculate the useful coefficient . We take the length from part A.
| turns of the screw | (Hz) | (mm) | (mm) | (mm) | (Hz) for part D |
|---|---|---|---|---|---|
| 0 | 210.8 (error) | 0 | 0 | 674.0000 | 44400 |
| 1 | 197.5 | 0.7 | 0.0120 | 674.0120 | 39000 |
| 2 | 201.1 | 1.4 | 0.0478 | 674.0478 | 40400 |
| 3 | 205.7 | 2.1 | 0.108 | 674.108 | 42300 |
| 4 | 212.8 | 2.8 | 0.191 | 674.191 | 45300 |
| 5 | 221.6 | 3.5 | 0.299 | 674.299 | 49100 |
| 6 | 231.7 | 4.2 | 0.430 | 674.430 | 53700 |
| 7 | 242.4 | 4.9 | 0.586 | 674.586 | 58800 |
| 8 | 254.6 | 5.6 | 0.765 | 674.765 | 64800 |
| 9 | 268.5 | 6.3 | 0.968 | 674.968 | 72100 |
| 10 | 280.8 | 7.0 | 1.20 | 675.20 | 78800 |
| 11 | 293.0 | 7.7 | 1.45 | 675.45 | 85800 |
| 12 | 309.4 | 8.4 | 1.72 | 675.72 | 95700 |
| 13 | 324.4 | 9.1 | 2.02 | 676.02 | 105000 |
| 14 | 340.5 | 9.8 | 2.34 | 676.34 | 116000 |
| 15 | 355.0 | 10.5 | 2.69 | 676.69 | 126000 |
| 16 | 369.7 | 11.2 | 3.06 | 677.06 | 137000 |
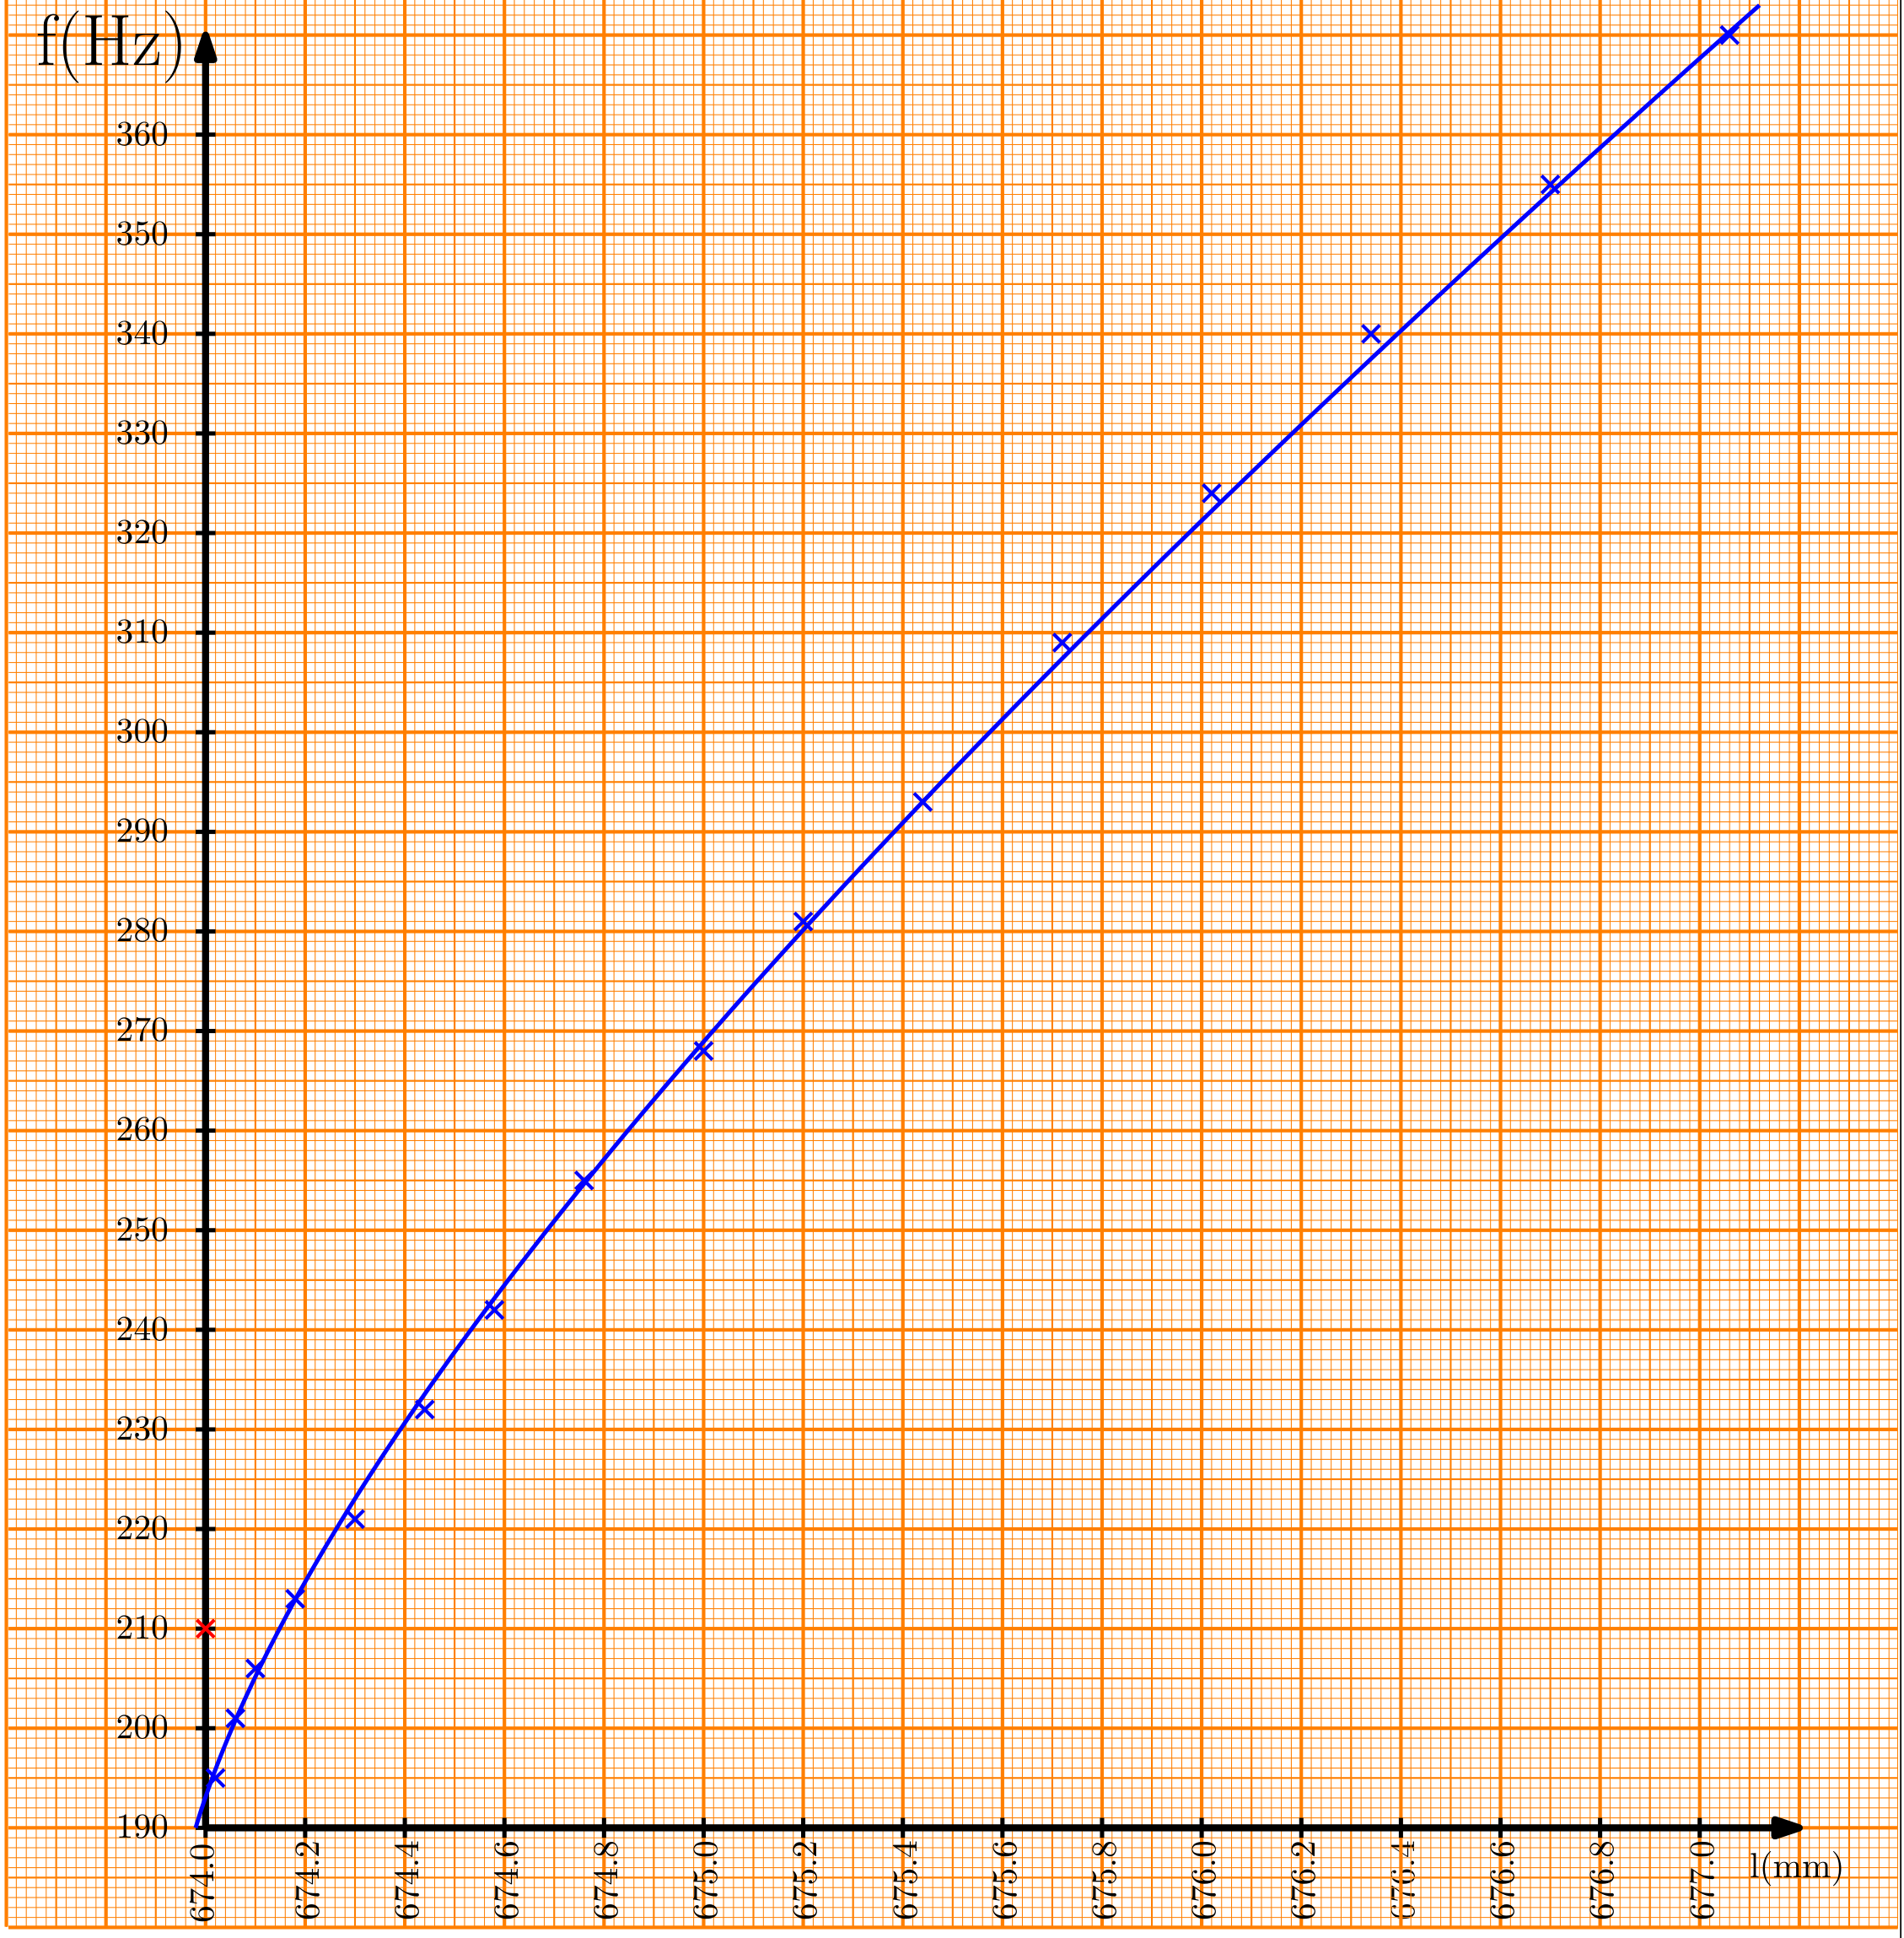
[1 p for the quality of frequency measurements, 1 p for at least 7 measurements with the minimum and maximum frequency differing at least 1.5 times, 0.5 p for calculating the lengths, 0.5 p for plotting]
Part D. Young modulus of the string (4.5 points)
Suitable axes for finding Young modulus from graph expressed by known quantities:
In the fundamental mode of oscillations there is exactly one half of a wavelength on the string (the ends are fixed and the middle has the maximum amplitude). We can relate the wavelength to the wave’s speed by , where is the distance between the saddles (as in part A). Thus, . On the other hand, . Therefore
and there ought to be a linear relationship between and . The zero (-intercept) of the straight line would give us the unstretched length , and the slope would then give .
However, as the changes in the length are quite small, it is perfectly acceptable to replace the in the denominator by one of the measured lengths and thus avoid calculating the -intercept at all.
[1.5 p for these or equivalent choices for the axes]
Calculated data for the graph (you don’t have to fill the entire table):
It is most convenient just to add a column of to the table in part C.
[Calculation: 0.5 p]
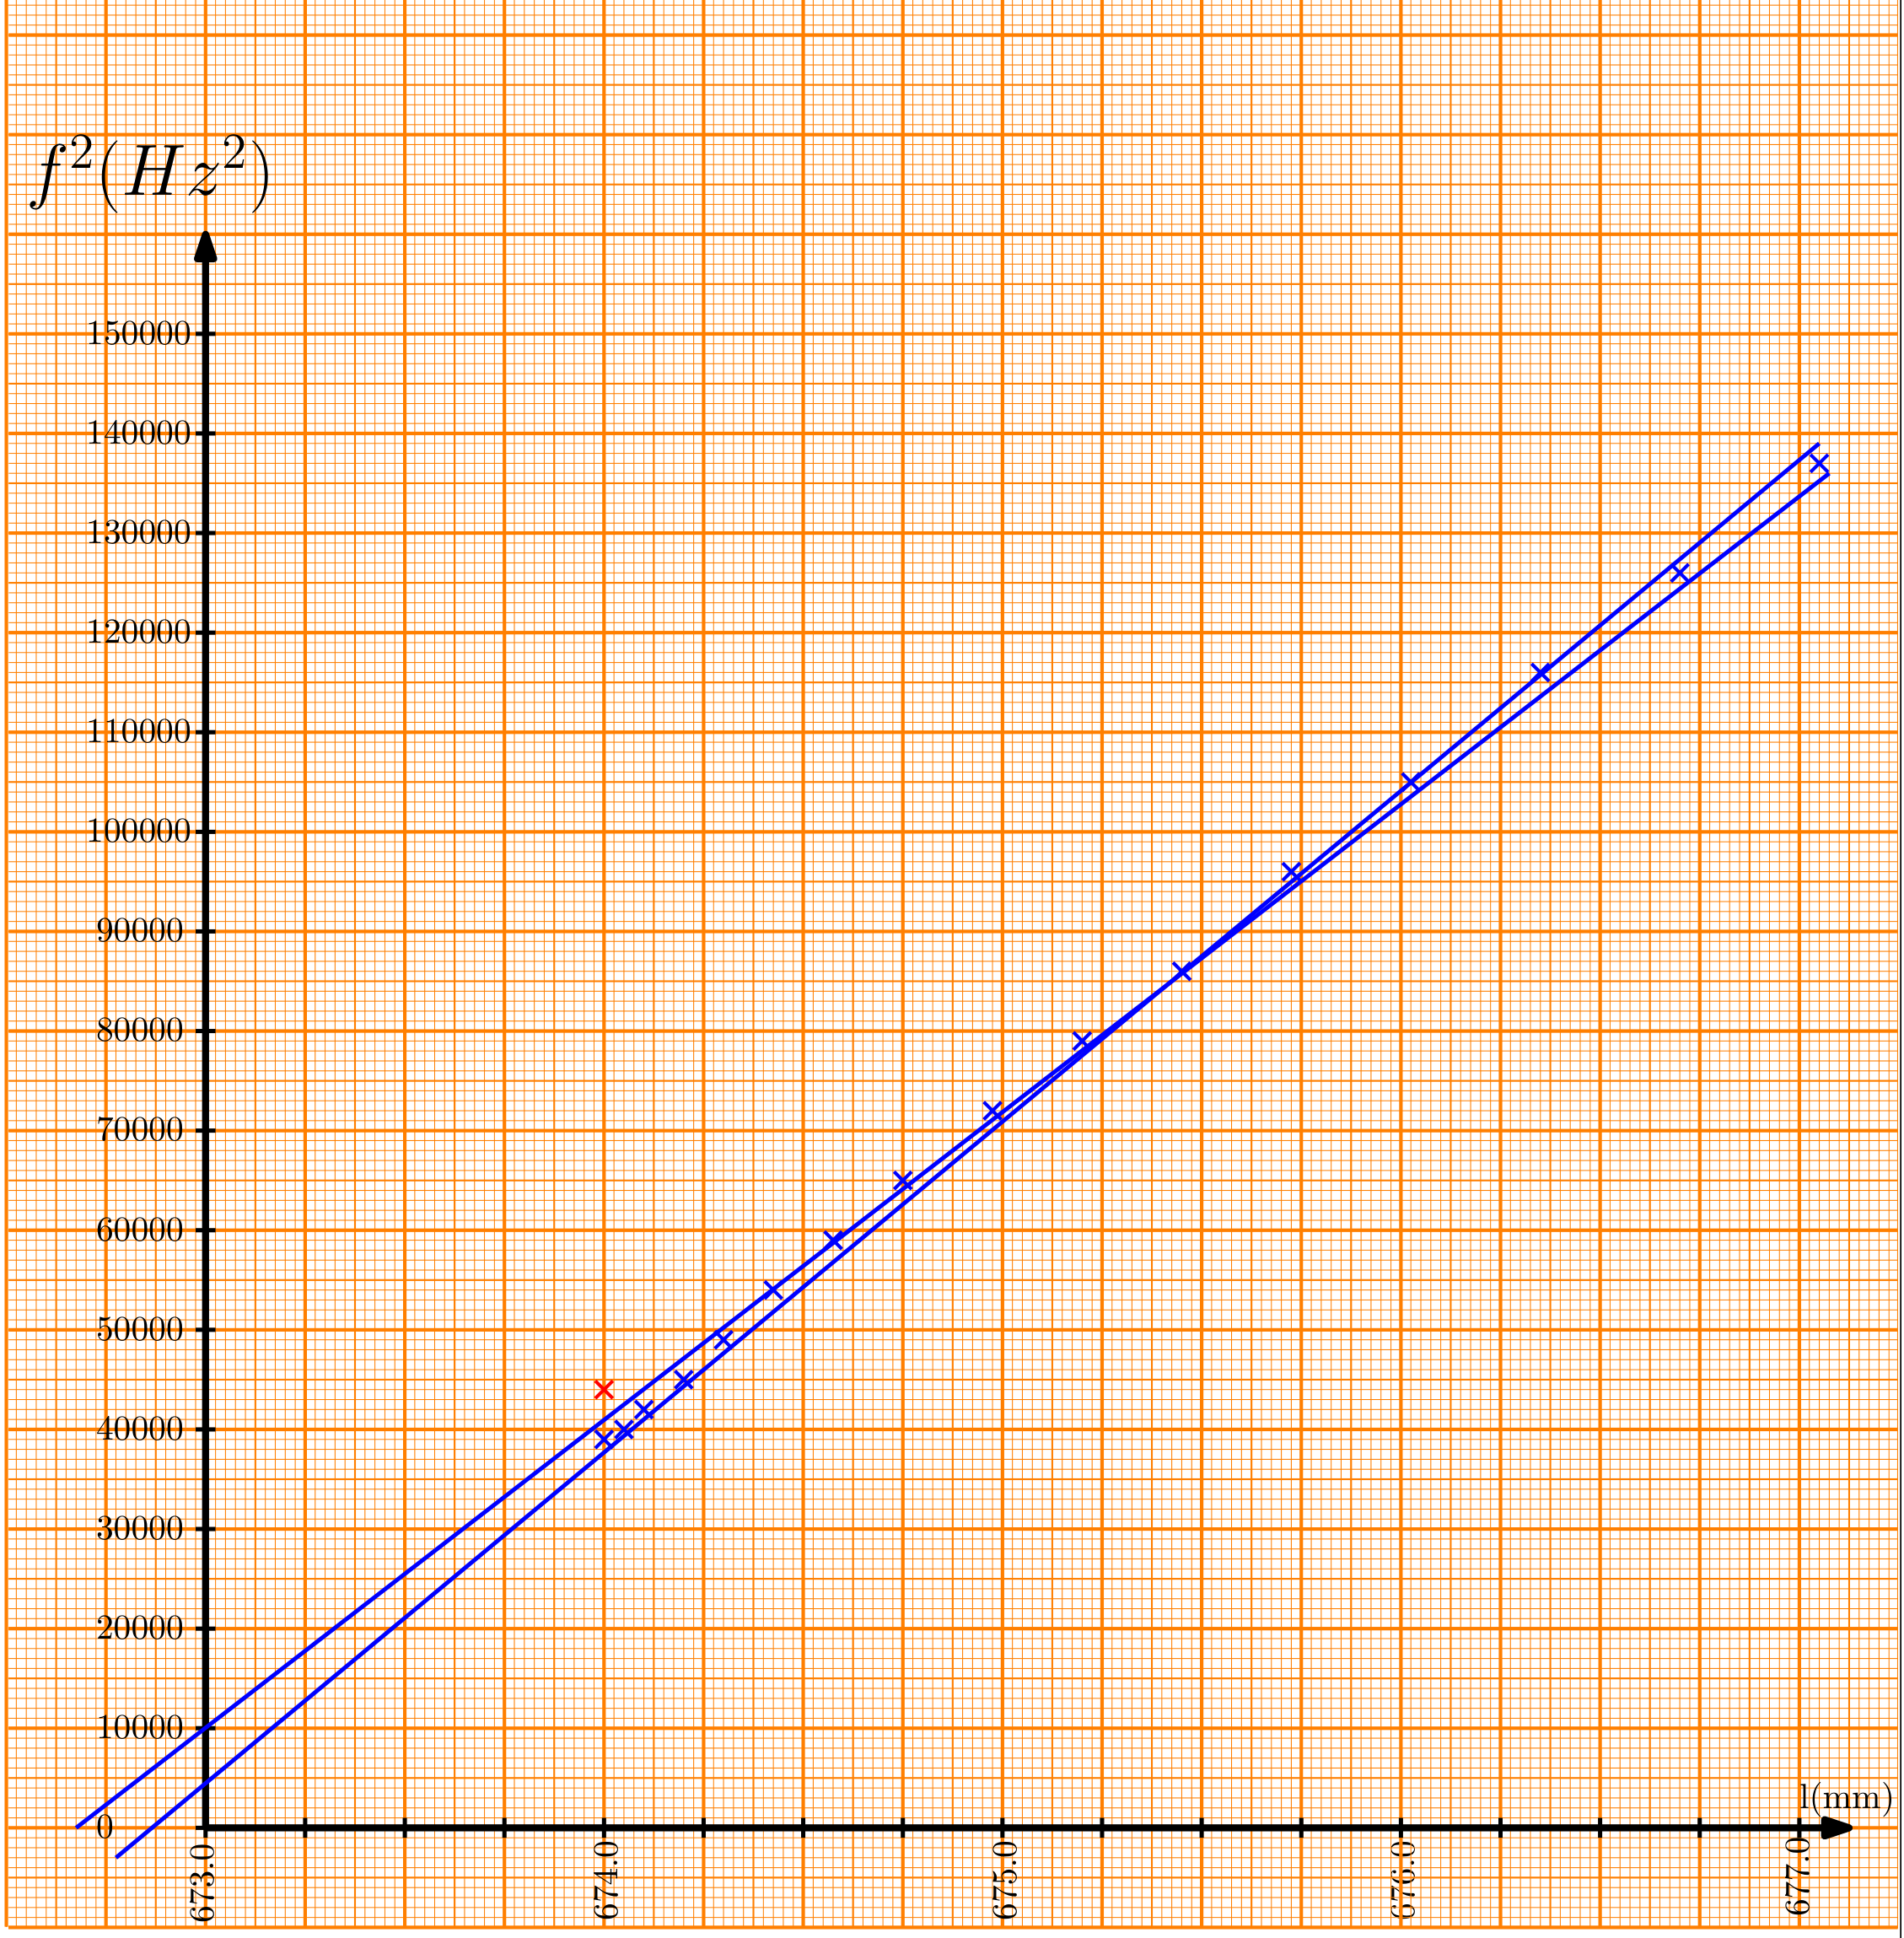
[Plotting: 0.5 p]
Calculations: From the graph, the slope is and the -intercept . From there, .
Young modulus and its uncertainty:
[If only slope error is taken into account, 0.5 p for the uncertainty]
Part E. Heated string (3 points)
Draw measurement circuit(s):
We tensioned the string by 10 turns of the screw to ensure the frequencies stay high enough. Then we connect a resistor () and an ammeter (in the range) between A and B and alternate with the smaller multimeter between measuring the frequency on S+ and S− and measuring the voltage between the two saddles. By choosing different resistors or omitting it entirely we obtain different heating powers.
Measurements and calculated data (you don’t have to fill the entire table):
Let denote the room temperature and let be the resistance of the string at room temperature. Then we can calculate the temperature of the string as follows.
From the data of part B (or just repeating the measurement here), . Here we have the room temperature .
| () | (A) | (V) | (Hz) | () | (C) |
|---|---|---|---|---|---|
| 0 | 0.92 | 4.09 | 217 | 4.45 | 218 |
| 0.1 | 0.91 | 4.05 | 221 | 4.45 | 218 |
| 1 | 0.82 | 3.45 | 225 | 4.21 | 180 |
| 3 | 0.66 | 2.51 | 239 | 3.80 | 117 |
| 10 | 0.36 | 1.25 | 261 | 3.47 | 65.5 |
| 30 | 0.15 | 0.50 | 266 | 3.33 | 43.8 |
| 100 | 0.05 | 0.16 | 267 | 3.20 | 23.0 |
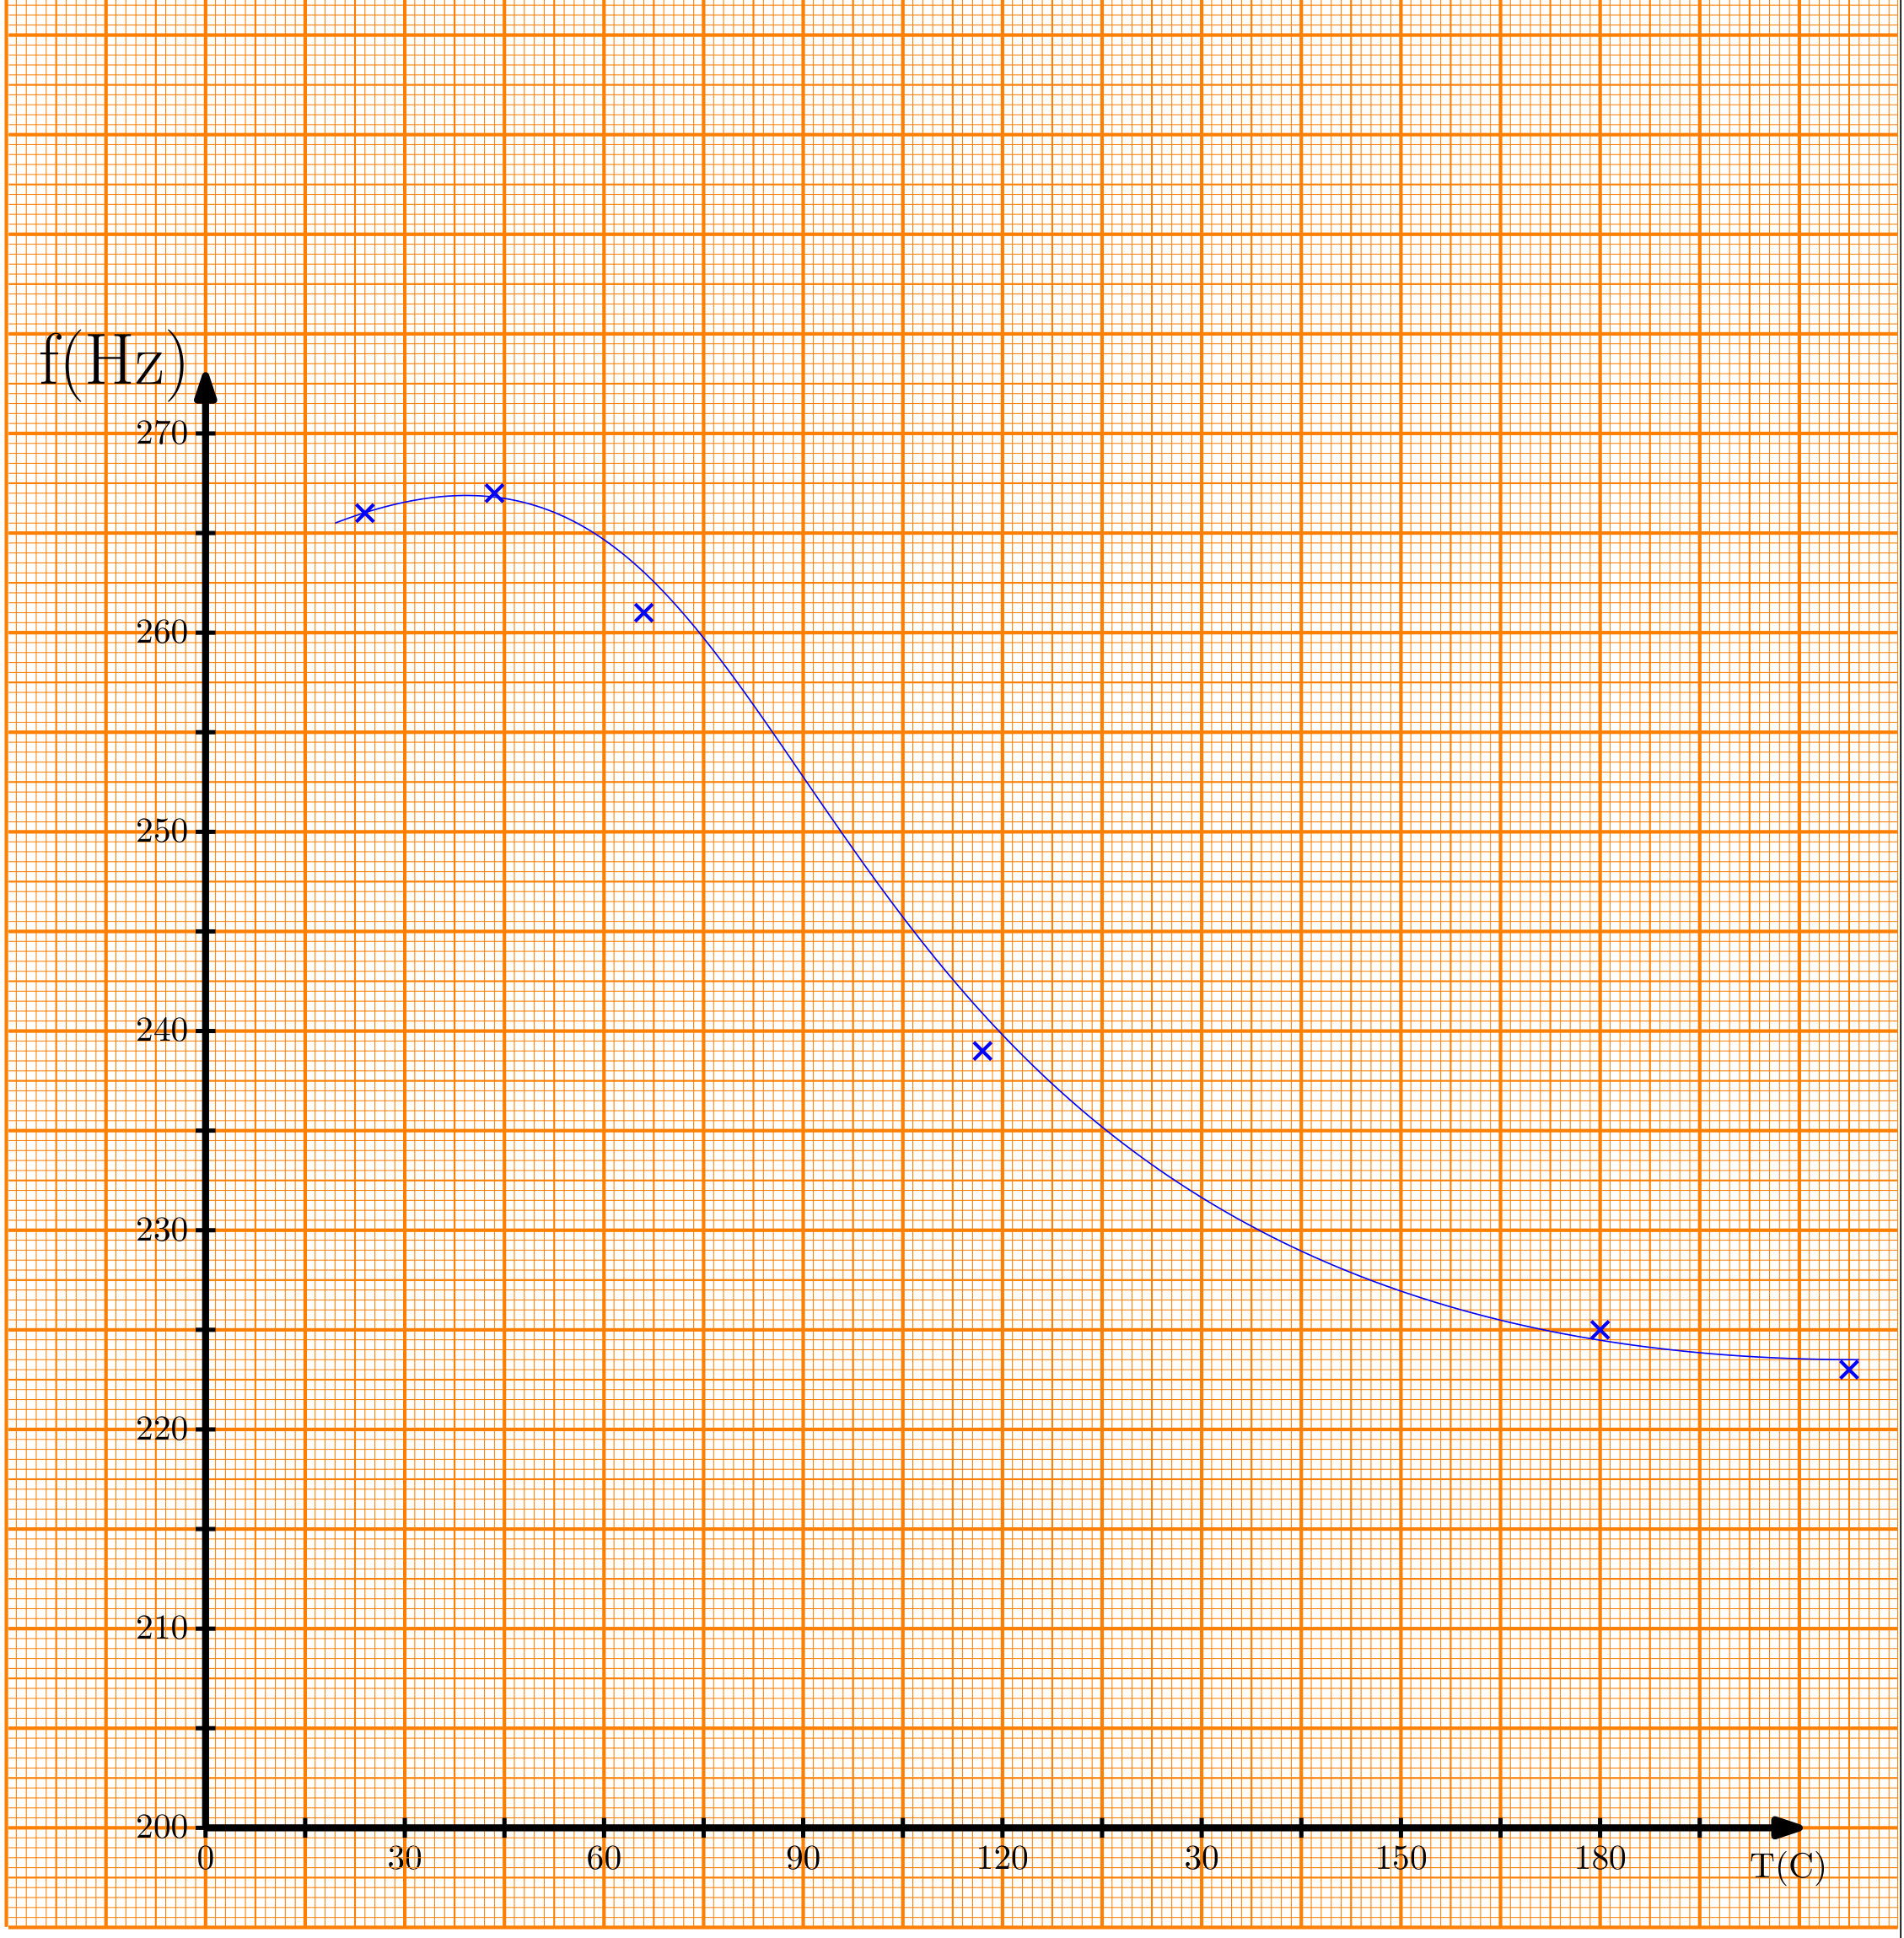
[1.5 p for good measurements (covering all the available temperature range), 1 p for calculating the temperatures, 0.5 p for the plot]
Part F. Thermal expansion of the string (4.5 points)
Suitable axes for finding coefficient of linear heat expansion from graph expressed by known quantities:
The coefficient of linear heat expansion describes the changes in the untensioned length of the string. where is the untensioned length of the string at room temperature. From an expression from part D we can express :
Here approximation made things easier, correct solution without is also possible.
Note that since we are we are only interested the slope we can ignore any constant added to and .
We can get the from the slope of the plot when
Without the approximation we would get.
Calculated data for the graph (you don’t have to fill the entire table):
| (C) | (Hz) | (mm) |
|---|---|---|
| 218 | 217 | 1.127 |
| 218 | 221 | 1.168 |
| 180 | 225 | 1.211 |
| 117 | 239 | 1.366 |
| 65.5 | 261 | 1.630 |
| 43.8 | 266 | 1.692 |
| 23.0 | 267 | 1.706 |
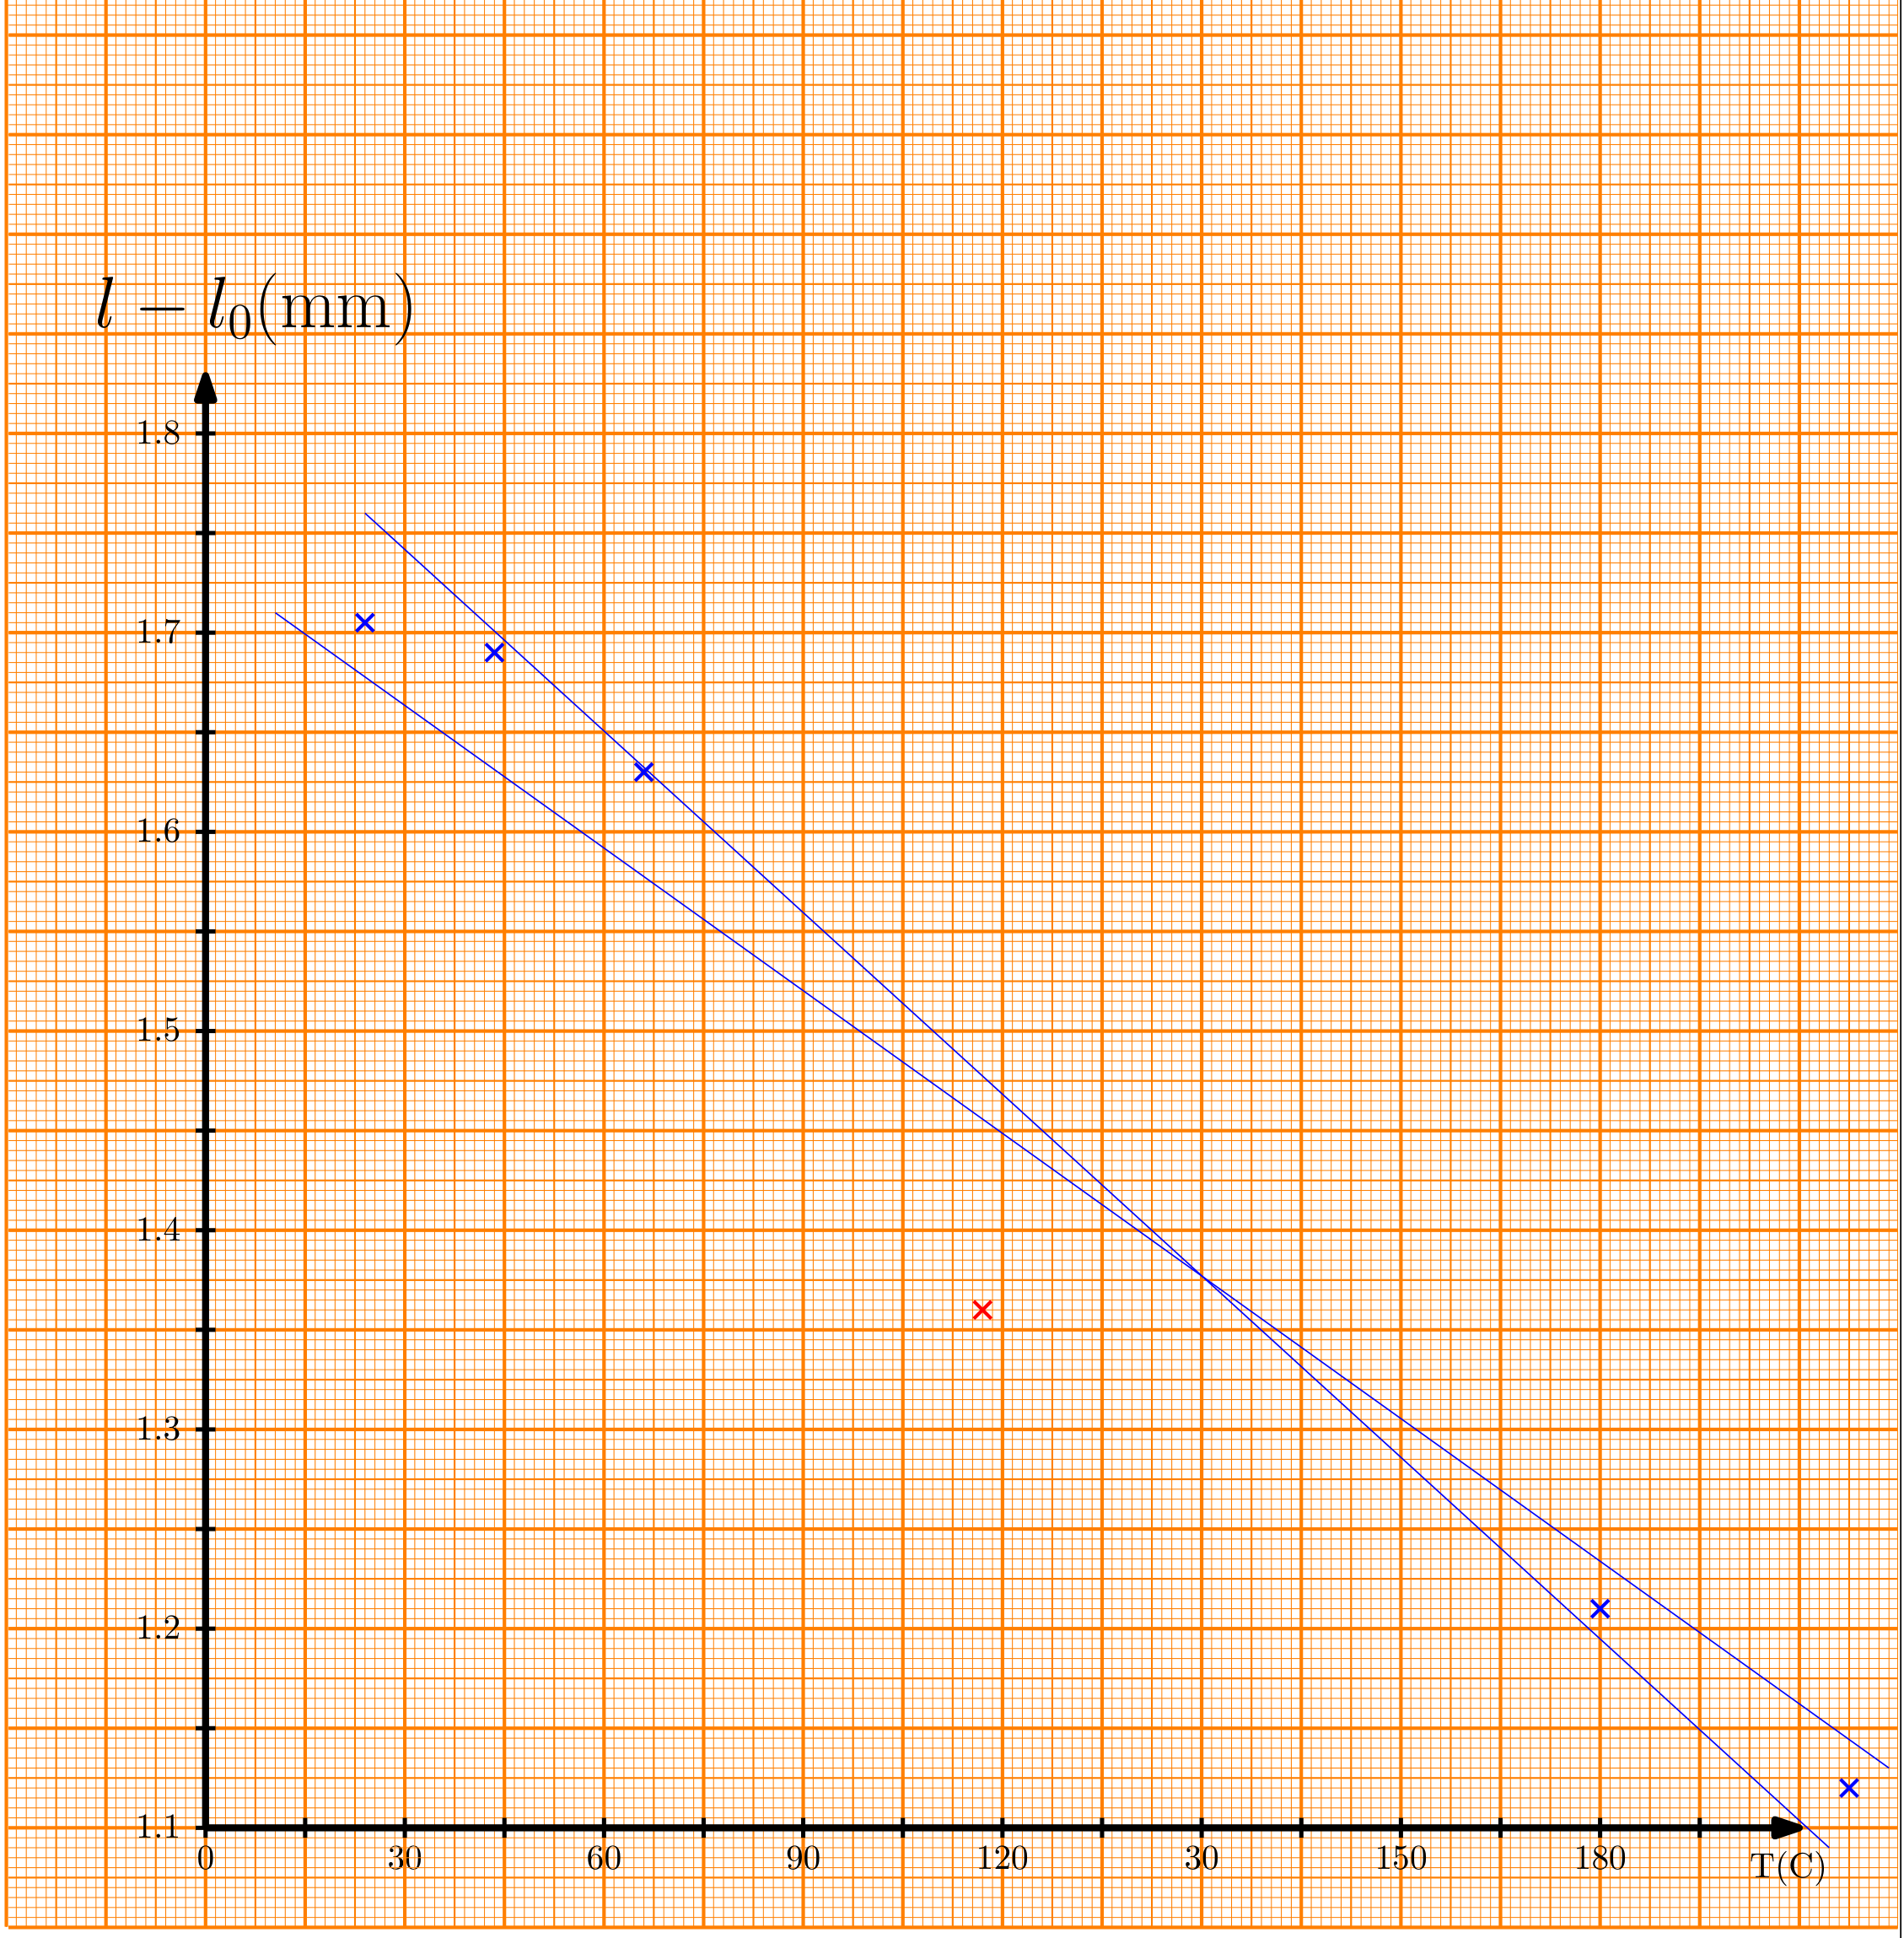
coefficient of linear heat expansion and its uncertainty:
From the plot
The uncertainty is taken from the min-max of the slope. [2 p for a good choice of axes, 0.5 p for plotting, 1 p for calculating the value of , 1 p for the uncertainty] Notice that the main source of errors in this part is caused by the fact that string oscillations cool the string, and the magnitude of this effect depends on the amplitude of oscillations. Because of that, one should take reading with the smallest possible amplitude (for which frequency reading can still be taken). Alternatively, resistance and frequency readings could be taken simultaneously, at the same moment of time, but this is difficult to do if no data loggers are used and only one person is making the experiment.
Оригинал в Архива: exp.pdf · официални решения: exp_sol.pdf