IAO 2002, Практически тур, Група α — Задача 7. Optical "tail" of the gamma-ray burst GRB021004
Practical round. Problem to solve · 22 октомври 2002 г.
Source notation
The introductory English paragraph calls the green band G, while the table and tasks use V. This discrepancy is retained. The table uses superscript d and m for days and magnitudes; numeric values and the bracketed SAO observation interval are retained.
Условие
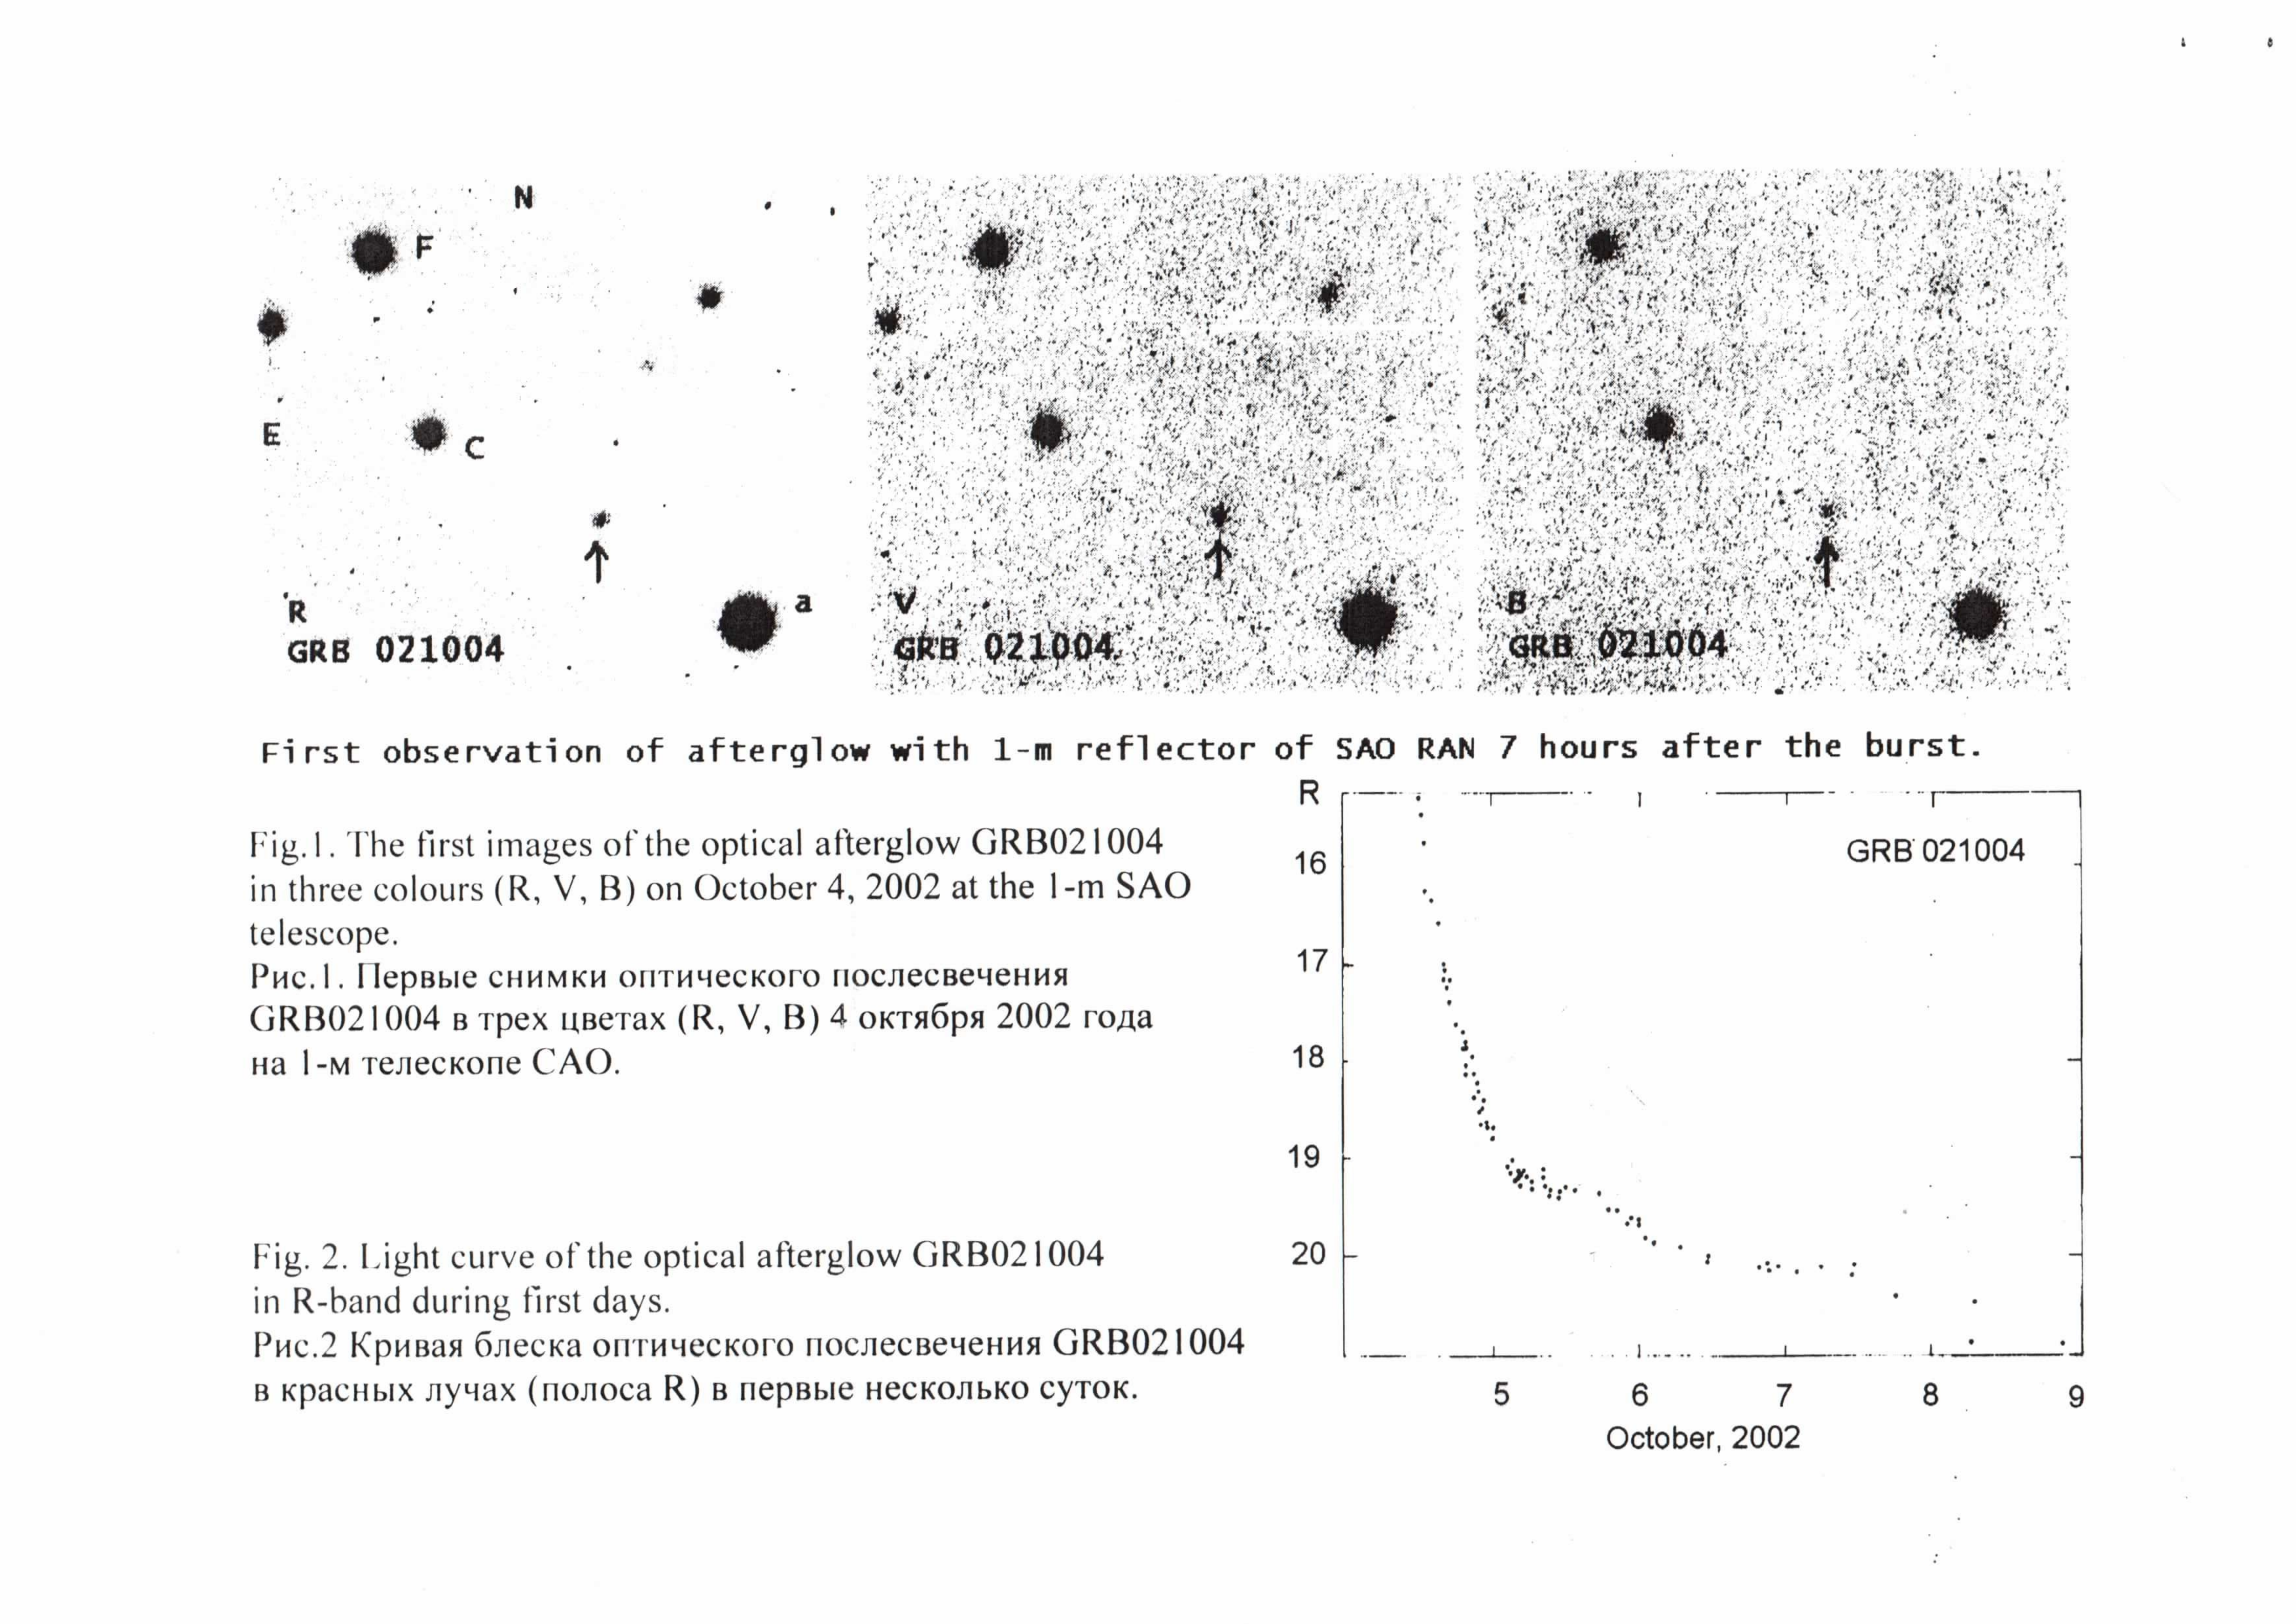
Sure, you know that detection in visible light of afterglow of gamma-ray burst (GRB) was one the most important astrophysical discoveries of the last years. The gamma-ray bursts are known since 1973. But exactly this discovery allowed us to understand that gamma-ray bursts are connected with explosions in distant galaxies. You are lucky because the powerful GRB was registered in the distant galaxy (), in the constellation of Pisces in the beginning of this month (4th of October, 2002, after 12 h GMT). A after 12 min its optical afterglow was discovered. Observations began after several hours at the 1-m SAO telescope. One of the first runs of snapshots taken at SAO in three colors is shown on Fig.1. The Fig.2 shows variation of optical afterglow GRB021004 in the first 5 days.
Visible magnitudes of optical afterglow GRB021004 in the first hours after a burst in red (R), green (G) and blue (B) colours are given in the following table:
| J.D.24525 | |||
|---|---|---|---|
| 52.004 | moment of gamma ray-burst | ||
| 52.013 | 15.5 | ||
| 52.015 | 15.6 | ||
| 52.023 | 15.9 | ||
| 52.050 | 16.3 | ||
| 52.100 | 16.5 | ||
| 52.125 | 16.6 | ||
| 52.200 | 17.2 | ||
| 52.225 | 17.4 | ||
| 52.250 | 17.6 | ||
| 52.300 | 17.82 | 18.20 | 18.50 |
| 52.325 | 17.90 | 18.28 | 18.62 |
| 52.350 | 18.02 | 18.38 | 18.72 |
| 52.375 | 18.08 | 18.48 | 18.83 |
| 52.400 | 18.17 | 18.59 | 18.92 |
| 52.425 | 18.25 | 18.69 | 19.02 |
| 52.450 | 18.35 | 18.78 | 19.12 |
| 52.475 | 18.42 | 18.83 | 19.22 |
| 52.500 | 18.51 | 18.92 | 19.28 |
| 52.550 | 18.8 | ||
| 52.650 | 19.1 | ||
| 52.700 | 19.2 |
Observations with the 1m telescope of SAO: 52.300–52.500.
Tasks
- Plot a curve on the cross-bar paper for above-mentioned tabulated magnitude estimates depending on time.
- Fit the light curve with one or two dependencies of power kind:
where is the parameter of the power function and plot it on the profile.
- Estimate the magnitude at “moment of a gamma-ray burst” with your suggested curve .
- Is there any variation of the afterglow color during observations in three bands R, V and B?
Решение
Внимание: Непълно решение
В архива няма официално решение на тази задача.
Оригинал в Архива: alphapract1.jpg · допълнителни данни: alphapract2.jpg · допълнителни данни: alphapractdata.jpg