IAO 2013, Практически тур, α/β — Задача 8. Jupiter. Analysis of observational data of Jupiter and its moons
XVIII Международная астрономическая олимпиада / XVIII International Astronomy Olympiad, Литва, Вильнюс, 6–14.IX.2013 / Vilnius, Lithuania — Practical round. Problems to solve · 6 септември 2013 г.
Условие
Observational data of Jupiter and its moons are given on separate sheets.
Your answers (measured values, results of calculations, used formulas) must be written in corresponding tables.
A. Group α — supplied rotational velocity
The separate sheet for group α supplies .
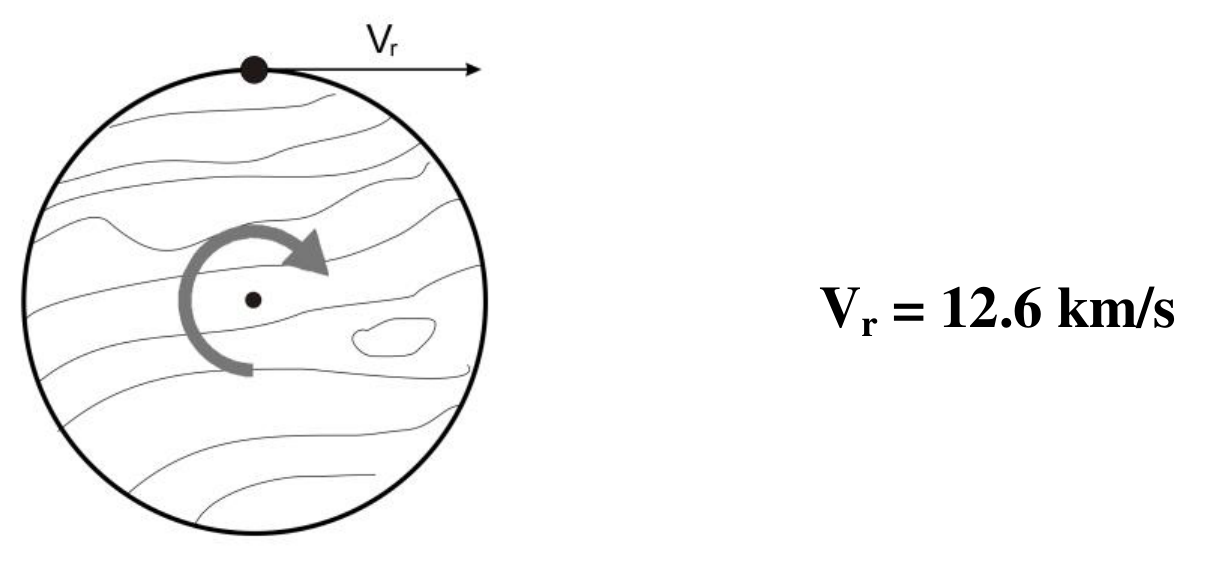
A. Group β — rotational velocity
Spectrum of Jupiter (Fig. 1) was obtained when the slit of a spectrograph was aligned along the planet’s equator. Wavelengths () of several recognized lines are shown. Due to Jupiter rotation the reflected Sunlight was affected by the Doppler effect. The spectral lines become inclined, because the spectrum of light reflected from the receding part of Jupiter is red-shifted, and of light reflected from the approaching part is blue-shifted. Non-inclined lines, which are visible in the spectrum, were formed in the Earth atmosphere.

Table A
N [nm/mm] = ______
| (nm) | dx (mm) | (nm) | (km/s) |
|---|---|---|---|
[km/s] = ______
Formulae
[km/s] = ______
A.1. Evaluate the mean scale of the given spectral interval (N), in nm per mm.
A.2. Measure the difference between the uppermost and the lowermost end of an inclined spectral line in mm (dx) and convert it into nm (). Do this for 3 lines independently.
A.3. Calculate the equatorial rotational velocity of Jupiter () for each measured line and the final averaged value ().
B. Equatorial rotational period and radius
Two CCD images of Jupiter are shown in Figs. 2 and 3. The vertical lines in figures marks the position of the projection of Jupiter‘s rotation axis (we assume it is perpendicular to the line of sight). The rotation period can be obtained from horizontal shifts of stable atmospheric features located relatively close to the equator.
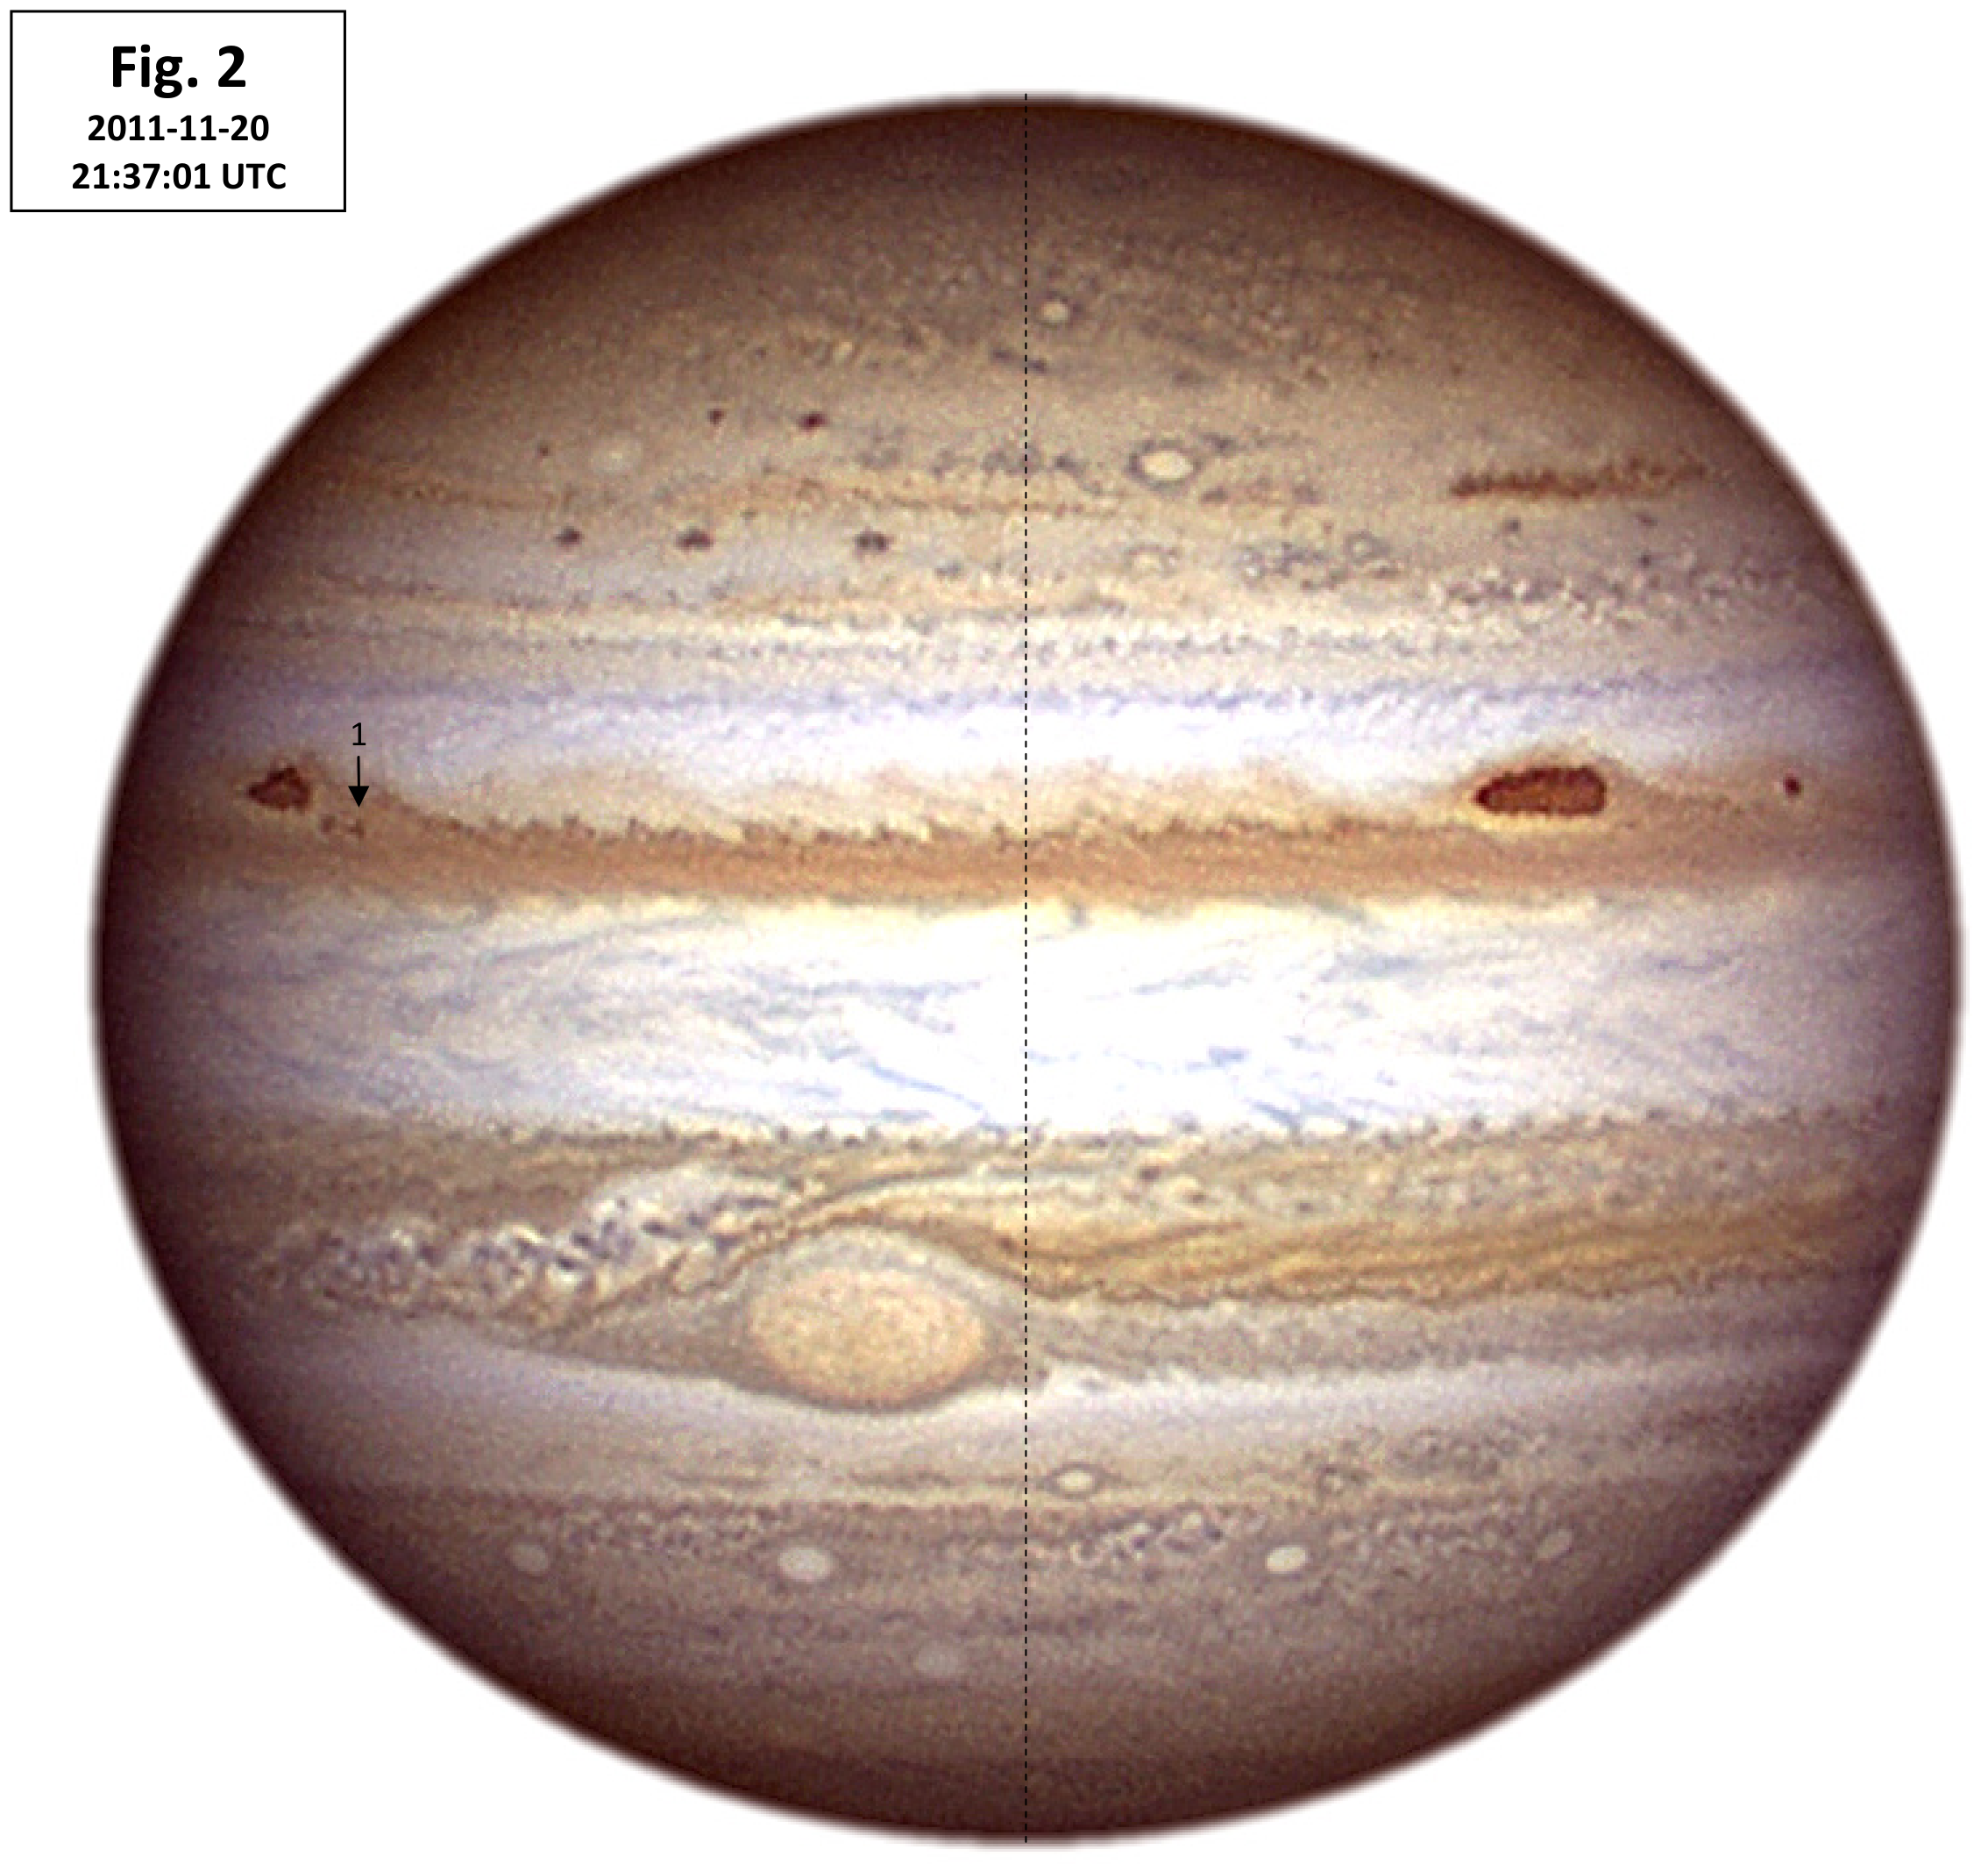
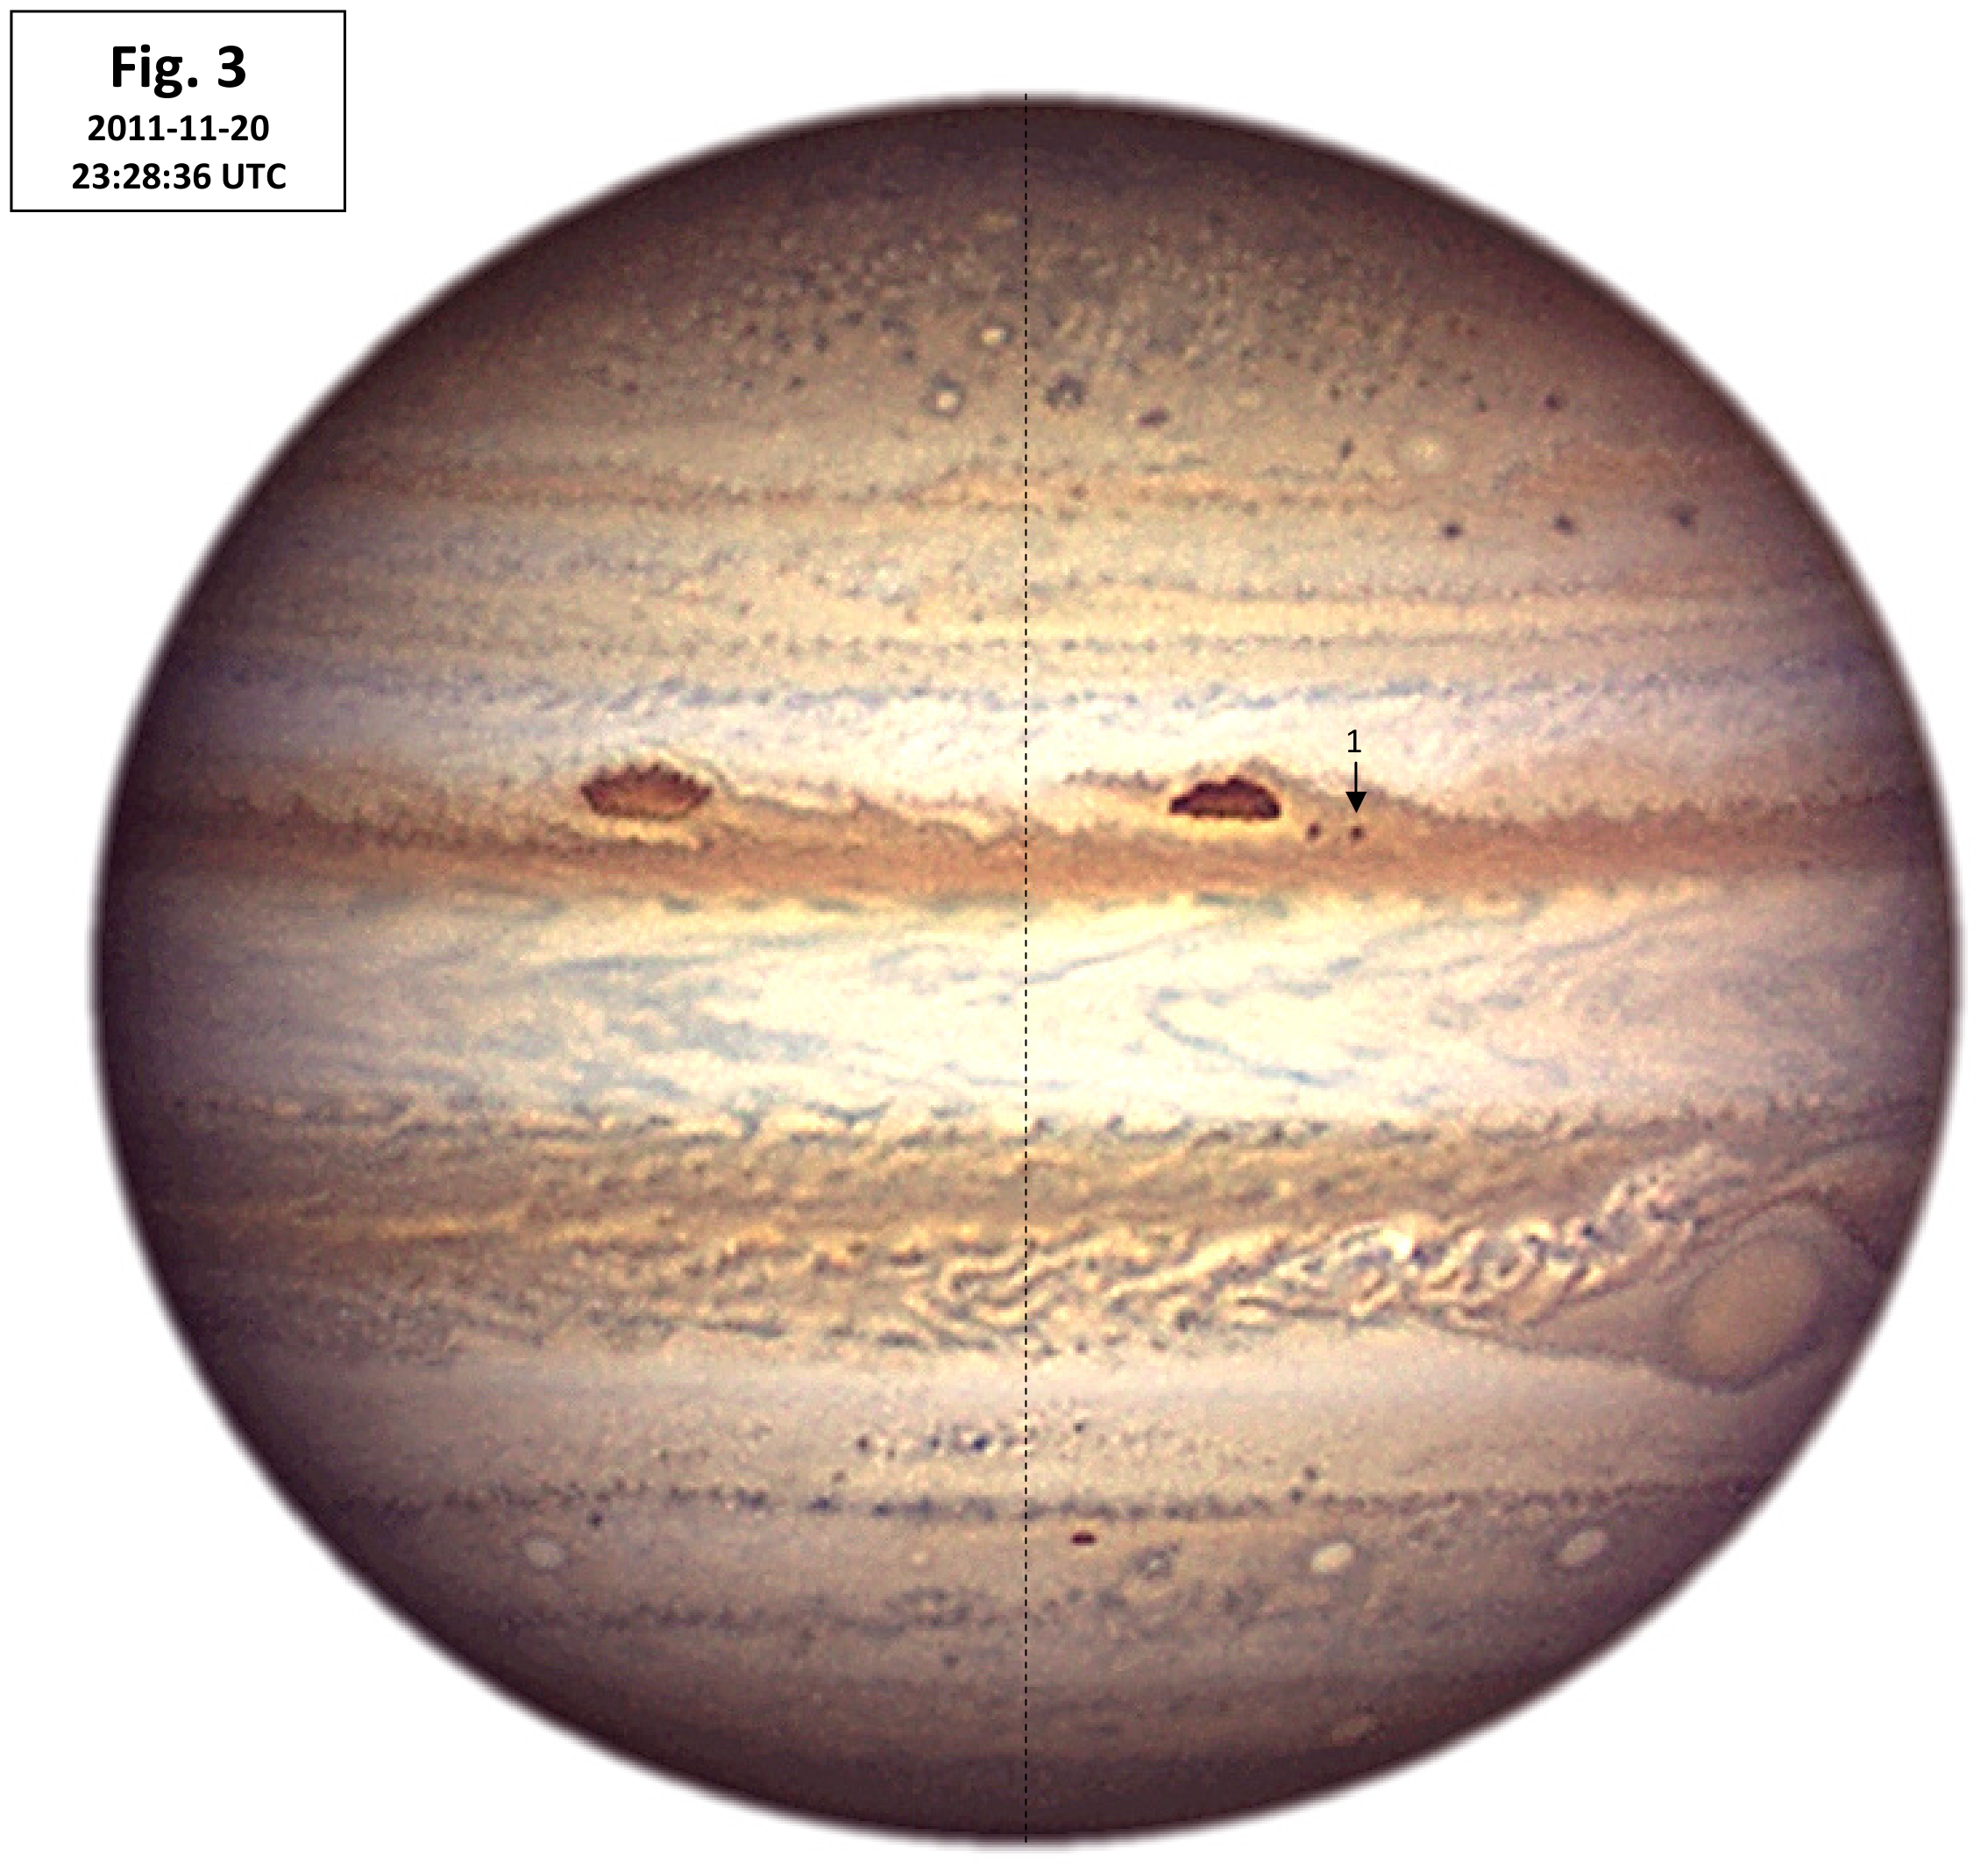
Table B
dt [s] = ______
| Feature | (mm) | (mm) | (mm) | (°) |
|---|---|---|---|---|
| 1 | ||||
| 2 | ||||
| 3 |
= ______
[h] = ______
[km] = ______
Formulae
[°] = ______
[h] = ______
[km] = ______
B.1. What time interval in seconds () separate these images?
B.2. One feature useful for measurements is already marked “1”. Select and mark two additional features as “2” and “3” in both pictures.
B.3. Measure distances from the central vertical line to the marked features in both images ( and , respectively) and to the Jupiter limb at the feature’s latitude ().
B.4. Calculate the rotational angle () for each feature.
B.5. Calculate the averaged value of rotational angle ().
B.6. Calculate the rotational period (), in hours.
B.7. Calculate Jupiter‘s equatorial radius (), in km.
C. Mass and density
Figs. 4-6 display observations of three Jupiter moons obtained during five successive nights in September 2011. Abscissa in those figures is time of observation measured in hours from the beginning of the observing session. Ordinate is the angular distance (in angular minutes) of the moon from the center of Jupiter at the moment of observation. The equatorial radius of Jupiter in the angular seconds is also given for some moments.
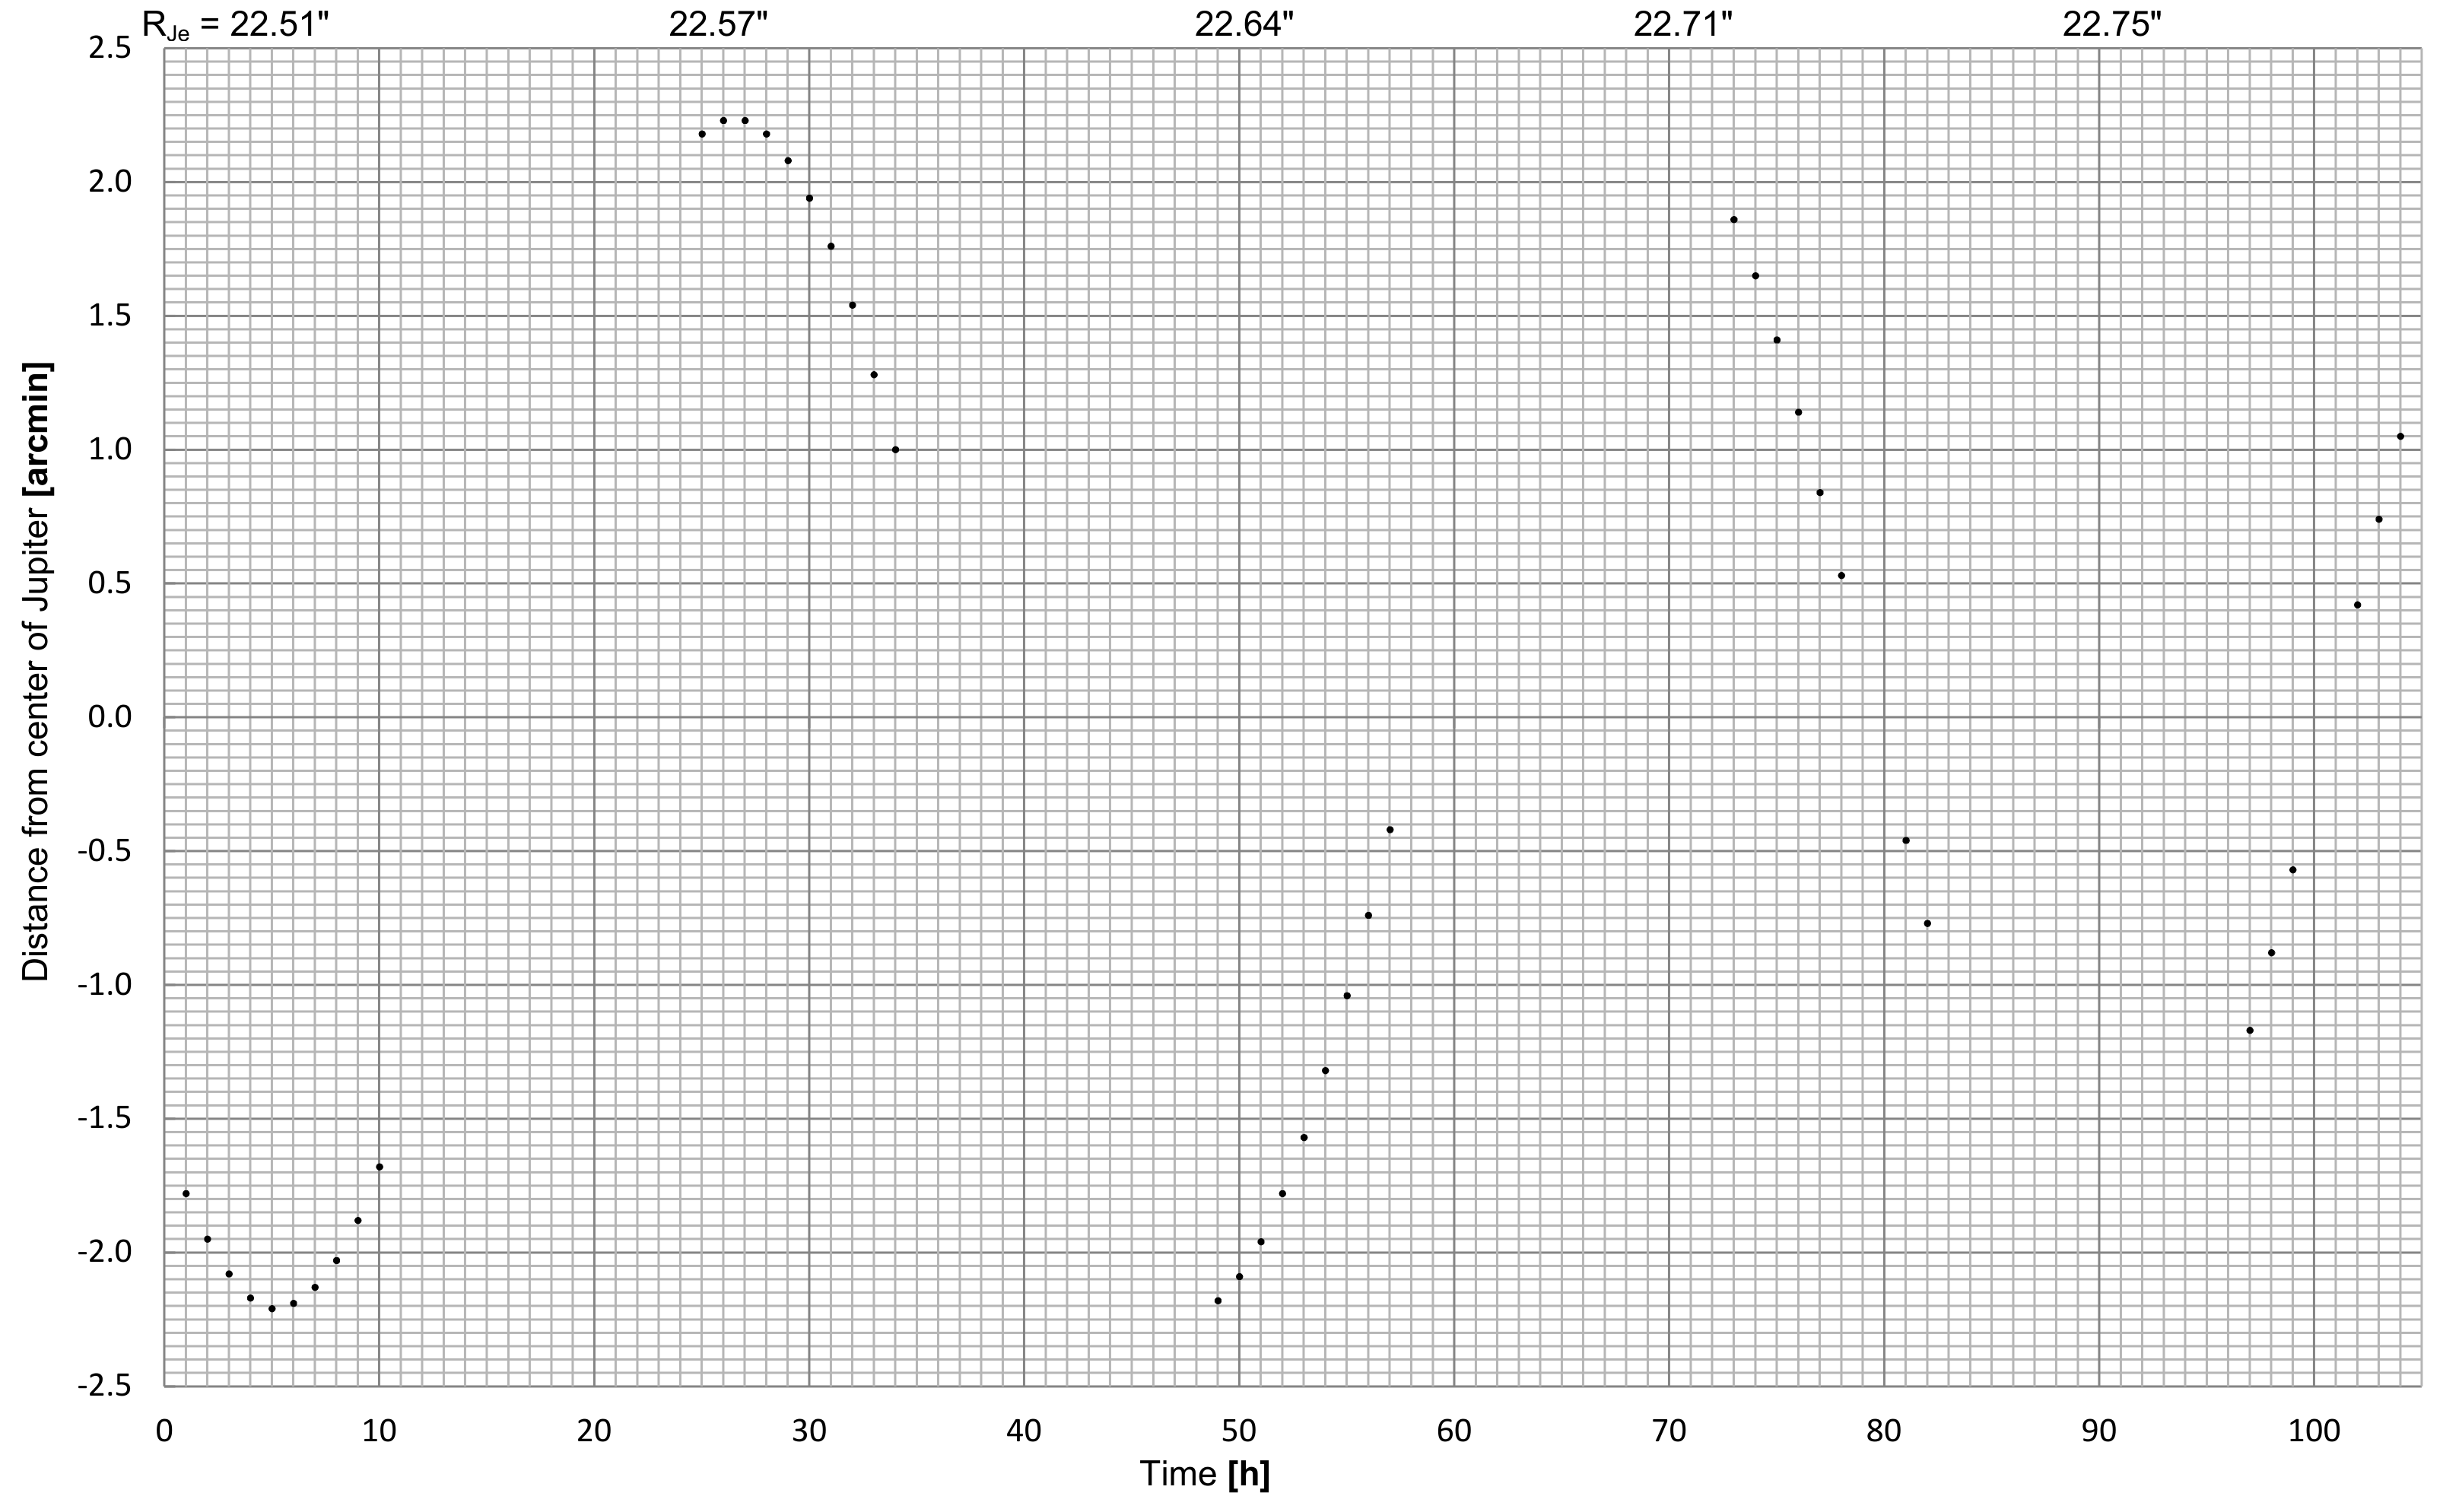
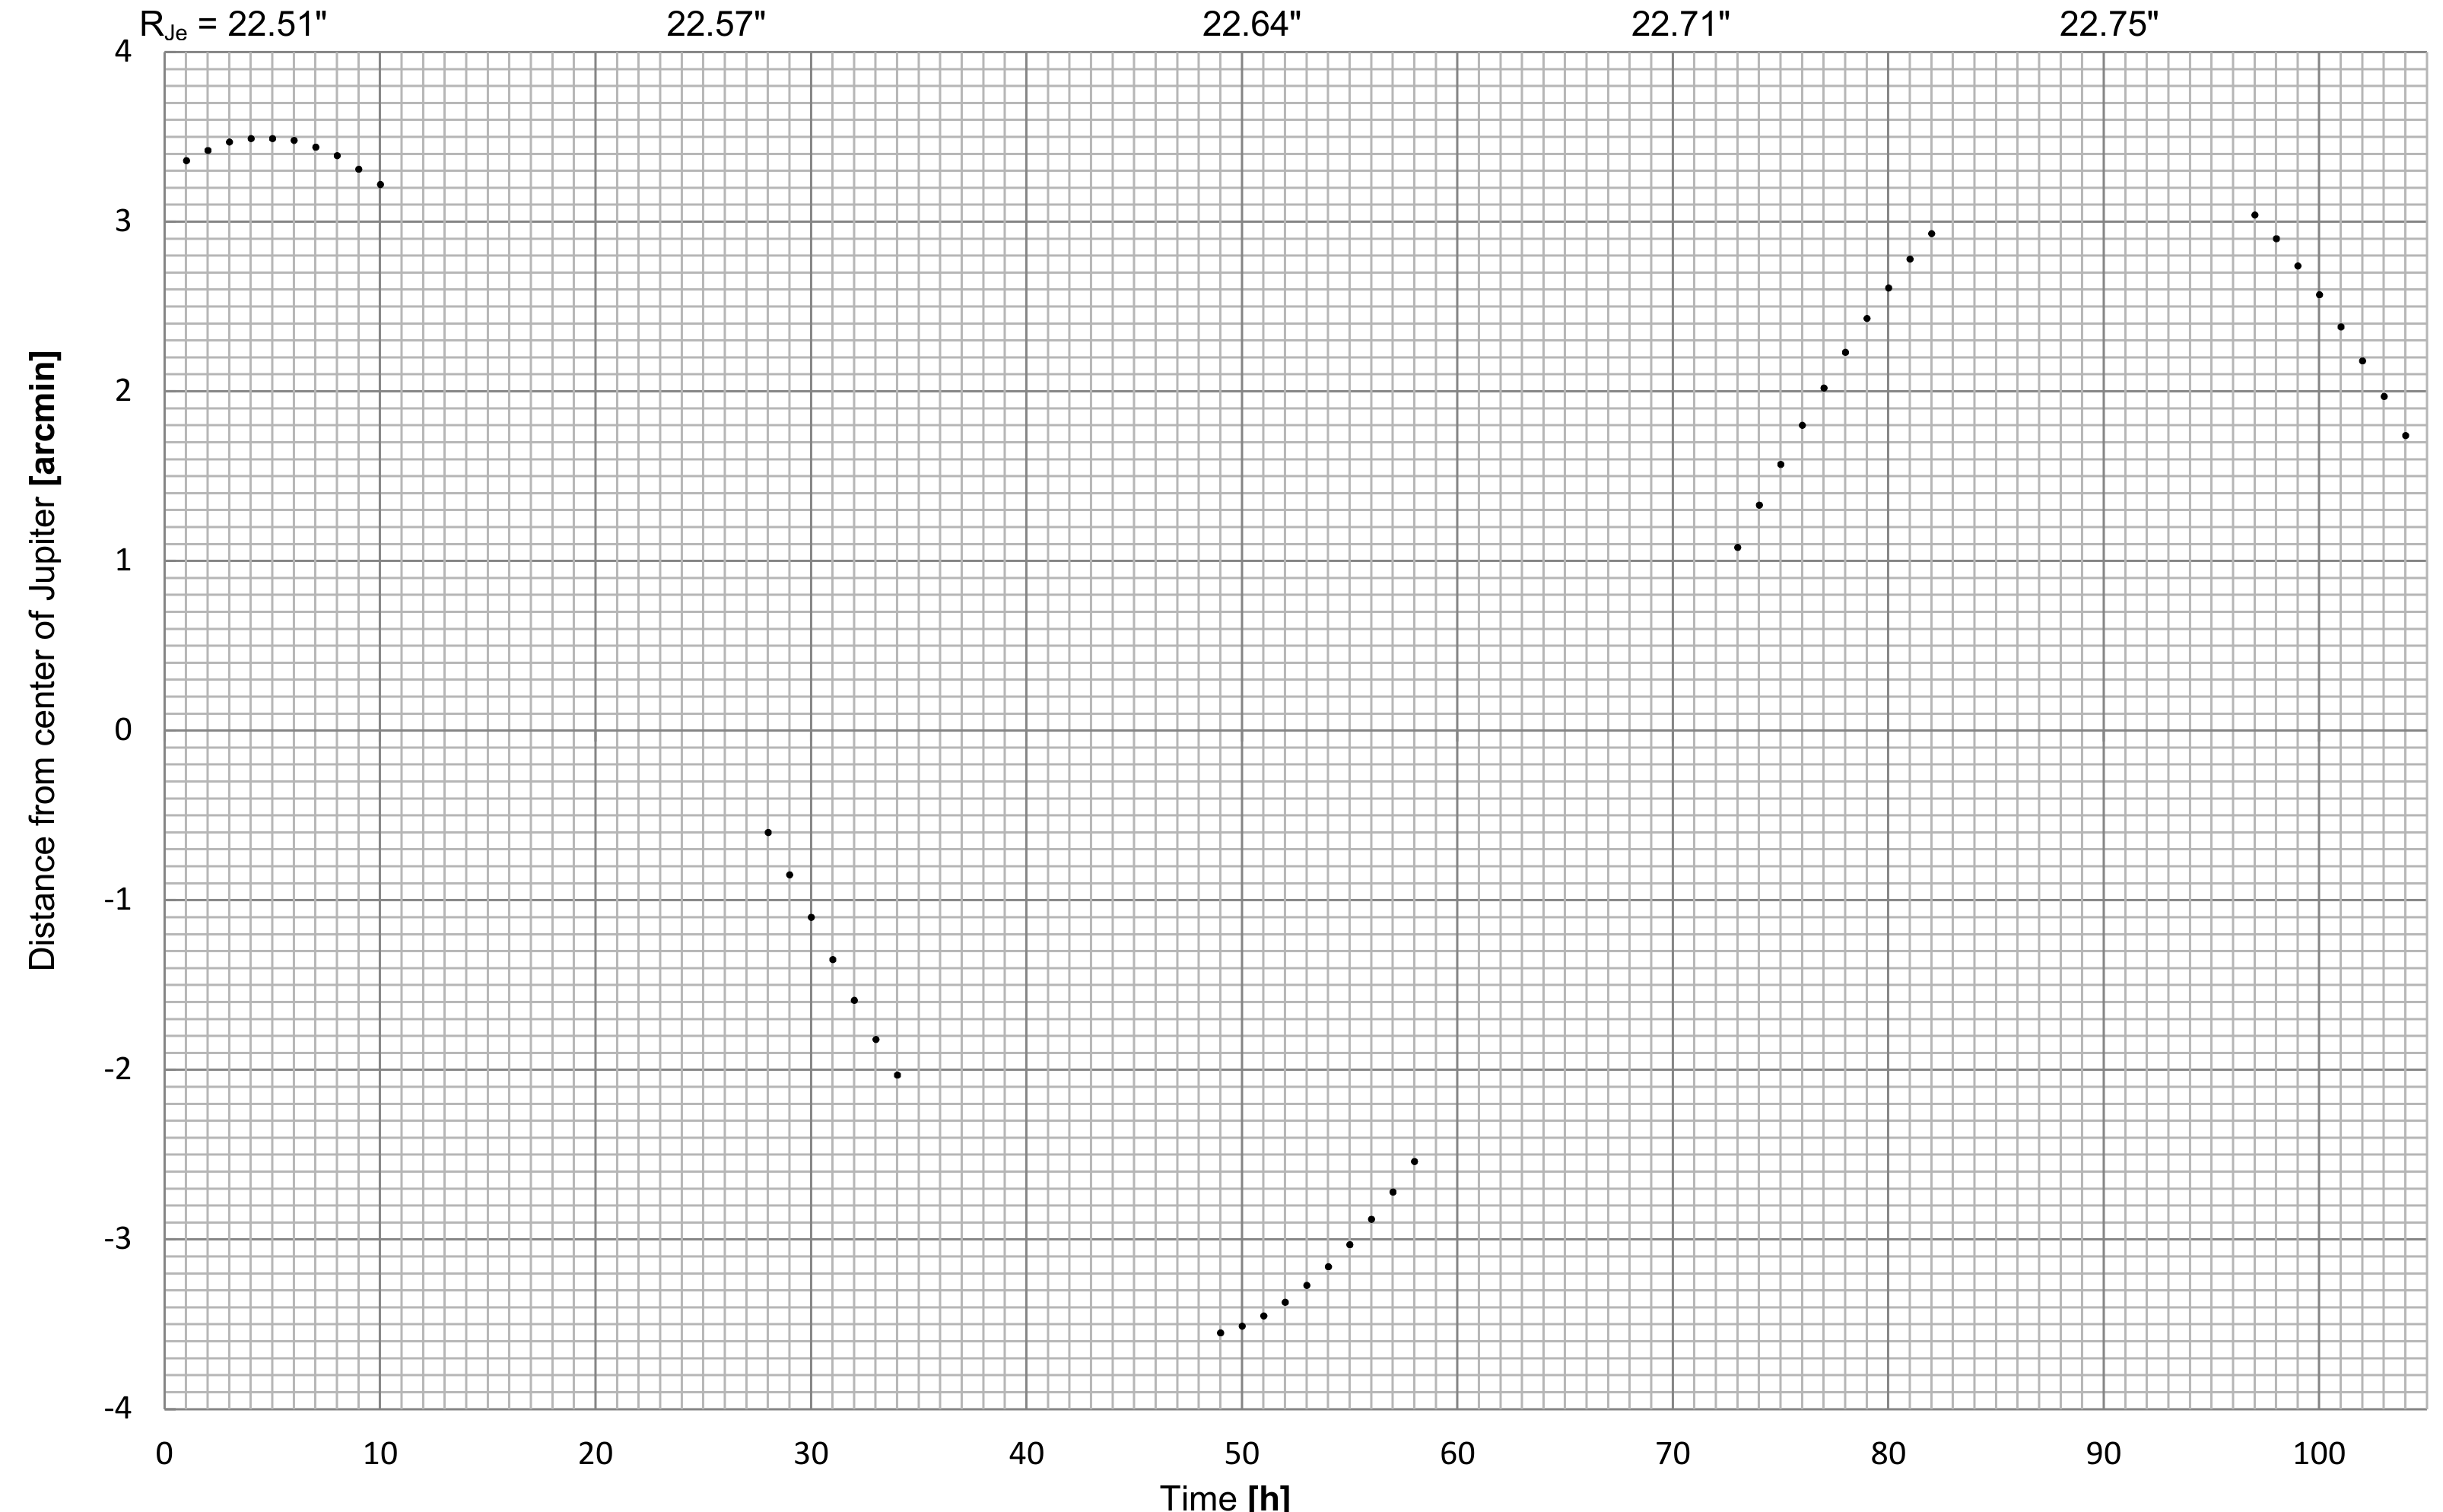
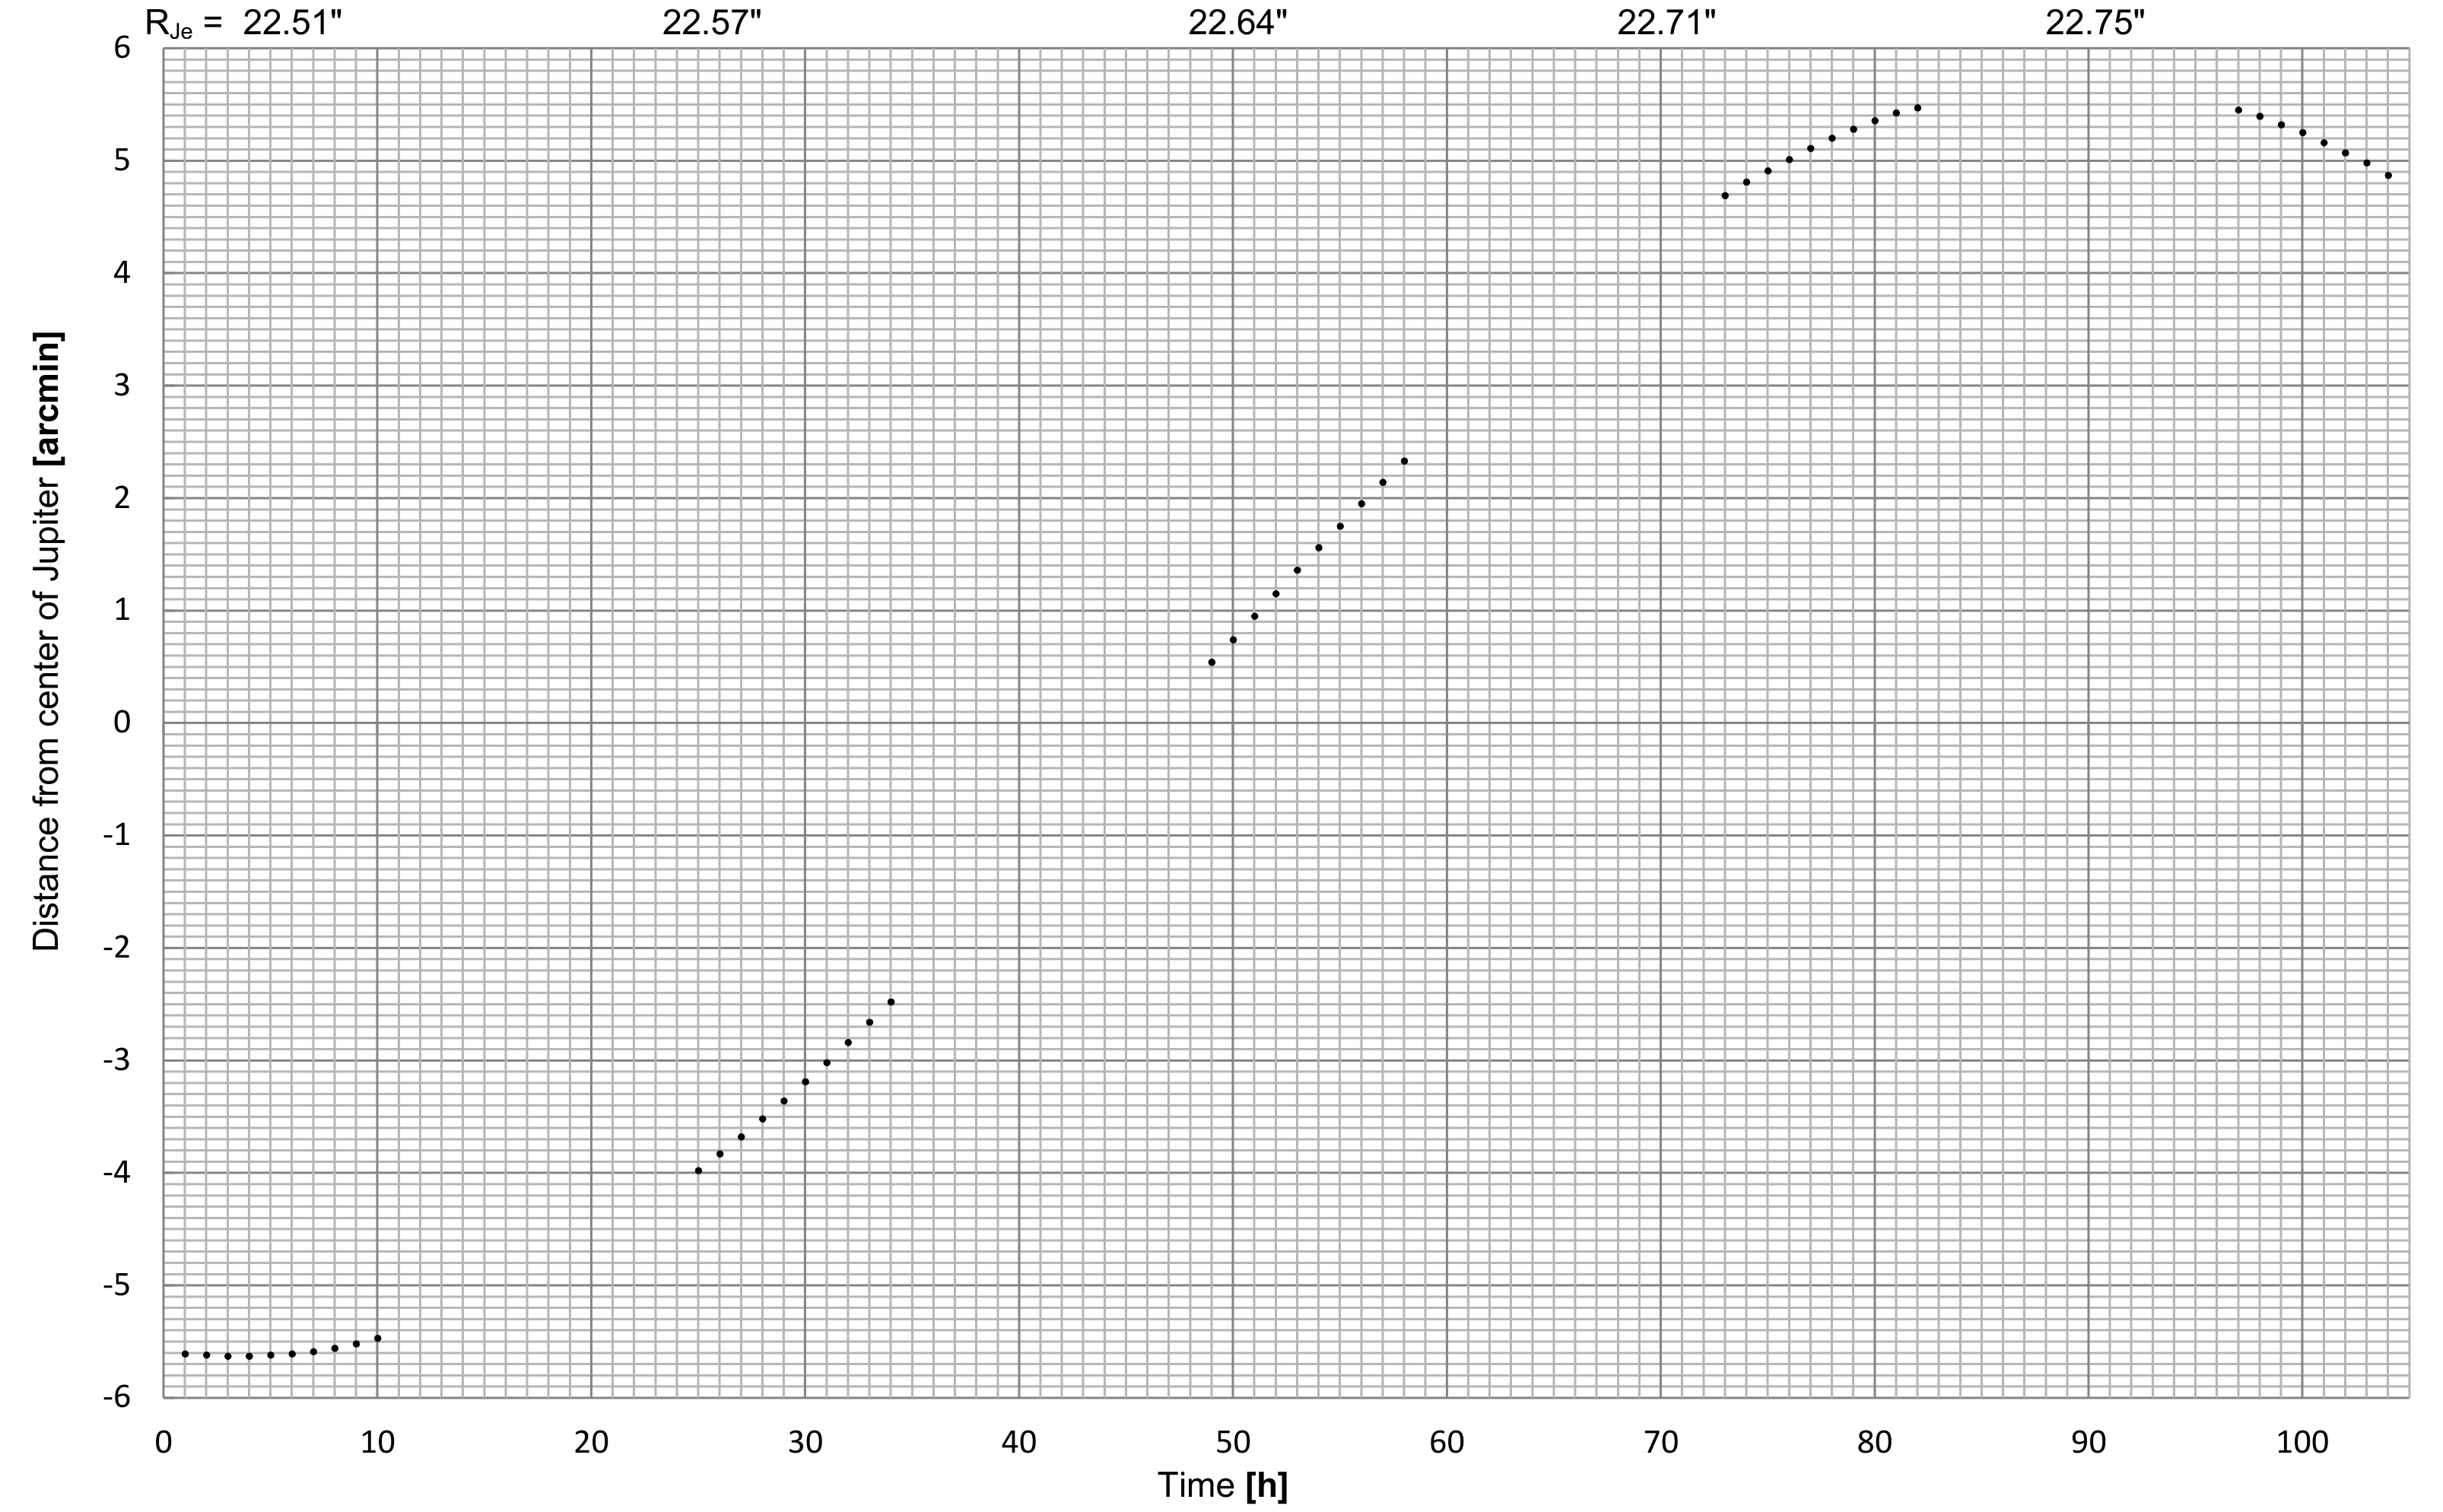
Table C
| Moon | (h) | a (m) | (kg) | |
|---|---|---|---|---|
| 1 | ||||
| 2 | ||||
| 3 |
[kg] = ______
= ______
[km] = ______
V [m³] = ______
[kg/m³] = ______
Formulae
[kg] = ______
[km] = ______
C.1. Estimate the period of revolution of each Jupiter‘s moon (), in hours.
C.2. Estimate the semimajor axis of the orbit of each Jupiter‘s moon expressed in Jupiter‘s equatorial radii () and convert it into meters ().
C.3. Use your mesurements of each moon to calculate the mass of Jupiter () independently.
C.4. Calculate the averaged value of Jupiter mass ().
C.5. From Jupiter image estimate the ratio of Jupiter‘s polar and equatorial radii ().
C.6. Calculate the mean radius of Jupiter ().
C.7. Calculate the density of Jupiter ().
Решение
Official solution tables and formulae. Part A calculations apply to group β; group α was given the same approximate rotational speed directly. Parts B and C are shared. Millimetre measurements refer to the original printed sheets, not resized screen images.
A. Rotational velocity — group β
Table A
| (nm) | dx (mm) | (nm) | (km/s) |
|---|---|---|---|
| 654.62 | ~5 | ~0.1105 | ~12.65 |
| 656.92 | ~5 | ~0.1105 | ~12.61 |
| 659.26 | ~5 | ~0.1105 | ~12.56 |
Formulae
Because of the Doppler effect the wavelength shift, , observed at the edge of Jupiter’s disk can be obtained through the following formula:
where c — speed of light in the vacuum.
Coefficient comes into effect due to the fact that:
- the sunlight, illuminating the planet, is reflected, therefore it was affected by Doppler effect twice;
- measurements are done at the edges of the disk and not relative to the non-shifted center, thus doubling the measured shift value.
B. Rotational period and equatorial radius
Table B
dt [s] = 6695
| Feature | (mm) | (mm) | (mm) | (°) |
|---|---|---|---|---|
| 1 | 66 | 33 | 92 | 66.86 |
| 2* | 57 | 46 | 92.5 | 67.86 |
| 3* | 44 | 54 | 87 | 68.75 |
Only as example — actual values depends on choosen feature and accuracy of measurements.
[h] = ~9.9
[km] = ~71470
Formulae
Source note: the table labels the period in hours and velocity in km/s; the final radius formula requires consistent time units. The supplied formula is retained without adding an unprinted conversion factor.
C. Mass and density
Table C
| Moon | (h) | a (m) | (kg) | |
|---|---|---|---|---|
| 1 | ~43 | ~5.9 | ~ | ~ |
| 2 | ~85 | ~9.4 | ~ | ~ |
| 3 | ~172 | ~14.9 | ~ | ~ |
| Quantity | Result |
|---|---|
| 174 mm / 186 mm ≈ 0.9355 | |
| (m) | ~ |
| V (m³) | ~ |
| (kg/m³) | ~1310 |
Formulae
In case of a moon orbiting a much more massive planet, the mass of the central body (planet) can be obtained from Kepler’s Third Law:
where G — gravitational constant, a — semi-major axis of moon orbit in meters, P — period in seconds.
The mean radius for a slightly oblate ellipsoid is:
Source note: the blank answer form asks for the mean radius in km, while the solution table gives it in m. Both unit labels are preserved. The formula uses the printed suffix “avr”, while the tables use “avg”.
Оригинал в Архива: pract8.pdf · официални решения: ab8sol1.png · допълнителни данни: ab8sol2.png · допълнителни данни: ab8sol3.png · допълнителни данни: alphapract8data.pdf · допълнителни данни: betapract8data.pdf · допълнителни данни: jupiter.pdf · допълнителни данни: moons.pdf · допълнителни данни: table_a.png · допълнителни данни: table_b.png · допълнителни данни: table_c.png · допълнителни данни: betapract8.pdf