iGeo 2006, Теренна работа — Задача 3. Question 3
6th International Geography Olympiad, Brisbane, Australia. Fieldwork Test · 30 юни 2006 г. · 5 т.
Fieldwork Test. Part A — Question Booklet
Friday 30 June 2.00 - 3.15pm
You may have with you stationery items, a calculator, a language dictionary, and your annotated map and notes from this morning’s fieldwork.
Answer the questions in the answer booklet provided
Fieldwork Test. Part B — Question Booklet
Saturday 1 July 9.00 - 10.30am
You may have with you stationery items, a calculator, a language dictionary, your Answer Booklet from Part A, the aerial photo distributed during the fieldwork, your annotated map and notes from this morning’s fieldwork.
Answer the questions in the answer booklet provided
(Question 1 and 2 were in Part A)
Условие
(5 marks - approximately 100 words, in point form or in sentences)
Describe the demographic pattern in your completed age-sex pyramid from Question 2.
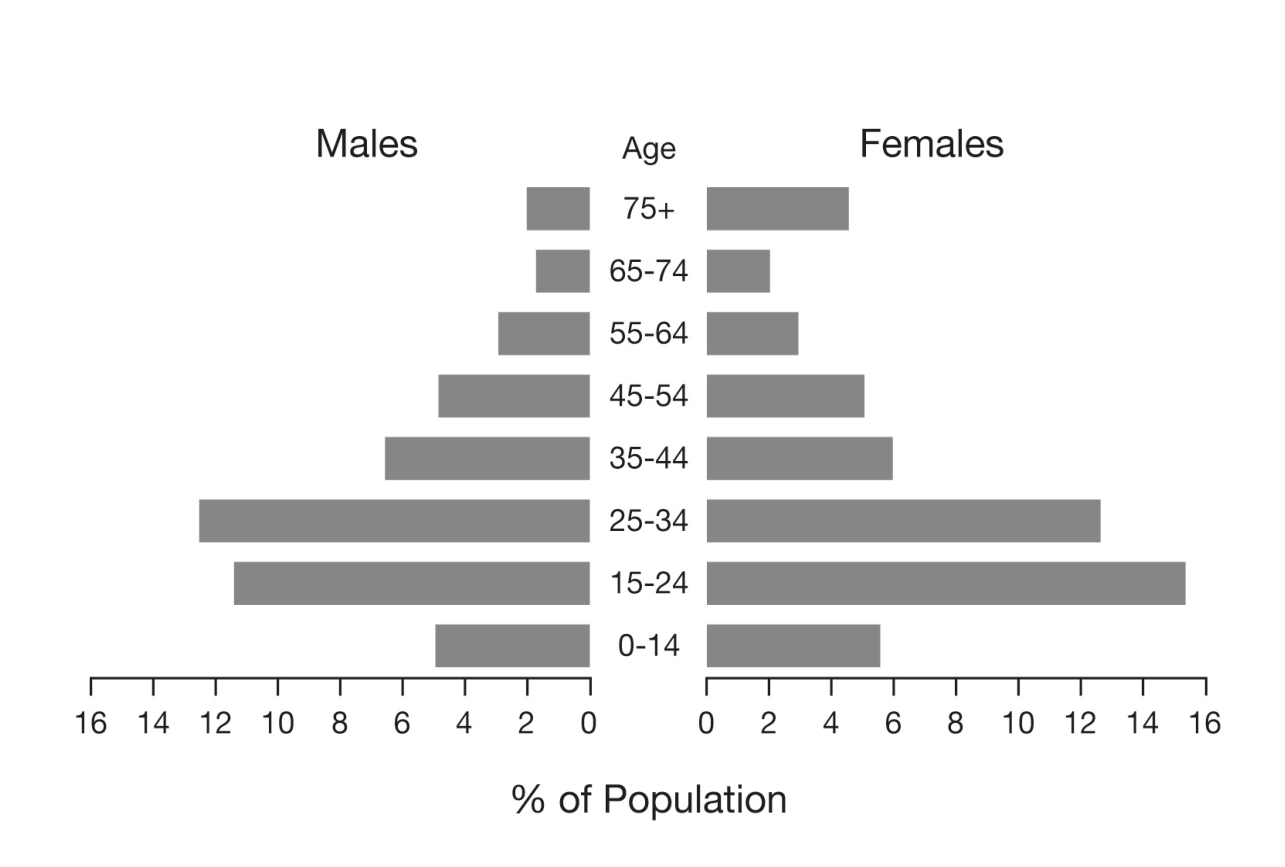
Describe the similarities and differences between the forecast population for Kelvin Grove Urban Village (in your pyramid) and the current population of the suburb of Kelvin Grove, as shown in Figure 1.
Решение
Question Three - Population Pyramid Analysis - 5 Marks
PART A - Description of significant age and gender distribution groups (2010) - 2 marks
Any 4 valid points for 2 marks
Sample points
- Higher % of females in each age group
- Majority of people are expected to be in the 15 to 34 age groups (i.e. 15 to 24 group and 25 to 34 group)
- Low % of people more than 65 years (older age groups), e.g. 65 - 74 ( 4.1 %), 75 + (2.3%)
- Second largest age groups expected to be 35 - 44 years and 45 - 54 year group (i.e. 14.6% and 15.2%)
- Small % of people expected in the 55 - 64 years group (10.7%)
- Smallest % of people are expected in the 0 - 14 years group (9.4%)
PART B - similarities and the differences between the forecast population for Kelvin Grove Urban Village and the current population of Kelvin Grove suburb - 3 marks
Students MUST have a minimum of three valid points highlighting the similarities and a minimum of three valid points showing the differences between the data to obtain a total of 3 marks.
SIMILARITIES (Examples) - 1½ marks
- Both have females as the highest % in each age group
- The % in the 0 - 14 age group is much the same for both pyramids
- Like the 2010 pyramid, the 2001 pyramid had the greatest % in the 15 - 34 age group
DIFFERENCES (Examples) - 1½ marks
- The 2001 pyramid shows a greater % in the 75+ year age group, especially the % of females
- The 2001 pyramid shows a greater % in the 15 - 24 age group and the 25 - 34 age group for both males and females
- The 2001 pyramid has a lower % in the 35 - 64 age group
Оригинал в Архива: 2006FWtest.pdf · официални решения: 2006FWmarkingscheme.pdf