iGeo 2014, Писмен тест — B. Section B · Forest Resources
11th International Geography Olympiad · Written Response Test · 12 август 2014 г. · 15 т.
Внимание: Бележка към темата
The original resource PDF omits the D2 boat-school photograph and explicitly withholds the E3 malaria map from public display; the official key supplies no E3 answer. Literal native table, wording, examiner/report label and exemplar/key disagreements are retained in their attributed source scopes.
Instructions for the Students
Instructions for the Students
Fill in your name, team and iGeo student number on the front page of this Question and Answer Booklet.
Fill in your iGeo student number in the boxes on top of the pages in this Booklet.
This test consists of 6 Sections.
The maximum total mark is 90. The mark for each question is given in the margin at the beginning of the question. There are a maximum of 15 marks for each Section.
Answer all questions in the spaces provided in this Booklet.
Check the backs of pages as questions are printed on both sides of a page.
Give only the required number of answers (reasons, examples, etc.). For instance, if the question asks for 2 reasons and you give more than 2, only the first 2 reasons will be marked.
The Resource Booklet contains Sources referred to in this Booklet.
You may use a calculator during the test.
Time: 180 minutes for students not educated in English,
150 minutes for students educated in English.
- Students not educated in English are allowed to use bilingual dictionaries during the test.
Good luck!
Instructions for the Markers
Instructions for the Markers
Check if the iGeo Student Numbers are on each sheet before dividing up the paper.
This test consists of 6 Sections.
One whole Section per marker and double-checker.
Check whether the answer continues outside the designated area. No credits will be given to answers in the Resource Booklet.
The maximum total mark is 90. The mark for each question is given at the beginning of the question. There are a maximum of 15 marks for each Section.
Get the hang of the full range of answers by reading through a few papers with your co-marker before you start your marking.
These answers are not exhaustive. Credit any relevant answer.
Mark only the required number of answers (reasons, examples, etc.). For instance, if the question asks for 2 reasons and there is more than 2, only the first 2 reasons should be marked.
Put your mark next to the question number in the column on the left – it eases the work of the person who has to put the numbers into MS Excel. Total the marks by the title of the Section.
The Moderators (Sue and Anu) will sample the marking of all teams.
Условие
Section B: Forest Resources. Maximum 15 marks.
Question 1 (2 т.)
1 Explain how people can benefit from forests (other than wood as a raw material). [2 т.]
Question 2 (3 т.)
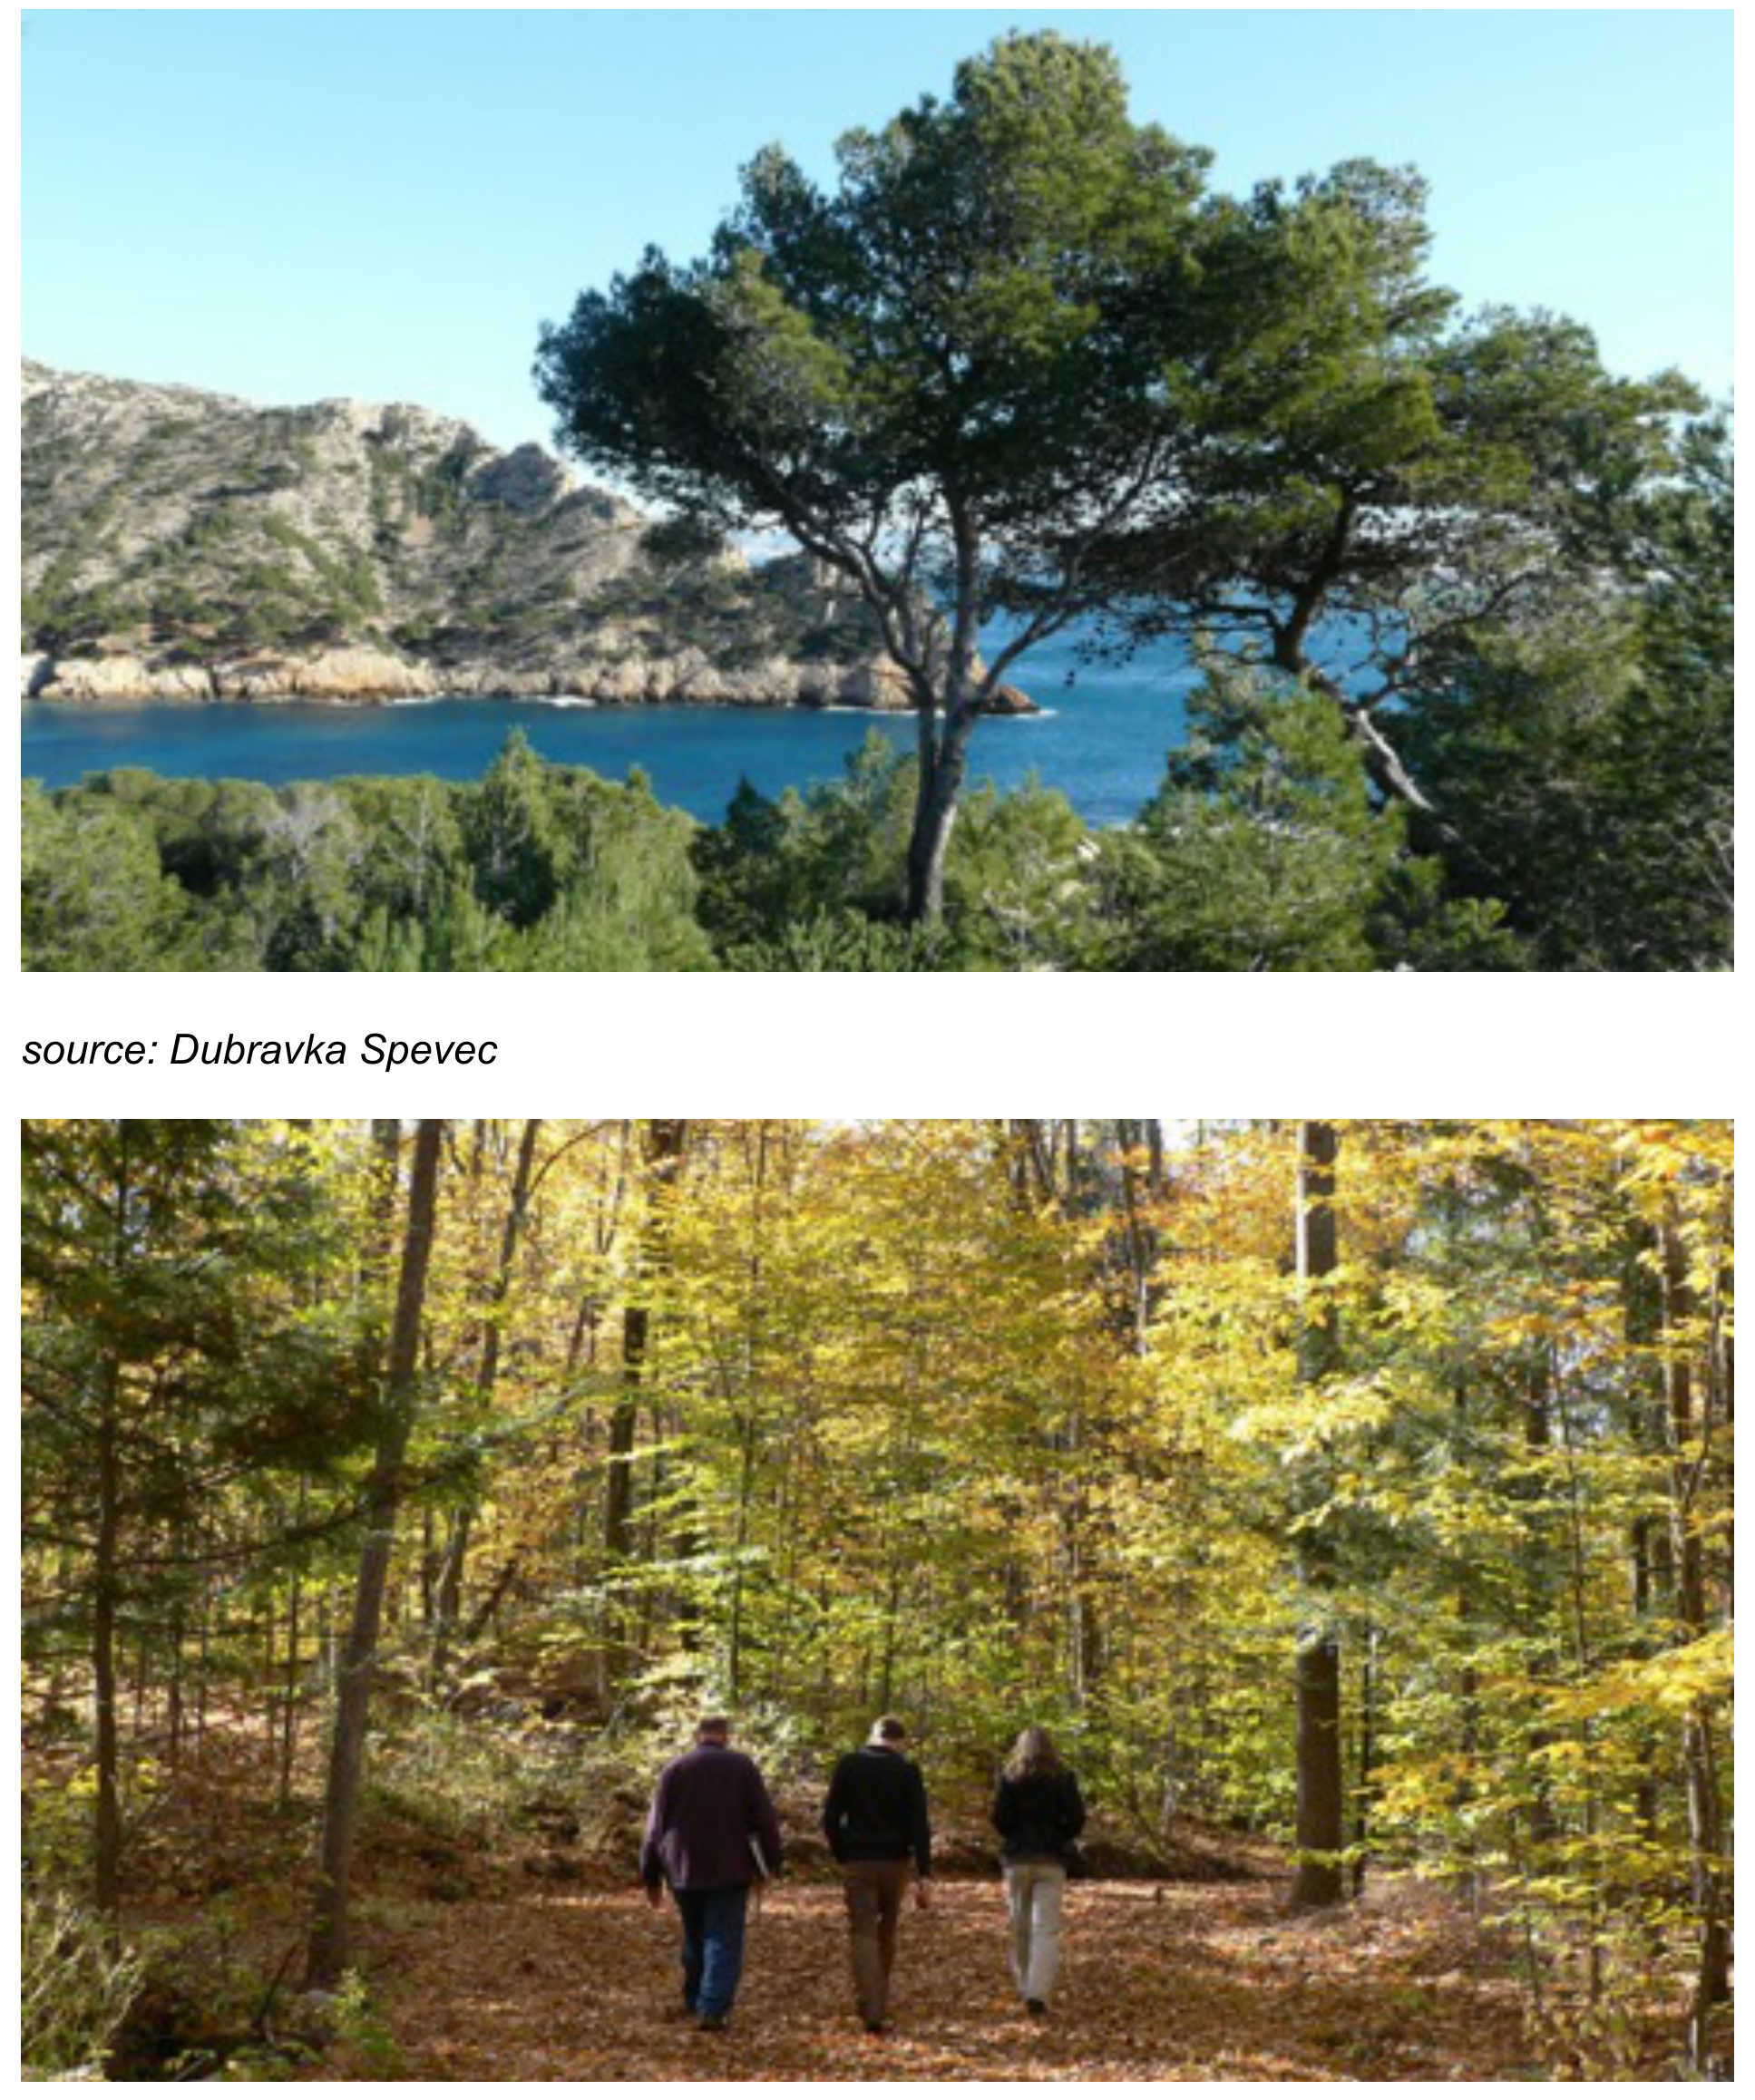
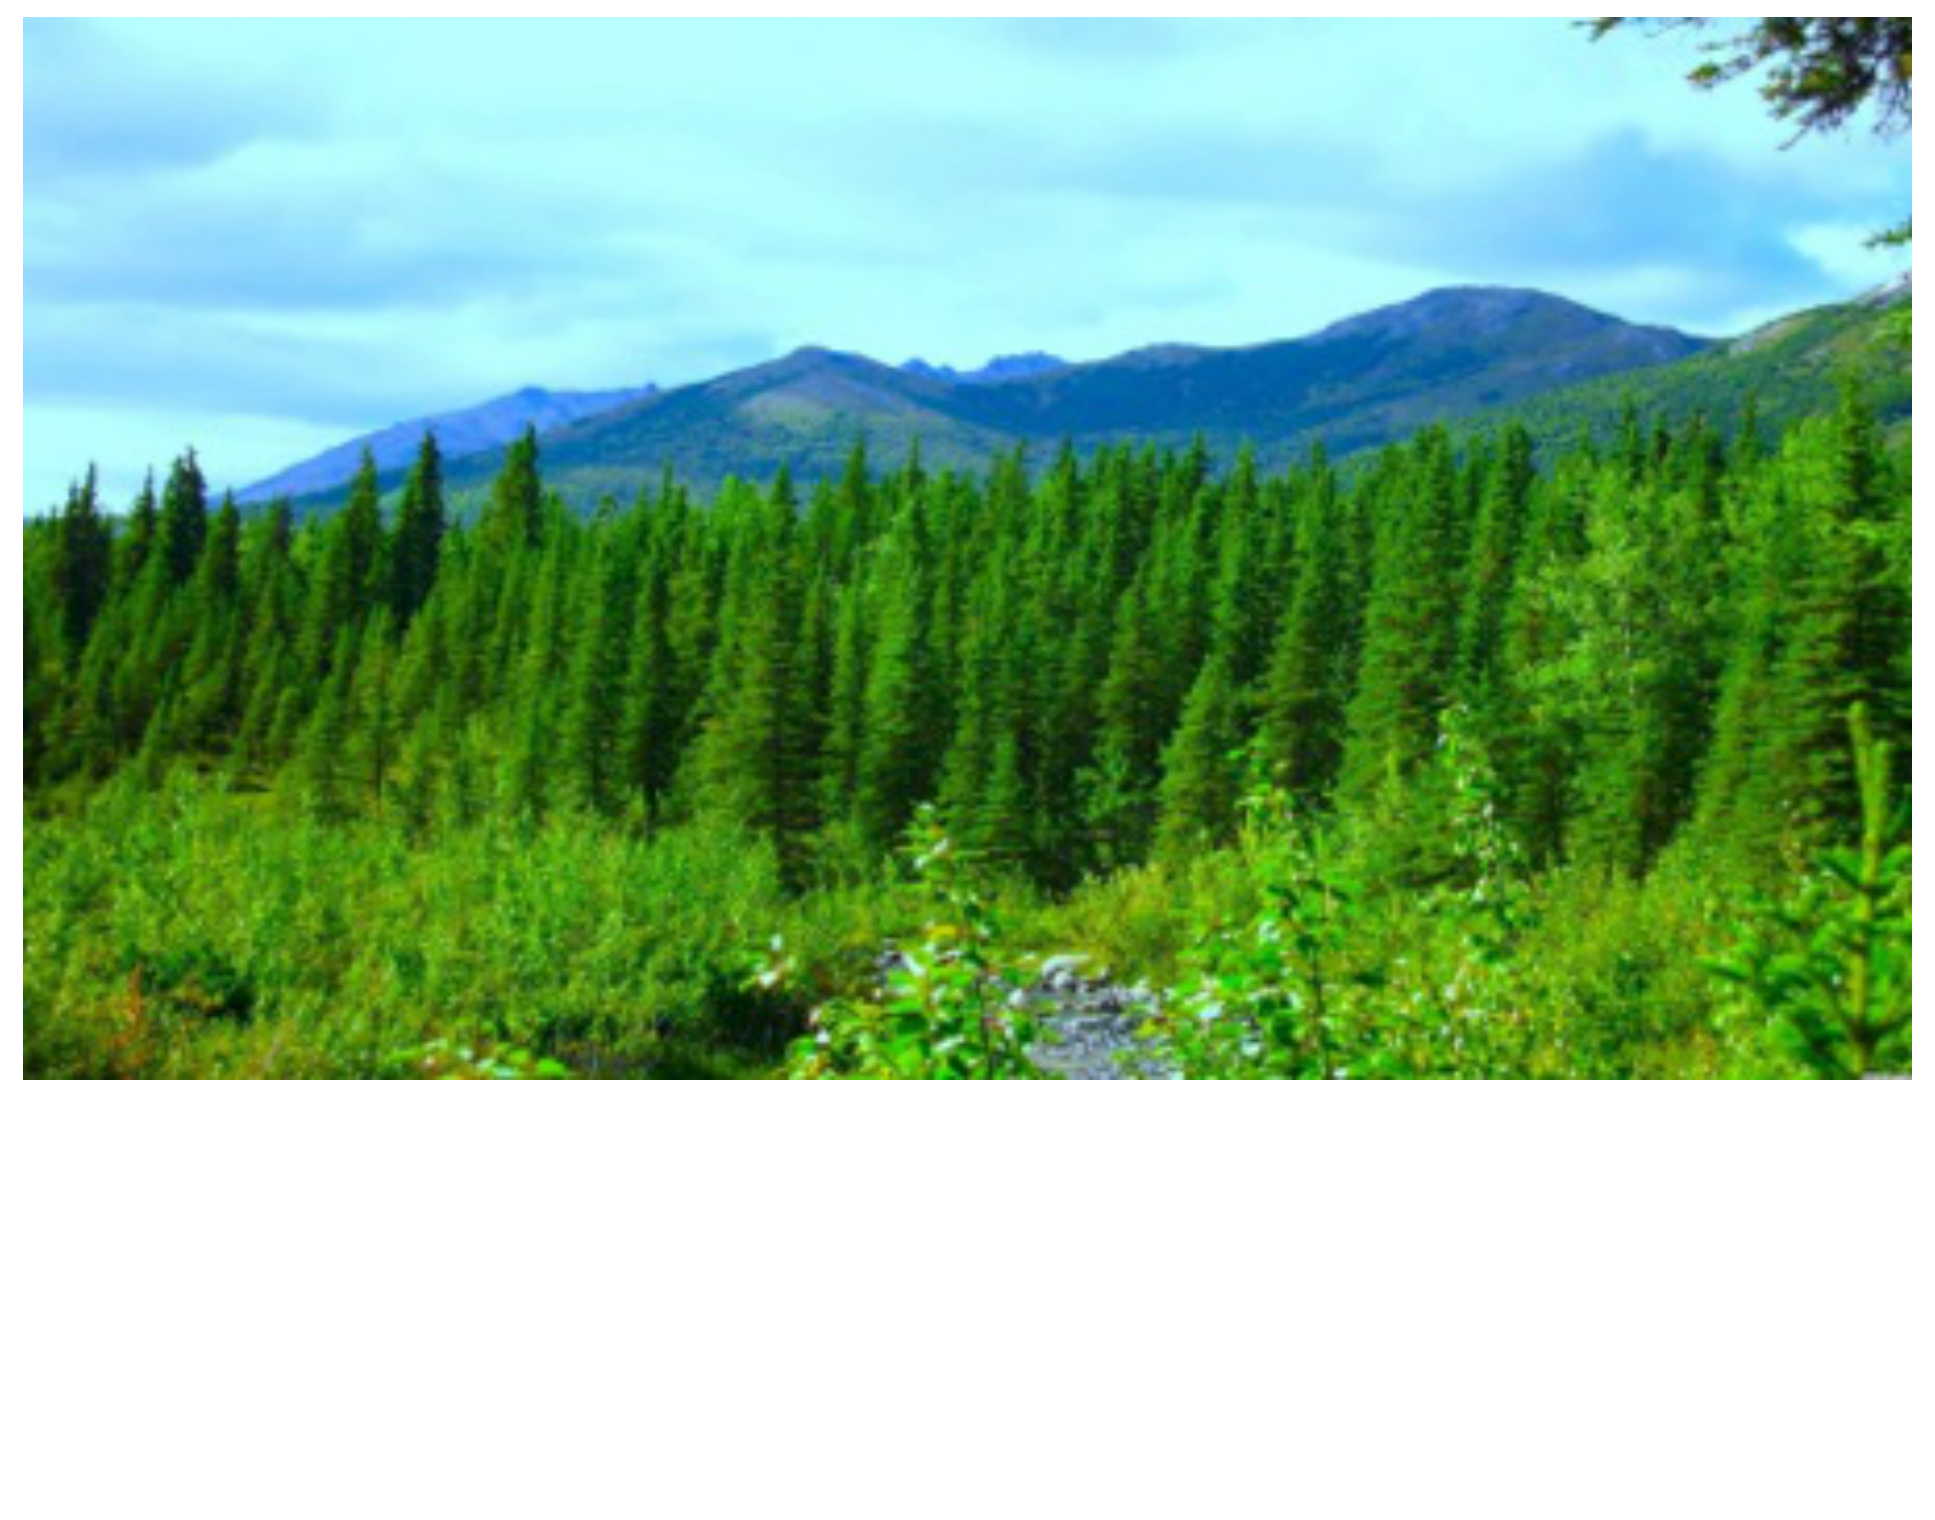
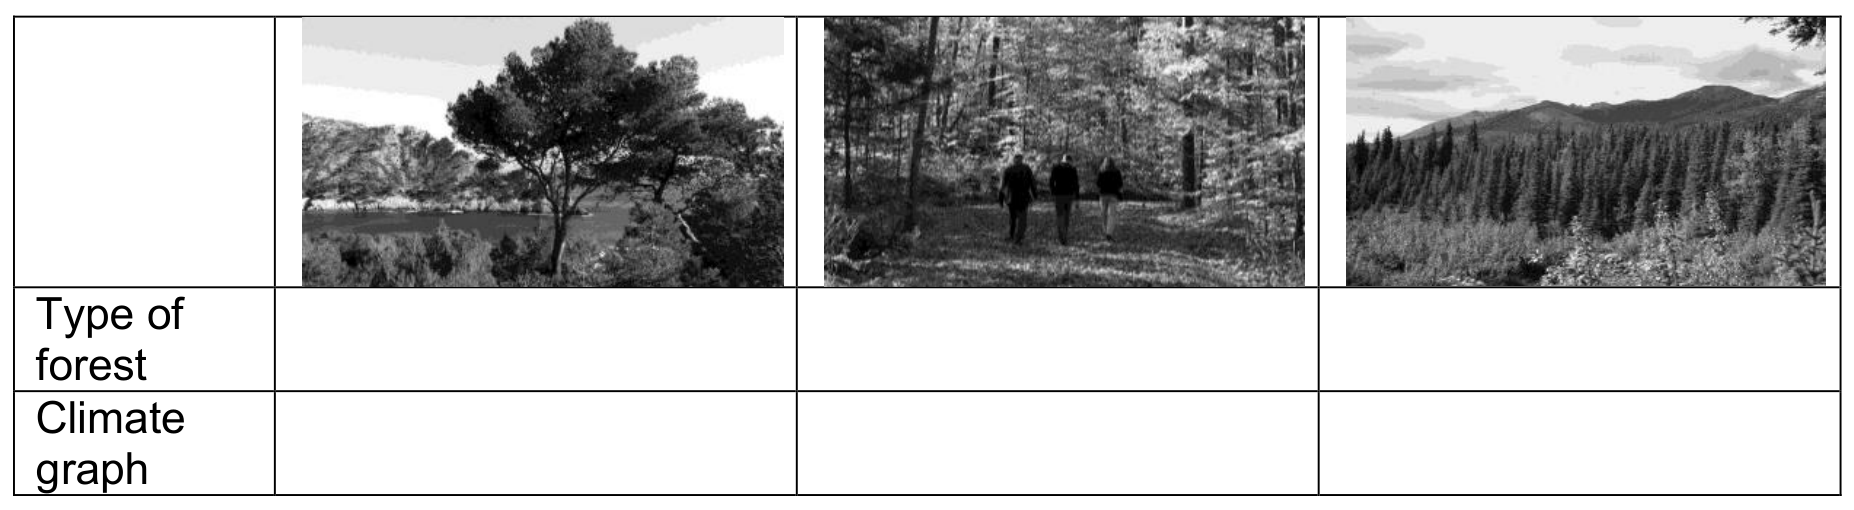
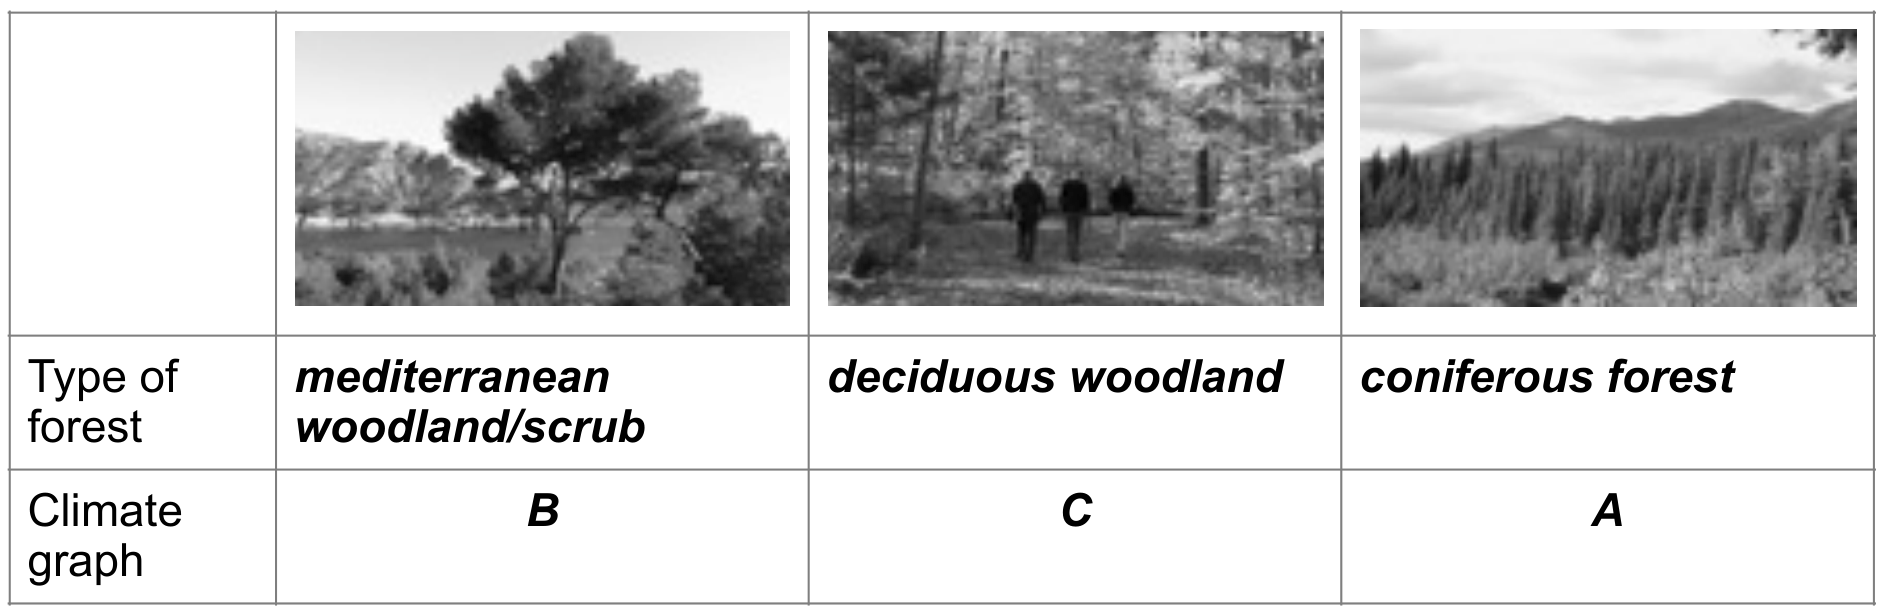
Study Resource Booklet Figures B1: Three types of forest. Fill in the table:
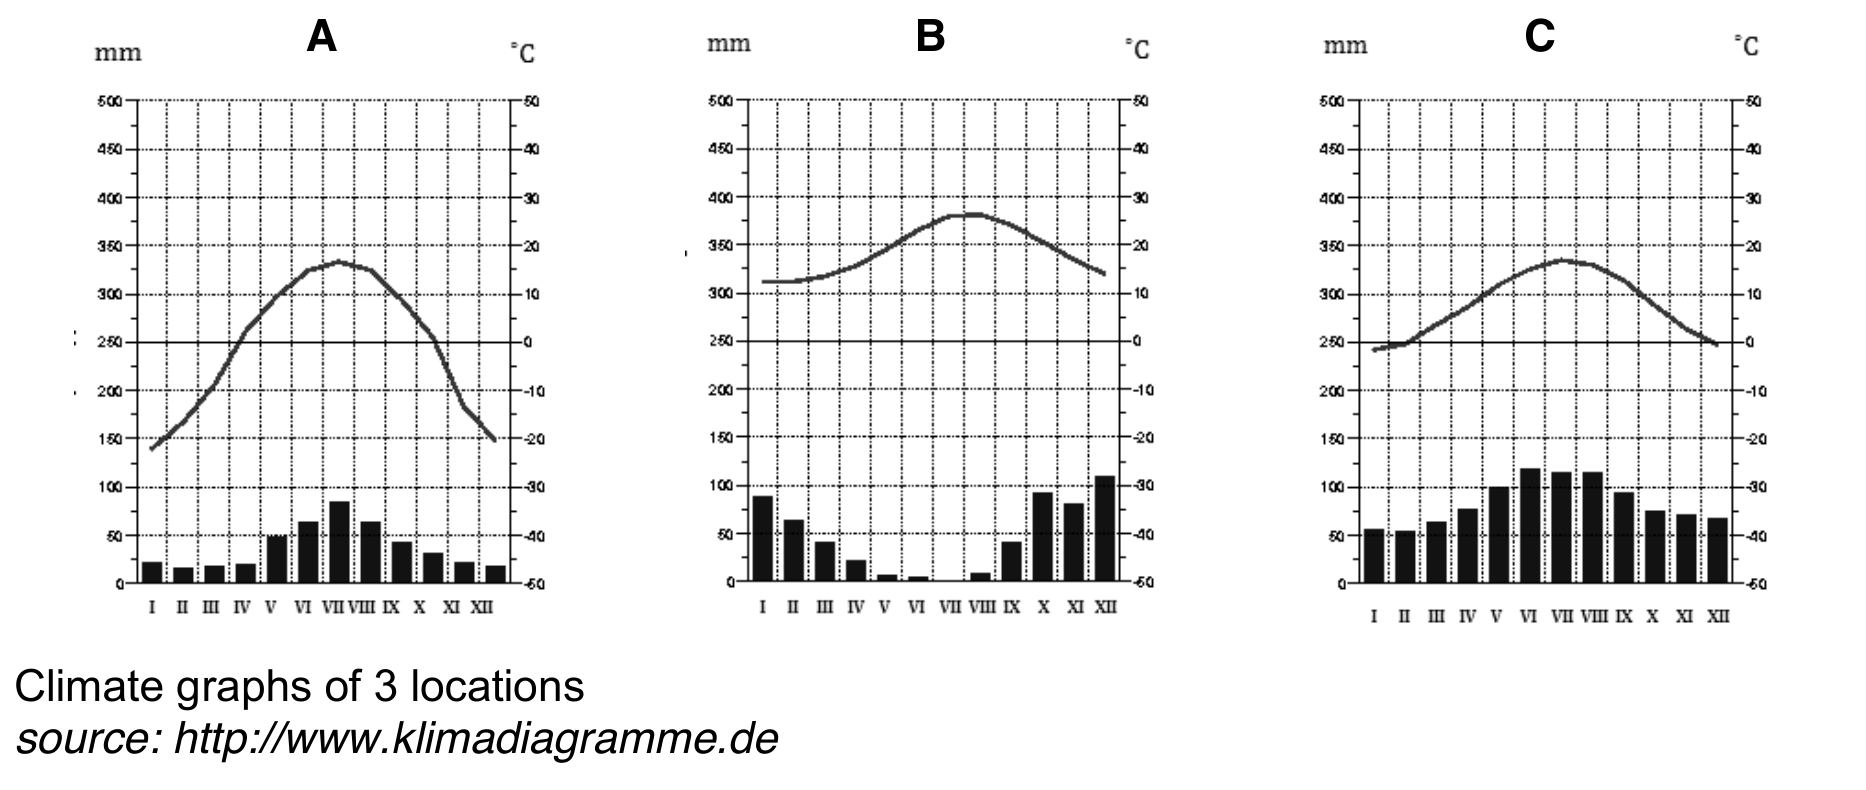
Climate graphs of 3 locations. Source: http://www.klimadiagramme.de
a Name the types of forest;
b Match each type of forest to the climate graph (A, B and C).
Question 3 (2 т.)
3 Study Resource Booklet Figure B2: Global forest ecosystem change, 2005. Name the 2 main types of forest in which there is a net loss.
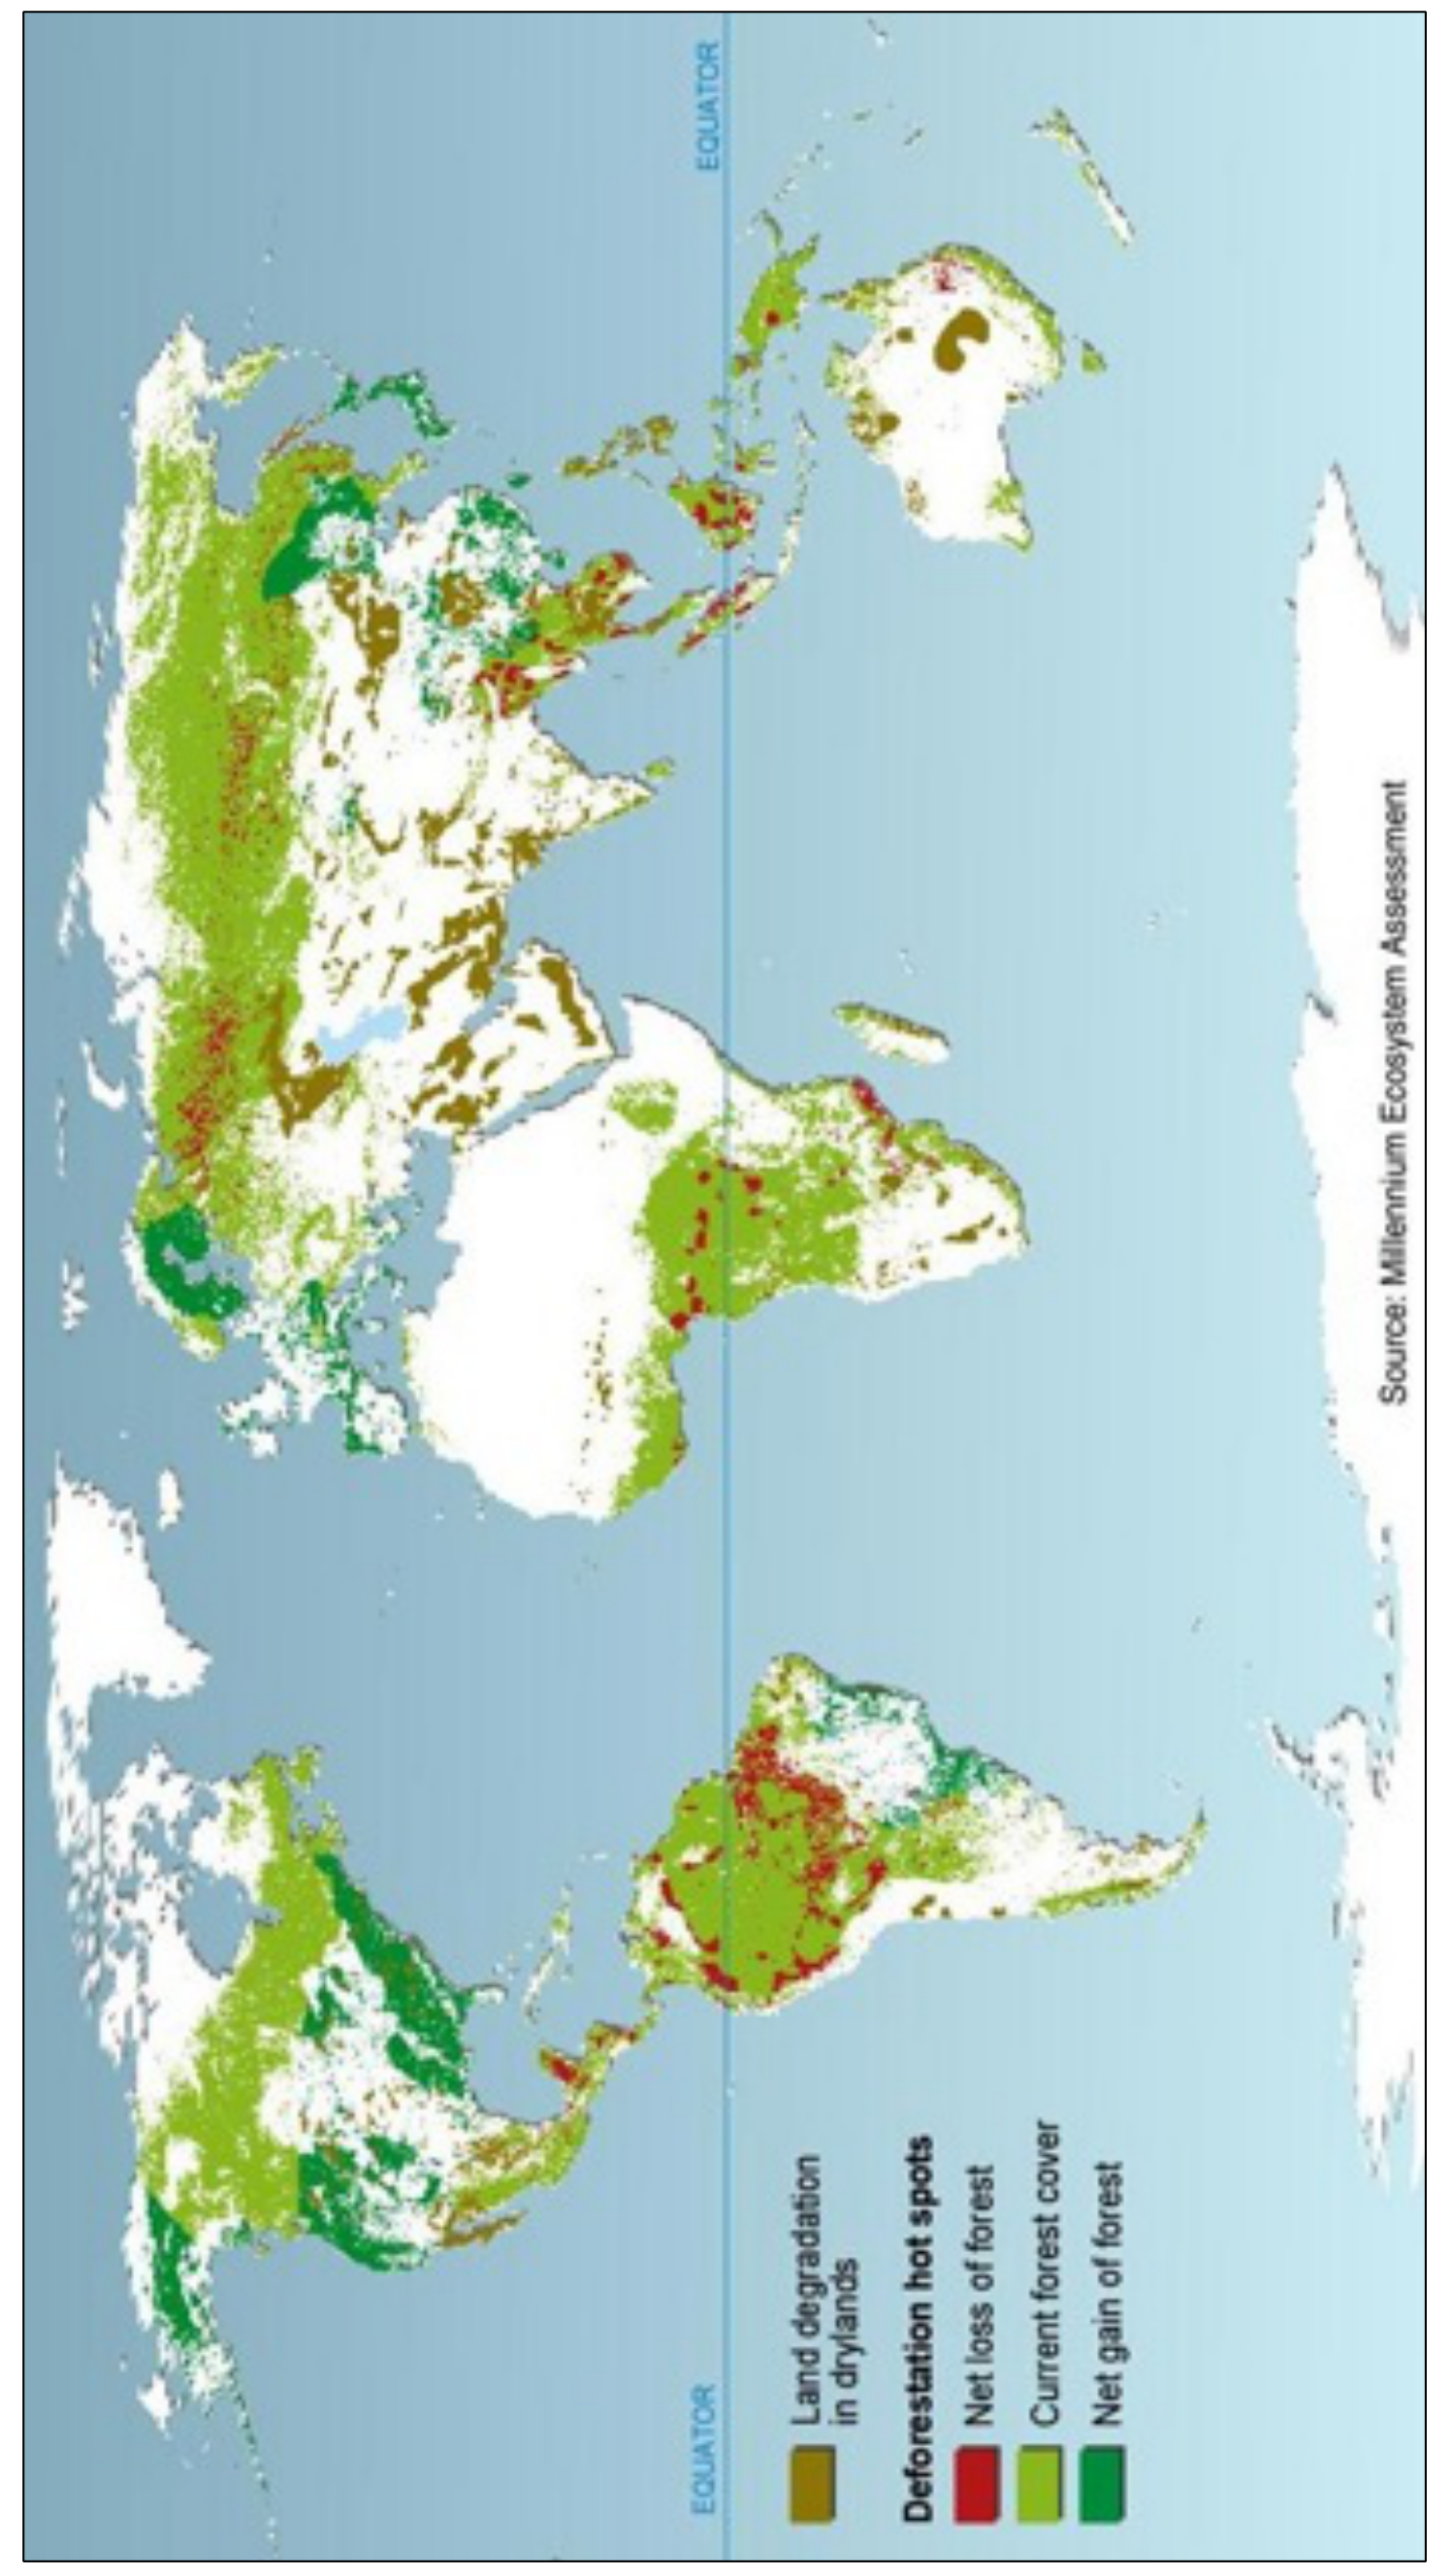
Type 1: ______
Type 2: ______ [2 т.]
Question 4 (3 т.)
4 Give 3 reasons for the loss of forest worldwide.
Reason 1: ______
Reason 2: ______
Reason 3: ______
This Section continues on the next page. [3 т.]
Question 5 (5 т.)
Study Table B1 below: World forest cover in 2010 by geographical regions (source: FAO, 2013).
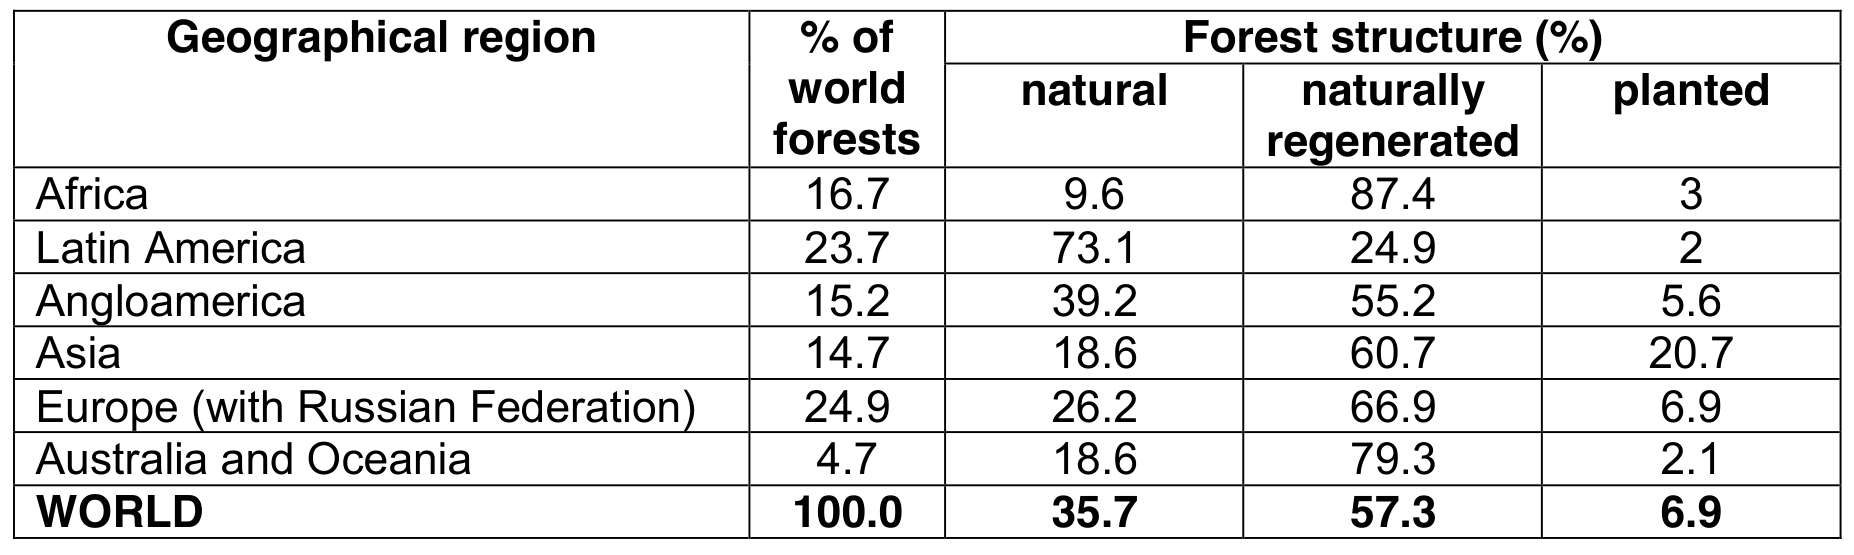
| Geographical region | % of world forests | Forest structure (%) — natural | naturally regenerated | planted |
|---|---|---|---|---|
| Africa | 16.7 | 9.6 | 87.4 | 3 |
| Latin America | 23.7 | 73.1 | 24.9 | 2 |
| Angloamerica | 15.2 | 39.2 | 55.2 | 5.6 |
| Asia | 14.7 | 18.6 | 60.7 | 20.7 |
| Europe (with Russian Federation) | 24.9 | 26.2 | 66.9 | 6.9 |
| Australia and Oceania | 4.7 | 18.6 | 79.3 | 2.1 |
| WORLD | 100.0 | 35.7 | 57.3 | 6.9 |
a Which geographical region has the largest percentage of forest that has been reforested? Outline 2 reasons for your choice.
Region: ______
Reason 1: ______
Reason 2: ______
b Which geographical region has the smallest percentage of forest that has been reforested? Outline 2 reasons for your choice.
Region: ______
Reason 1: ______
Reason 2: ______
The native booklet prints page10 “This page is intentionally blank”.
Решение
Official Marking Scheme · Section B.
Question 1 (2 т.)
One well developed answer (with explanation) or two shorter answers. Answers can be anything material or abstract: photosynthesis by producing oxygen and consuming carbon dioxide, regulation of greenhouse effect, purification of air, preventing of (soil) erosion, hydrological cycle (transpiration) and freshwater accessibility/availability, food (berries, mushrooms, animals), forests as research area/ object, amenity and leisure values, hiking etc. spiritual resource.
Question 2 (3 т.)
mediterranean woodland/scrub — climate graph B; deciduous woodland — climate graph C; coniferous forest — climate graph A.
Question 3 (2 т.)
Type 1: Tropical forest/Equatorial forest (rain forest is acceptable)
Type 2: Coniferous forest
Question 4 (3 т.)
Answer: 3m New land for agriculture. New building area for growing population. New area for transportation infrastructure (roads etc.). New areas for leisure and tourism expansion (golf courses, entertainment resorts etc.). Mining (the rock under forest contains minerals or ores). Wood for industry (paper, pulp, furniture). Wood for energy and/or households (burning wood). Acid rain Forest fire (humanly induced)
Question 5 (5 т.)
a) 0.5m – Asia/Africa (the most), Reasons: 2m – in Asia due to raised ecological awareness, the level of economic development, state measures for forest conservation and reforestation - due to higher temperature and humidity (unless soil erosion occurs) forests are being naturally regenerated
b) 0.5m – Latin America (the least) Reasons: 2m – in Latin America due to less developed ecological awareness, larger forest exploitation by transnational corporations, state plans for reforestation are at minimum level - less forest exploitation by foreign companies in Africa (cutting down trees and transport of wood is much more difficult/expensive than in e.g. Latin America)
Committee Report · Appendix 1
Committee Report, October 2014 — Appendix 1. This section contains some examples of good answers with comments from the marking teams in speech bubbles. All the exemplar answers are taken from scripts of students who are not educated in English. These source-attributed exemplars retain their native wording, numbering, marks and disagreements with the Marking Scheme.
Committee Report exemplar · B1, scored2/2; complete answer and examiner bubble.
Source-attributed student answer and marking-team comment:
- Explain how people can benefit from forests (other than wood as a raw material). People can use them as recreational areas which benefits their health, both physical and mental. Many forests are also important tourist attractions which brings money to the local community. Moreover, some cattle species may live and feed in forests so agricultural workers don’t have to provide food for them. Also, hunting is still popular in some areas. Finally, forests consume vast amounts of CO2, reducing the greenhouse effect and global warming.
Here the student gives an example and then follows it up with a justification. There is more than enough for full marks 2/2
Committee Report exemplar · B4, scored3/3; all three student reasons and complete examiner bubble.
Source-attributed student answer and marking-team comment:
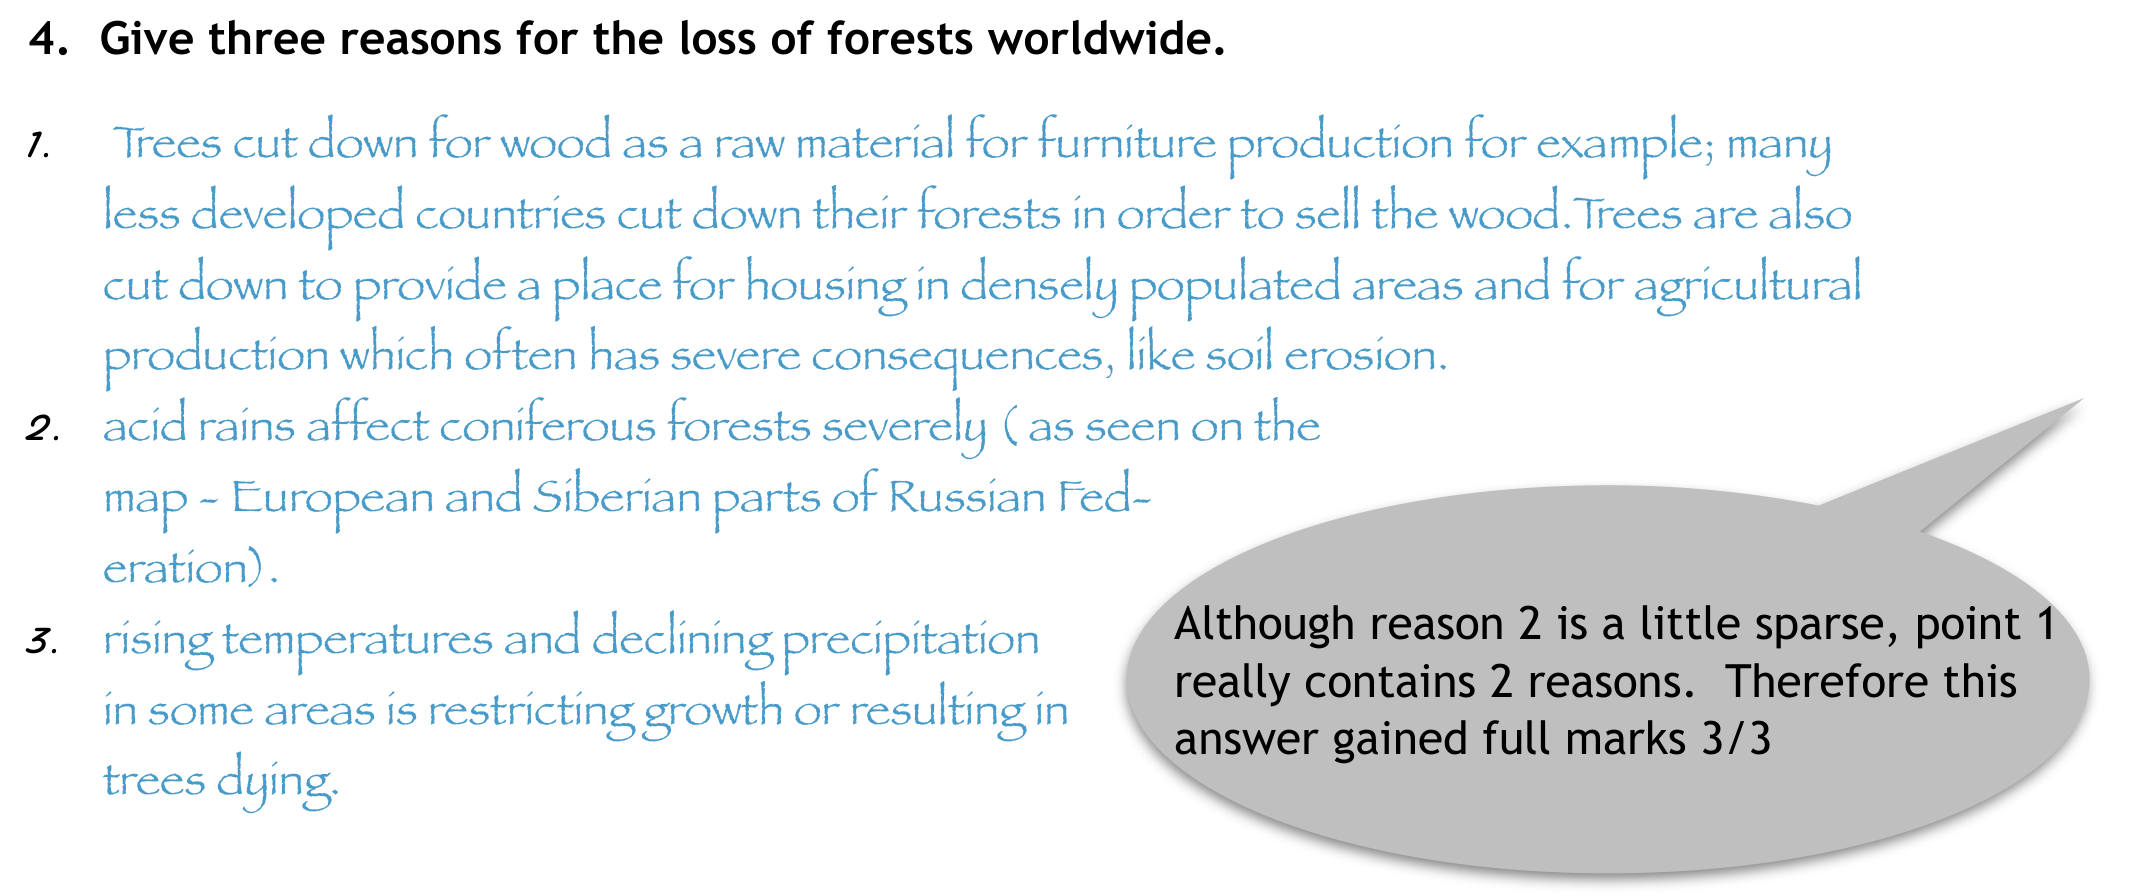
- Give three reasons for the loss of forests worldwide.
- Trees cut down for wood as a raw material for furniture production for example; many less developed countries cut down their forests in order to sell the wood.Trees are also cut down to provide a place for housing in densely populated areas and for agricultural production which often has severe consequences, like soil erosion.
- acid rains affect coniferous forests severely ( as seen on the map - European and Siberian parts of Russian Federation).
- rising temperatures and declining precipitation in some areas is restricting growth or resulting in trees dying.
Although reason 2 is a little sparse, point 1 really contains 2 reasons. Therefore this answer gained full marks 3/3
Committee Report · October 2014 · General report
Geography Olympiad 2014 - Krakow
Written Response Test Report
Student Performance
•
Overall the paper was accessible by all students. The total marks were out of 90
with the lowest score being 14 marks (compared to 9 marks in 2013) and the highest score reaching 70 marks (75.5 marks in 2013). The median mark was 47 out of
90 (43 in 2013). Overall this was a higher scoring paper than last year’s WRT.
•
The highest scoring section overall was Section F (Globalisation and Transnational
Corporations) where the median mark was 11 out of 15.
•
Section A (Geology and Coastal Landforms) was the only section where a student
achieved full marks (15)
•
The lowest scoring section was Section C ( Global Ecological Footprint) where the
median mark was 8 out of 15.
•
Section A had several students who did not score at all and Section C and E each
had 2 students who didn’t score at all. However, Section A was also where the
highest mark was achieved.
General Comments
•
The writing committee has continued to make a conscious effort to ask more
‘open’ questions which we hoped would encourage students to write in more extended prose.
•
Questions were structured so that generally, the easier more closed questions came
at the beginning of each section using command words such as identify, outline,
describe, name, and what?
•
The more open, challenging questions came towards the end using command words
such as explain, suggest, comment on and justify.
•
As in previous years, the team also tried to produce sections that integrated physical and human geography topics.
•
We always try to provide a variety of data representation/visualisation (eg. maps,
graphs, tables, etc.) to reflect the range of sources that geographers work with.
•
We also tried to introduce some more modern topics e.g. geography of health; the
solar powered boat schools and the recent expansion of globalisation.
•
Some questions were very poorly answered by students:
o
In question C7 students were asked to comment on the differences between
the data shown in the table for Africa and Oceania. 87 students did not
score on this part.
o
QuestionA4 asked students to draw a series of diagrams to show the formation of a delta. 58 students did not score on this part.62 students were unable to give a reasonable definition of globalisation in question F1.
• However, other questions were more competently answered:
o
Question B2 asked about afforestation and only 8 students were unable to
gain a mark here.
o
Section F2 asked students to give factors influencing the process of globalisation and only 21 students did not score on this section.
o
It was pleasing to see that more than half the students could explain the
impacts of El Nino in Section D2.
Command words
•
There seemed to be fewer instances where students misinterpreted the command
words. This may have been because again time was given for students who are not
educated in English to read and digest the command words before the test starts.
•
The writing committee does not see this should be a particular problem for non-
English speakers.
Marking
Again, I am grateful to everyone who marked the WRT this year and especially to Anu
Printsmann and Dubravka Spevec whose academic backgrounds and meticulous approach contributed to a robust marking process.
Consistency and quality assurance is achieved by teams of two markers marking all the
scripts of the students for one section. The provisional mark scheme was prepared by
the writing team before the test took place. This was adjusted if necessary, by the
paid of geography specialist markers and the moderators (Anu and Sue) after a sample
of 30 papers had been marked. Each pair double marked papers where there was an
issue or marked together and then the moderators sample marked papers from every
team and marked each moderated question with a coloured dot. We moderated approximately 10% of all scripts and at least one question was moderated from a student
from each participating country.
I am confident that this system is effective and robust.
Again, the writing team were pleased with the way in which students attempted all questions in the test. No topic seemed to be inaccessible to students, although certain parts
appeared to pose a problem. This is still a small issue about command words we think for
some countries where students are not educated in English. The writing team recognise
that there is always room for improvement and will always strive to construct a fair and
equitable test.
Additional points:
• We try hard to ensure that there is no cascading disadvantage, ie that students who get
one question wrong are not penalised in subsequent questions.
• Correct exemplification is always considered for extra marks if the mark scheme allows.
• We want to credit what the students know, understand and can do in geography and so
we use positive marking, unless the question requires a specific answer which can be
right or wrong.
• For some of the more ‘open’ questions you will see from the mark scheme that we have
used level marking rather than point marking. This arises from the increased opportunity for students to write extended answers. All the marking team were happy with this
approach.
I would like to express my thanks to all the writing team:
Josef Tan, Anu Printsmann and Dubravka Spevec and to Kath Berg for the hours of work
that went into producing the Written Response Test for the 2014 Geography Olympiad.
In order to support participating countries further, a selection of high scoring answers is
appended below (Appendix 1). This is intended to be accessible from the iGeo website.
Sue Lomas
Chair, Written Response Test Committee
Assessment Coordinator
sue-lomas@talktalk.net
October 2014
Оригинал в Архива: 2014WRT-KrakowQuestionBooklet.pdf · официални решения: 2014WRT-MarkingScheme.pdf · допълнителни данни: 2014WRT-KrakowFinalReport.pdf · допълнителни данни: 2014WRT-Resources.pdf