iGeo 2014, Писмен тест — C. Section C · Global Ecological Footprint
11th International Geography Olympiad · Written Response Test · 12 август 2014 г. · 15 т.
Внимание: Бележка към темата
The original resource PDF omits the D2 boat-school photograph and explicitly withholds the E3 malaria map from public display; the official key supplies no E3 answer. Literal native table, wording, examiner/report label and exemplar/key disagreements are retained in their attributed source scopes.
Instructions for the Students
Instructions for the Students
Fill in your name, team and iGeo student number on the front page of this Question and Answer Booklet.
Fill in your iGeo student number in the boxes on top of the pages in this Booklet.
This test consists of 6 Sections.
The maximum total mark is 90. The mark for each question is given in the margin at the beginning of the question. There are a maximum of 15 marks for each Section.
Answer all questions in the spaces provided in this Booklet.
Check the backs of pages as questions are printed on both sides of a page.
Give only the required number of answers (reasons, examples, etc.). For instance, if the question asks for 2 reasons and you give more than 2, only the first 2 reasons will be marked.
The Resource Booklet contains Sources referred to in this Booklet.
You may use a calculator during the test.
Time: 180 minutes for students not educated in English,
150 minutes for students educated in English.
- Students not educated in English are allowed to use bilingual dictionaries during the test.
Good luck!
Instructions for the Markers
Instructions for the Markers
Check if the iGeo Student Numbers are on each sheet before dividing up the paper.
This test consists of 6 Sections.
One whole Section per marker and double-checker.
Check whether the answer continues outside the designated area. No credits will be given to answers in the Resource Booklet.
The maximum total mark is 90. The mark for each question is given at the beginning of the question. There are a maximum of 15 marks for each Section.
Get the hang of the full range of answers by reading through a few papers with your co-marker before you start your marking.
These answers are not exhaustive. Credit any relevant answer.
Mark only the required number of answers (reasons, examples, etc.). For instance, if the question asks for 2 reasons and there is more than 2, only the first 2 reasons should be marked.
Put your mark next to the question number in the column on the left – it eases the work of the person who has to put the numbers into MS Excel. Total the marks by the title of the Section.
The Moderators (Sue and Anu) will sample the marking of all teams.
Условие
Section C: Global Ecological Footprint. Maximum 15 marks.
Question 1 (1 т.)
1 Study Resource Booklet Figure C1: Ecological footprint by component, 1961–2007. In which year was world biocapacity exceeded?
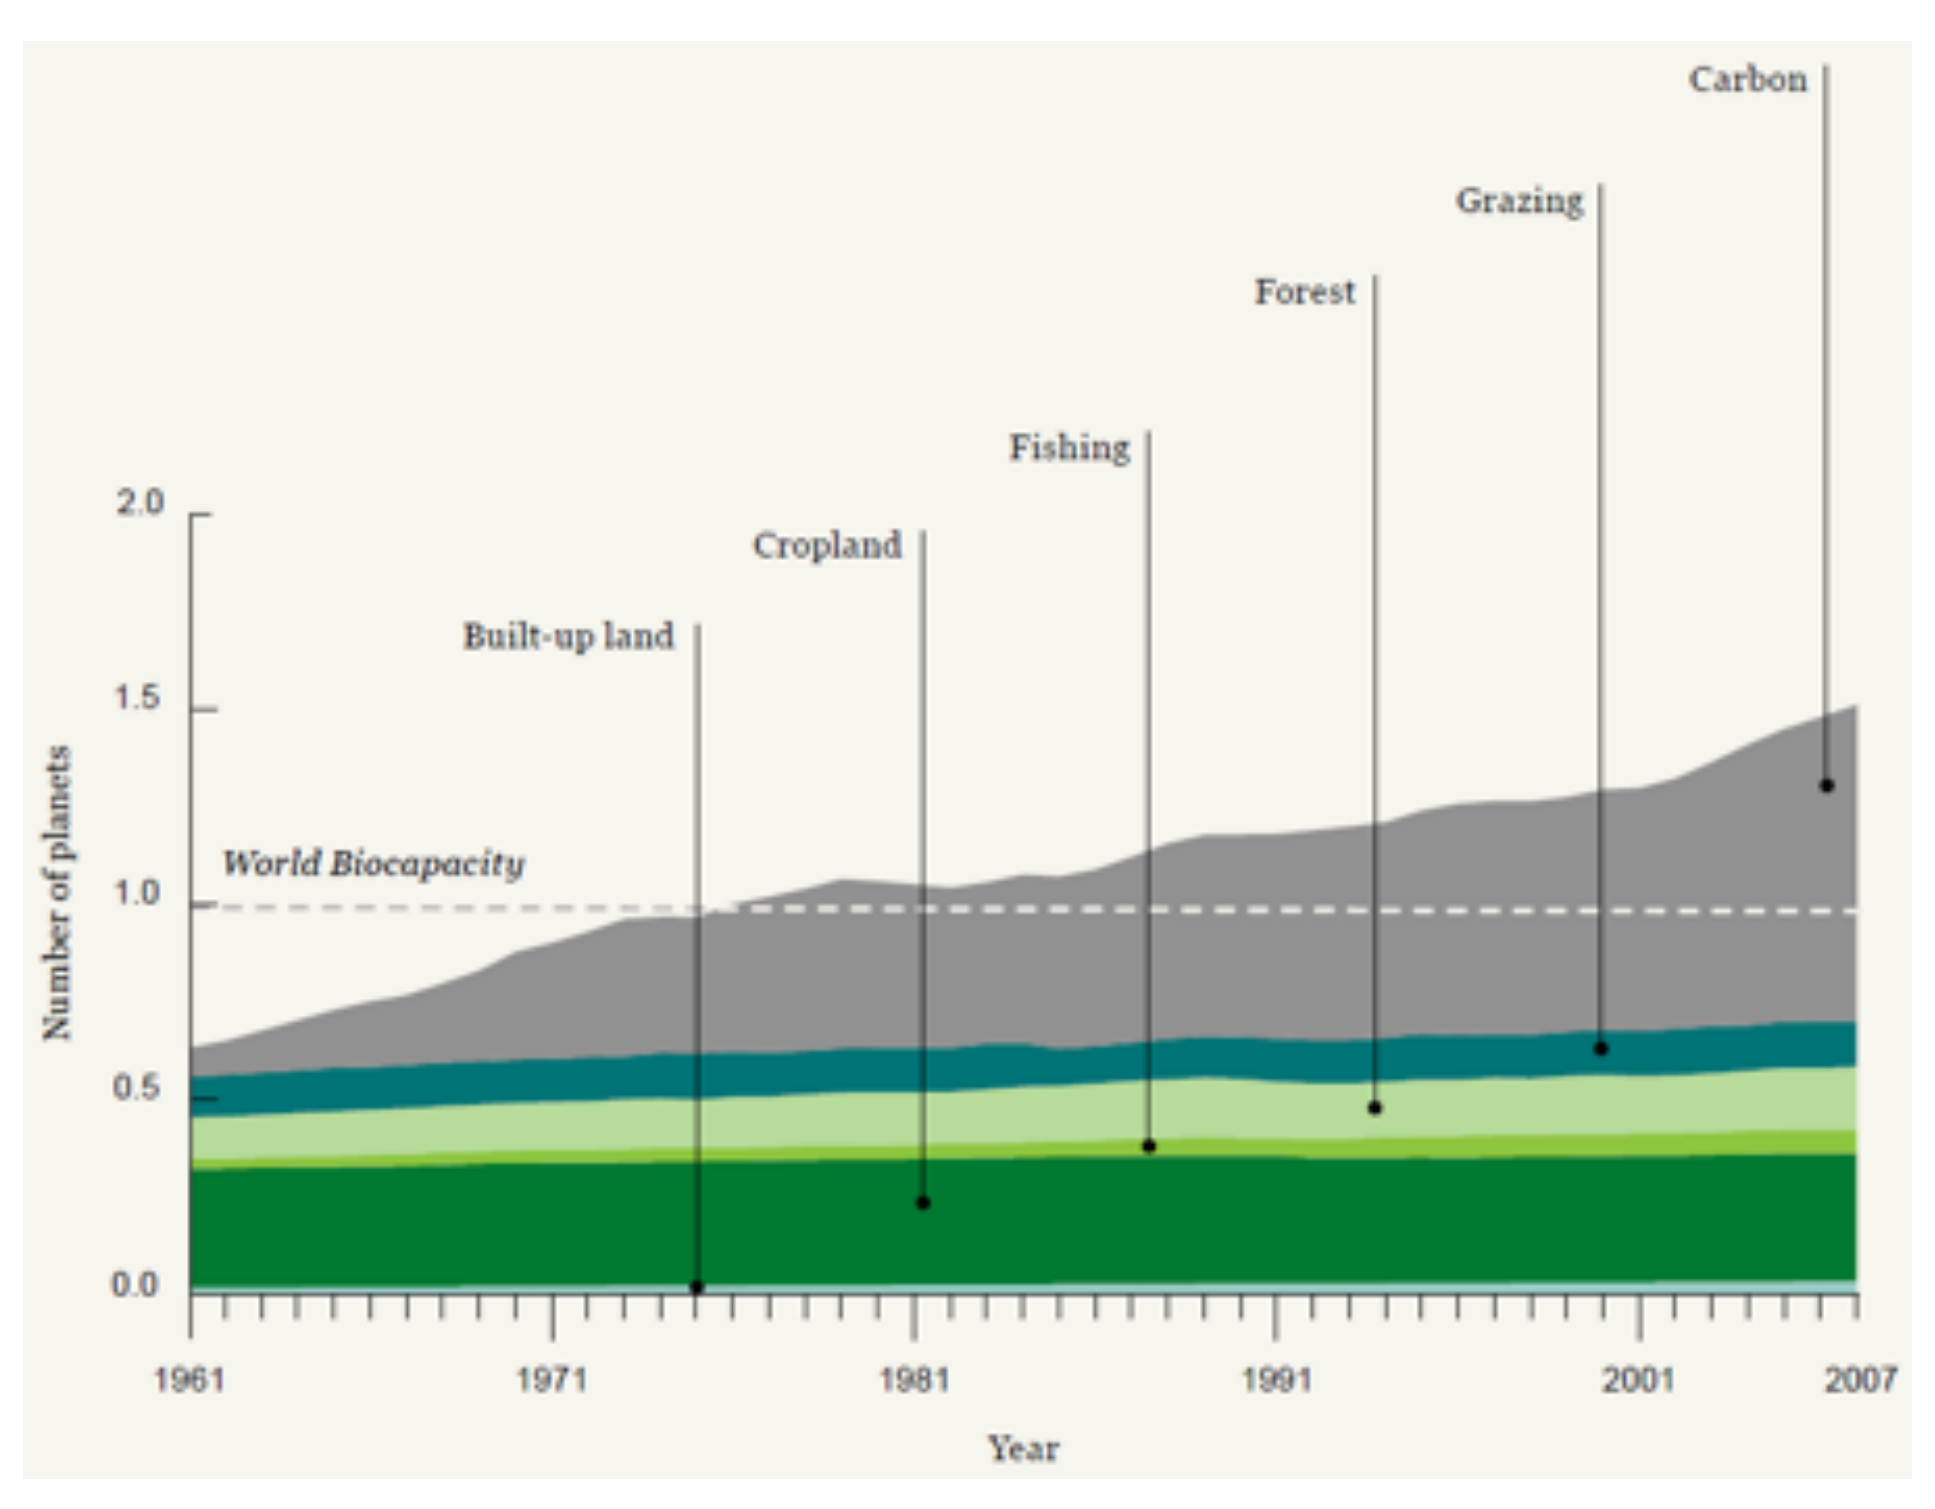
[1 т.]
Question 2 (2 т.)
2 Outline the trends of the global ecological footprint as shown in Figure C1. [2 т.]
Question 3 (3 т.)
3 Study Resource Booklet Figure C2: Composition of low, middle and high income countries’ ecological footprint per capita, 1961–2007. Identify which of the graphs A, B or C represents high income countries. Justify your choice with 2 reasons.
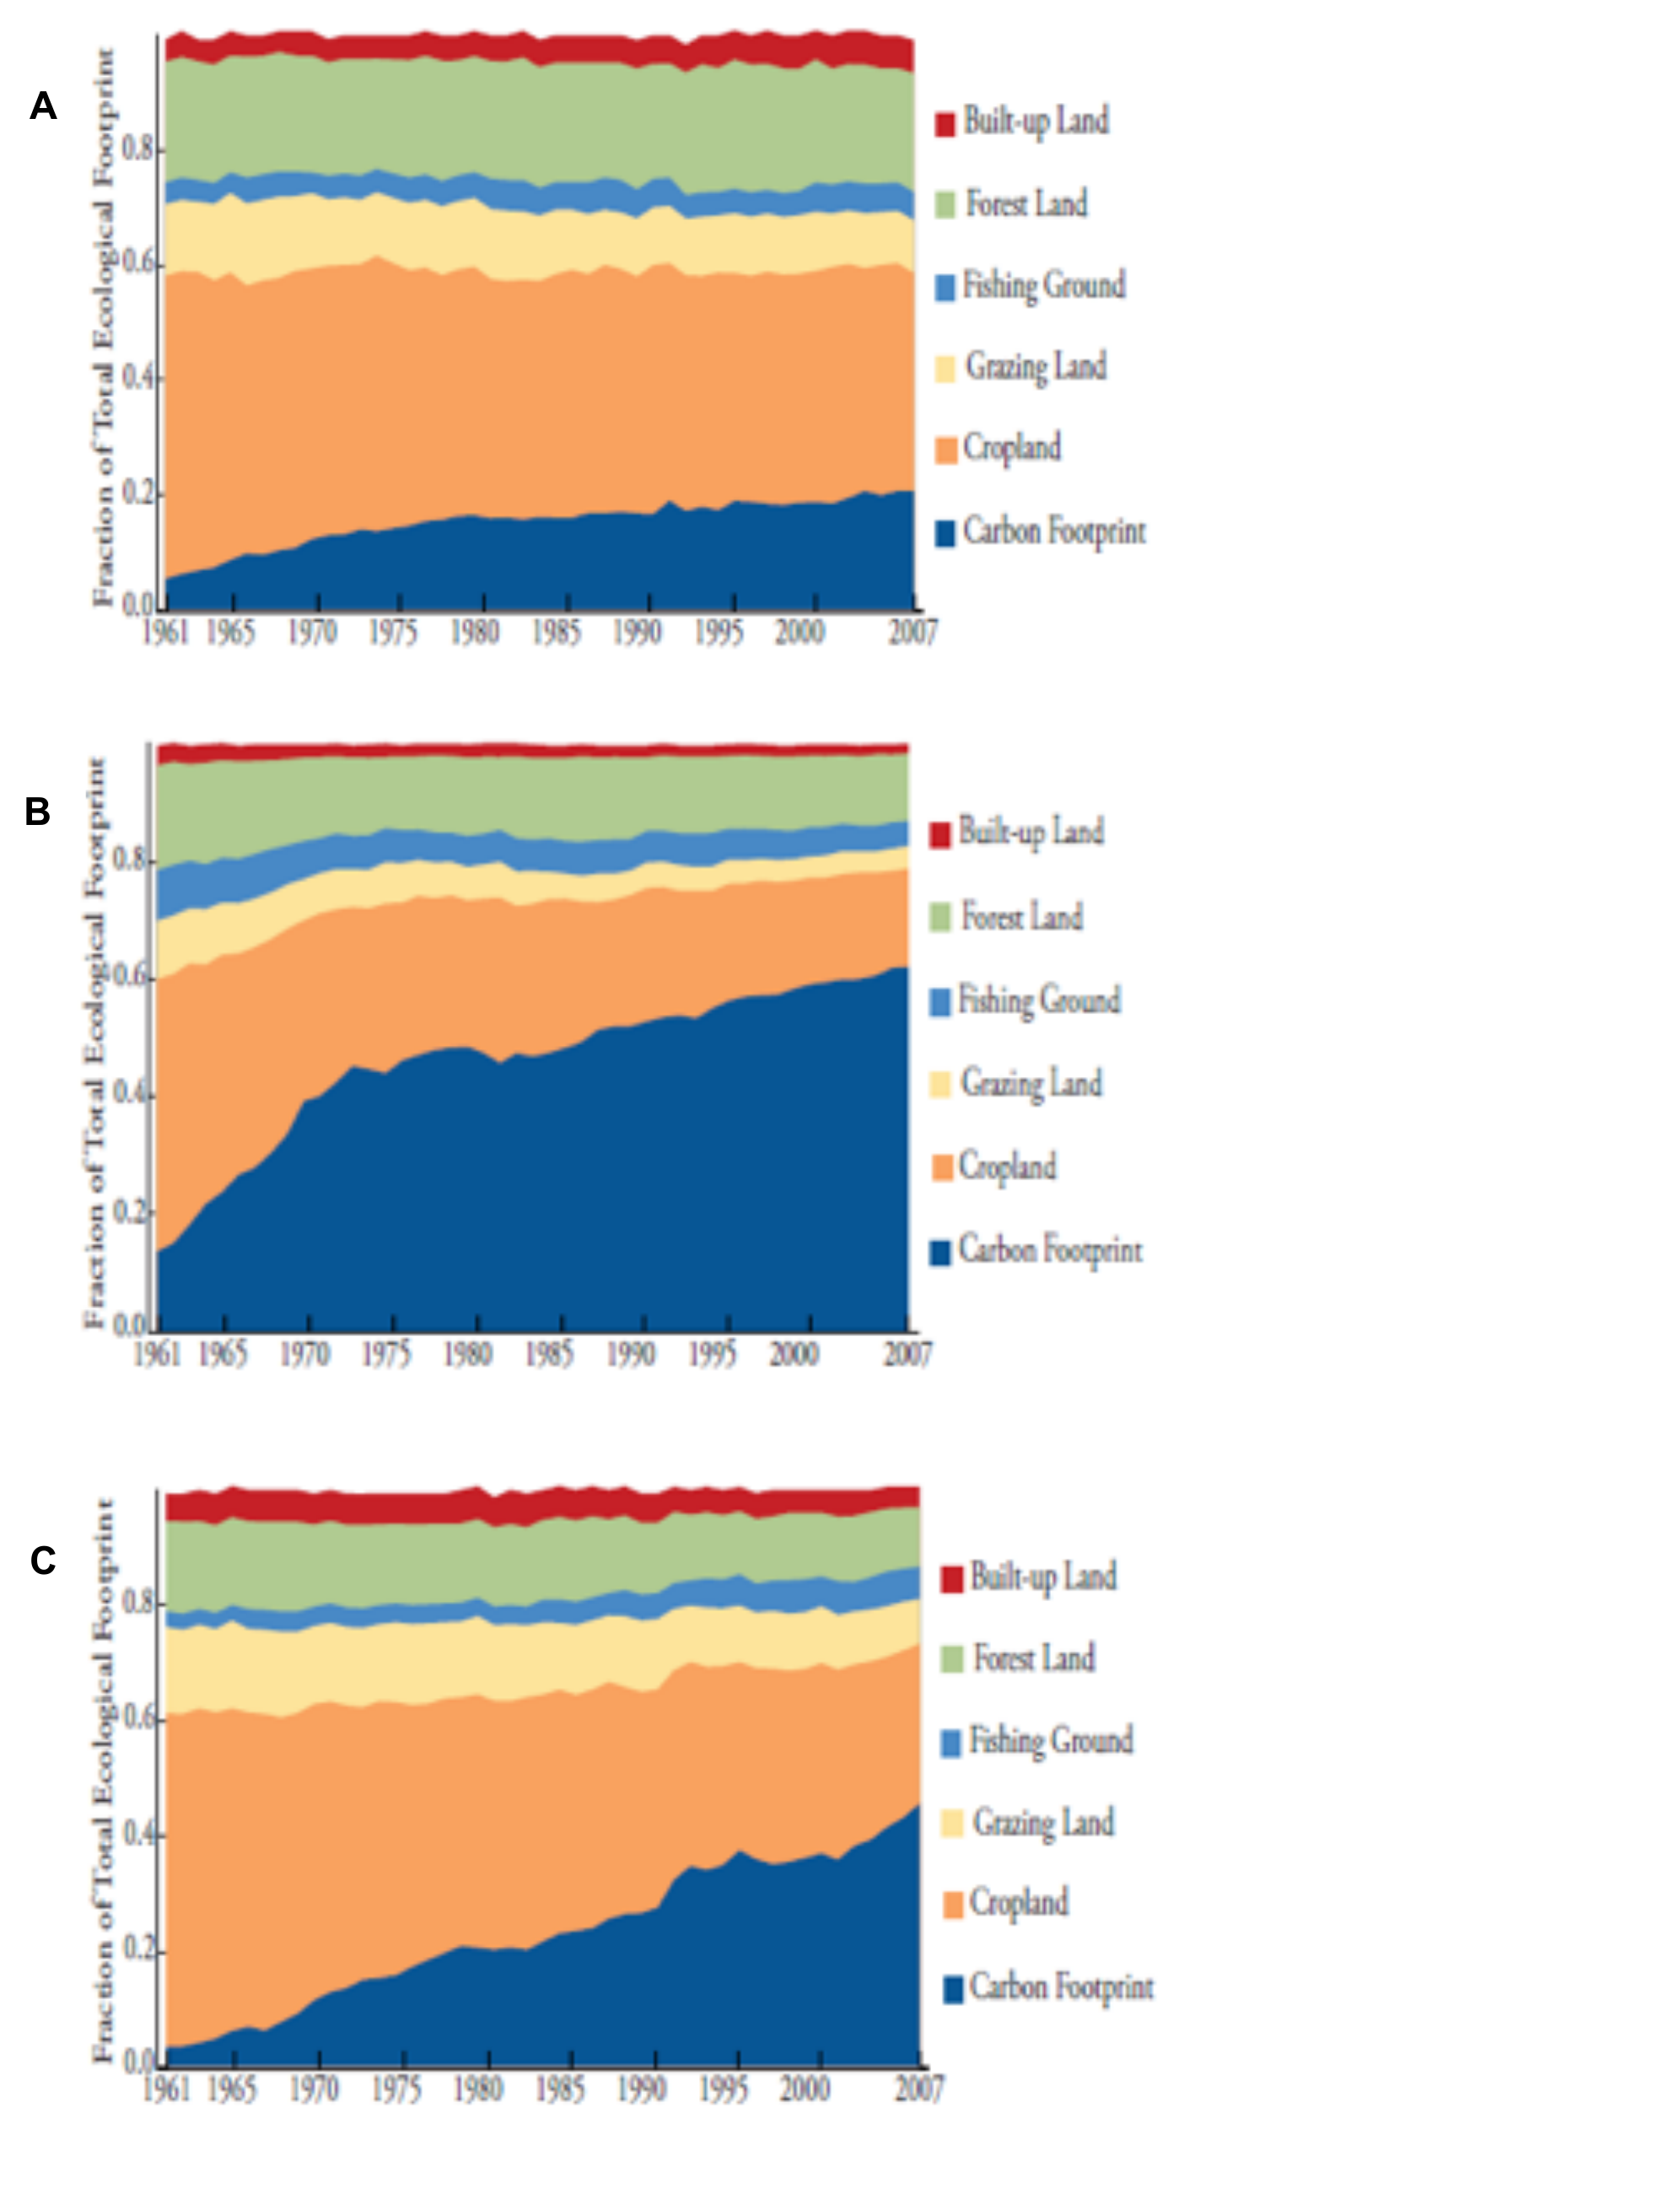
High income countries are represented by graph: ______
Reason 1: ______
Reason 2: ______ [3 т.]
Question 4 (3 т.)
4 Explain how the economic recession that started in 2007 could have affected the ecological footprint of the 3 different income economies.
Low income countries: ______
Middle income countries: ______
High income countries: ______ [3 т.]
Question 5 (1 т.)
5 Study Table C1 below: Ecological footprint and biocapacity, 2007 (source: National Footprint Accounts 2010 edition). Fill in the blank highlighted spaces in Table C1.
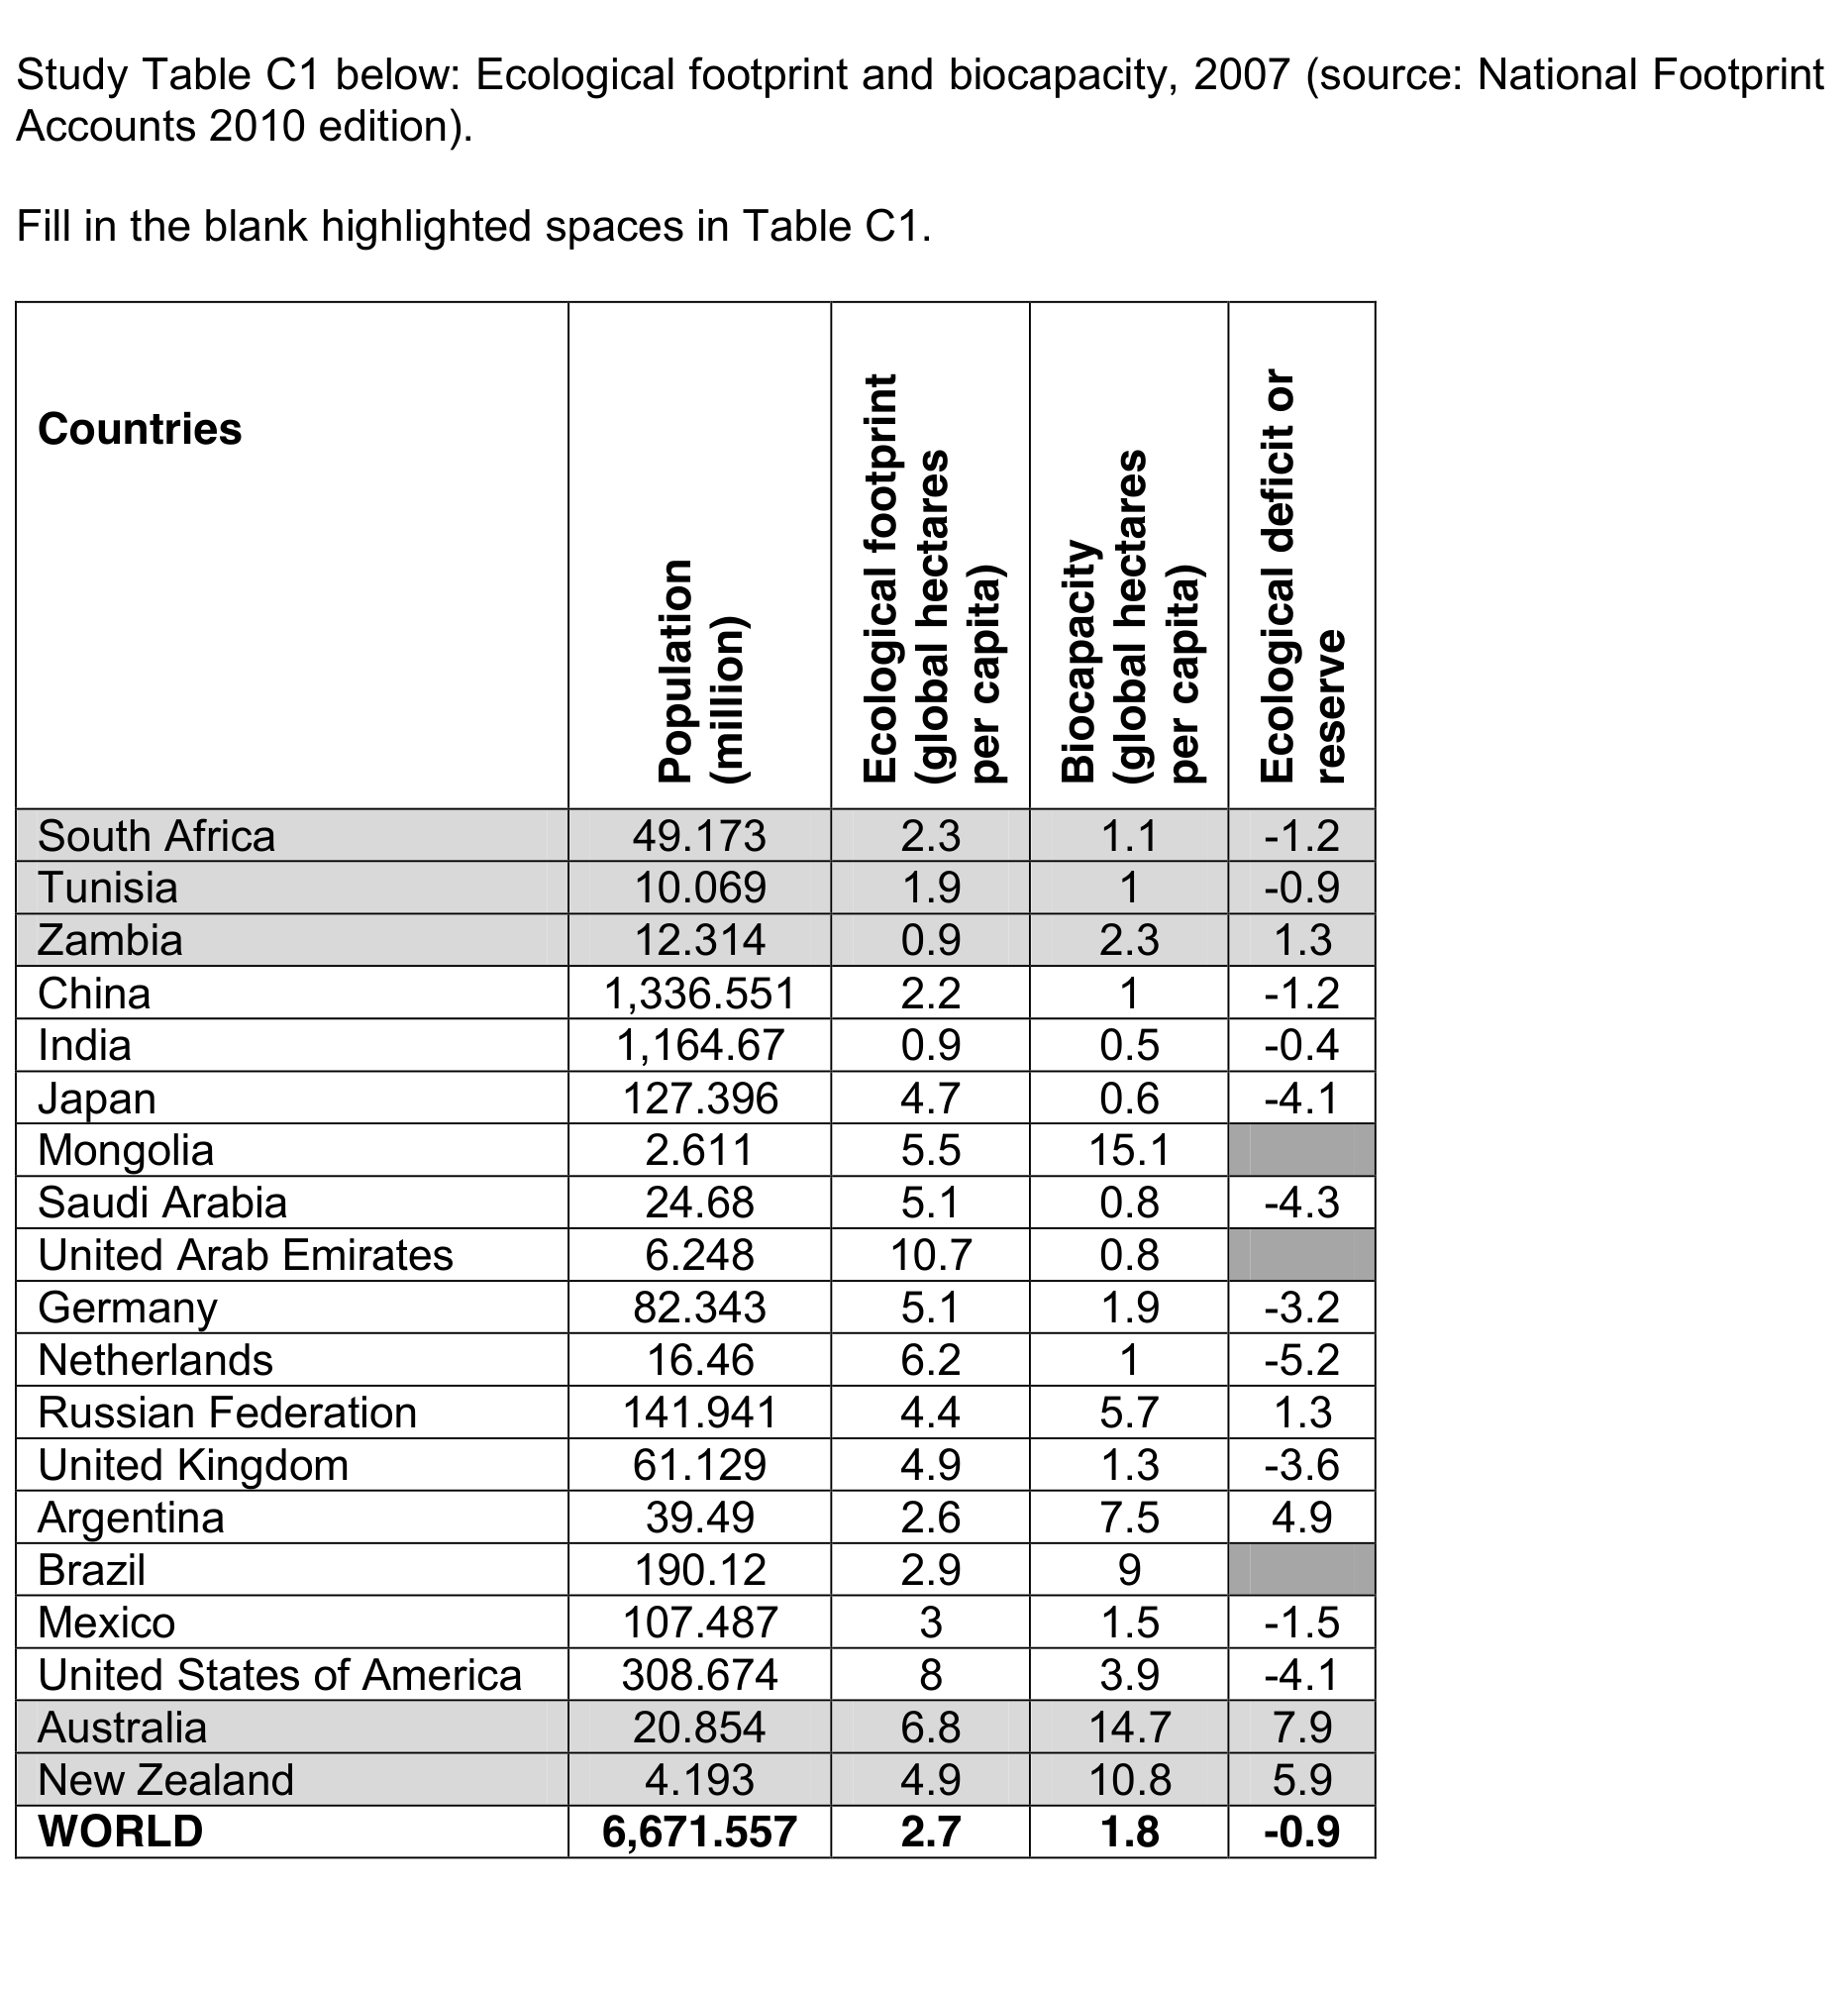
| Countries | Population (million) | Ecological footprint (global hectares per capita) | Biocapacity (global hectares per capita) | Ecological deficit or reserve |
|---|---|---|---|---|
| South Africa | 49.173 | 2.3 | 1.1 | -1.2 |
| Tunisia | 10.069 | 1.9 | 1 | -0.9 |
| Zambia | 12.314 | 0.9 | 2.3 | 1.3 |
| China | 1,336.551 | 2.2 | 1 | -1.2 |
| India | 1,164.67 | 0.9 | 0.5 | -0.4 |
| Japan | 127.396 | 4.7 | 0.6 | -4.1 |
| Mongolia | 2.611 | 5.5 | 15.1 | ______ |
| Saudi Arabia | 24.68 | 5.1 | 0.8 | -4.3 |
| United Arab Emirates | 6.248 | 10.7 | 0.8 | ______ |
| Germany | 82.343 | 5.1 | 1.9 | -3.2 |
| Netherlands | 16.46 | 6.2 | 1 | -5.2 |
| Russian Federation | 141.941 | 4.4 | 5.7 | 1.3 |
| United Kingdom | 61.129 | 4.9 | 1.3 | -3.6 |
| Argentina | 39.49 | 2.6 | 7.5 | 4.9 |
| Brazil | 190.12 | 2.9 | 9 | ______ |
| Mexico | 107.487 | 3 | 1.5 | -1.5 |
| United States of America | 308.674 | 8 | 3.9 | -4.1 |
| Australia | 20.854 | 6.8 | 14.7 | 7.9 |
| New Zealand | 4.193 | 4.9 | 10.8 | 5.9 |
| WORLD | 6,671.557 | 2.7 | 1.8 | -0.9 |
[1 т.]
Question 6 (1 т.)
6 How many planet Earths would be needed if the world’s ecological footprint was the same as that of South Africa, based on Table C1? [1 т.]
Question 7 (2 т.)
Comment on the differences between the ecological deficits or reserves of countries in:
a Africa and
b Oceania (Australasia),
based on Table C1.
Question 8 (2 т.)
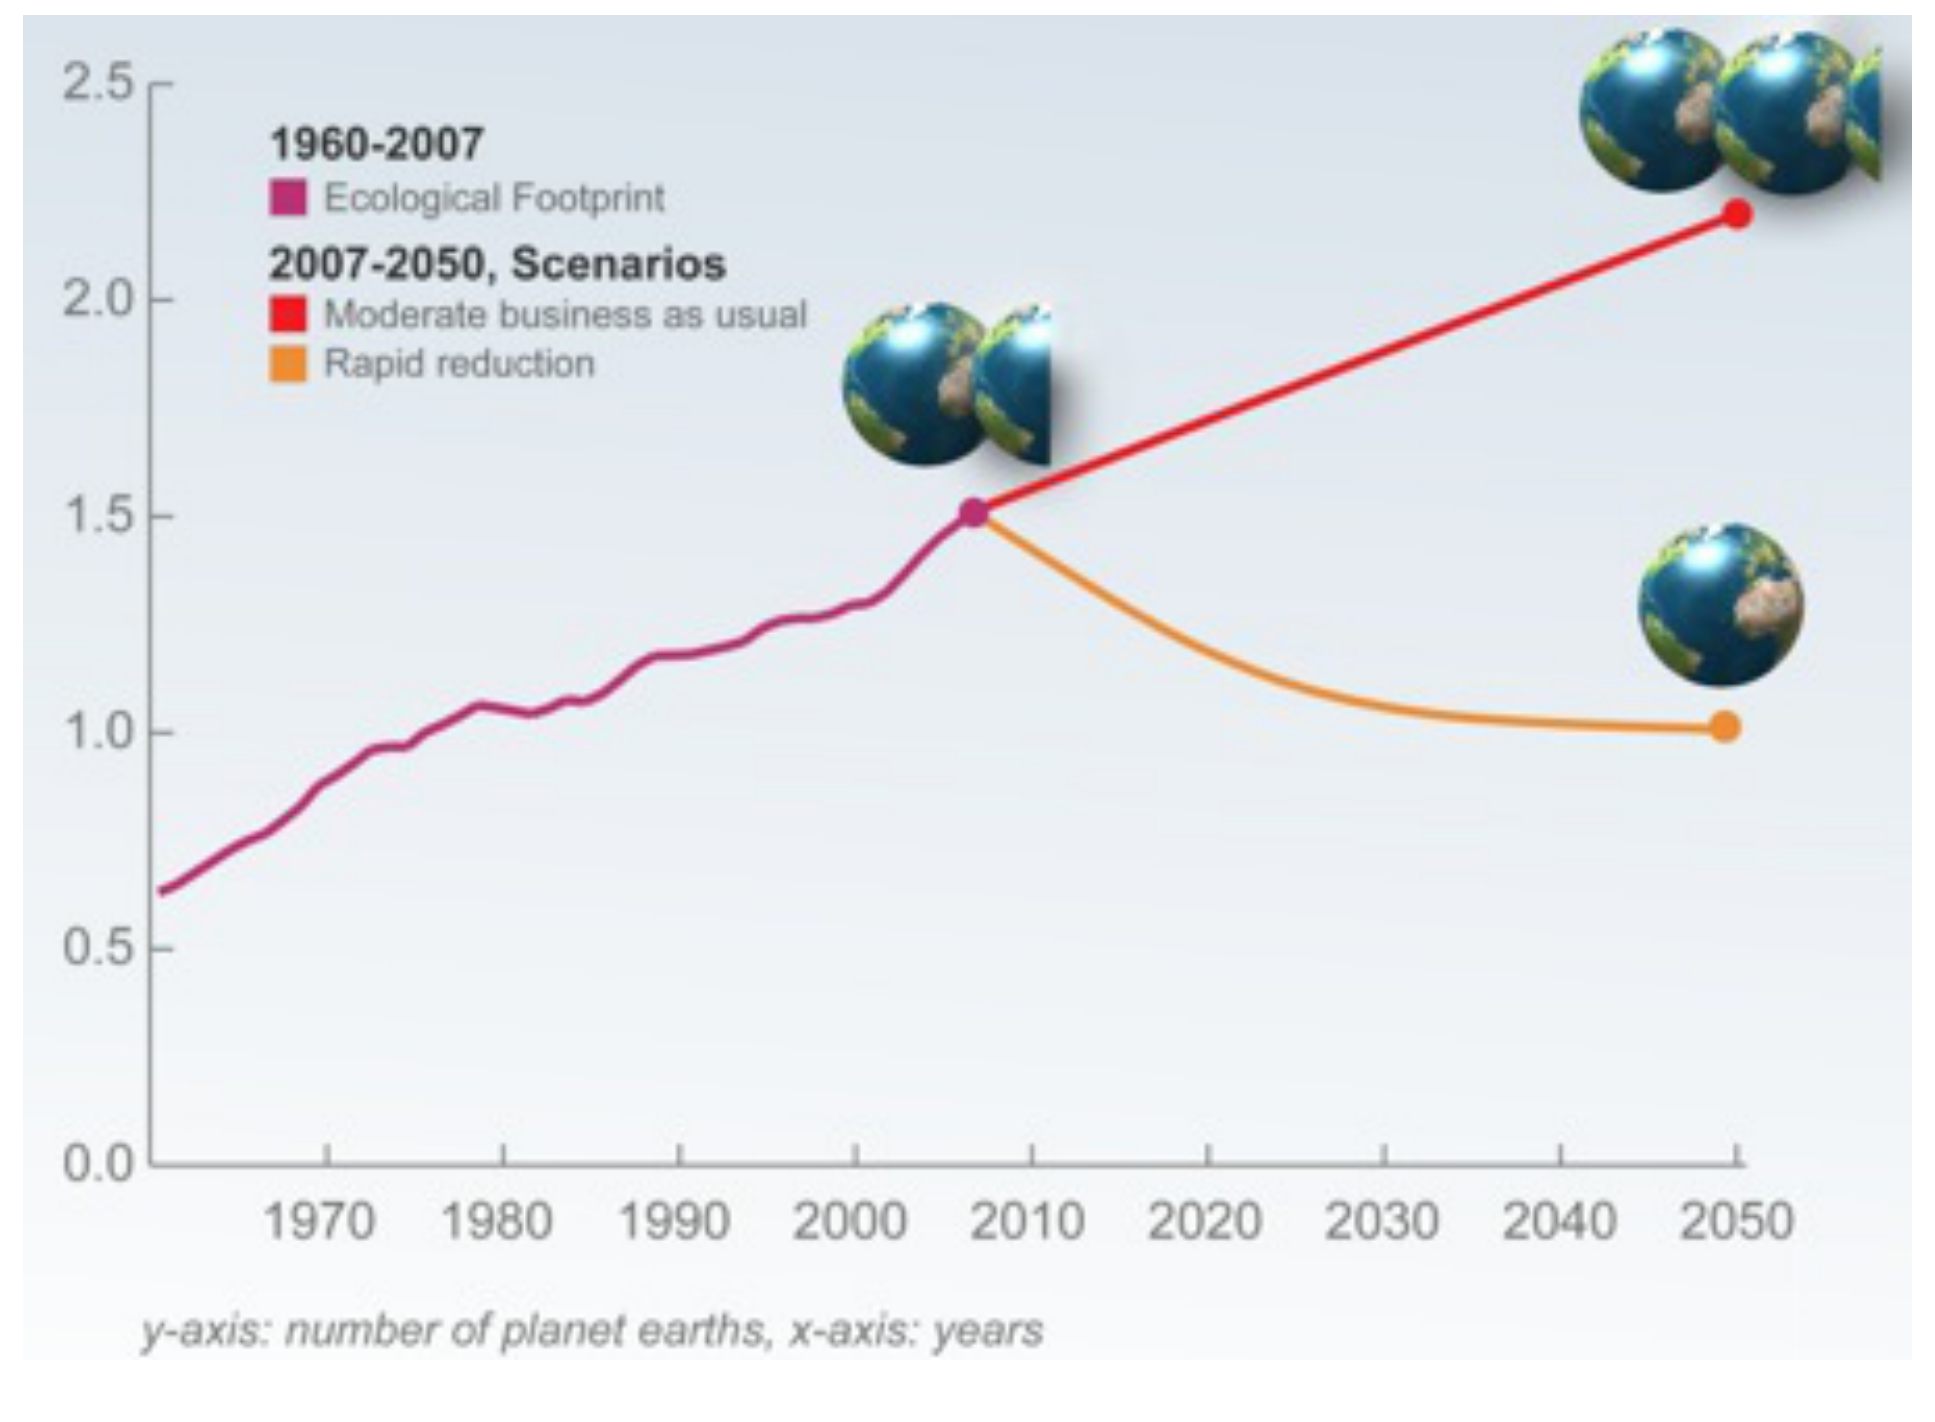
Study Resource Booklet Figure C3: Number of planets scenarios, 2007. Suggest some of the ways in which
a individuals,
b industries and businesses
could reduce the ecological footprint overshoot and achieve the rapid reduction scenario?
Individuals: ______
Industries and businesses: ______
The native booklet prints page14 “This page is intentionally blank”.
Решение
Official Marking Scheme · Section C.
Question 1 (1 т.)
1m – 1975 (1974–1976 accepted).
Question 2 (2 т.)
1m – The overall ecological footprint has had a steady and quite rapid increase from 1961 when 0.6 planets were used, to 1975 when the human demand exceeded available biocapacity (this is referred to as overshoot), continued increasing but at a slower rate till approximately 2003, after which the rate of increase sped up again till 2007 when 1.5 planets were used. 1m – The other components of the ecological footprint have increased very slowly, what has contributed most to the excessive use of our planet Earth is Carbon.
Question 3 (3 т.)
Maximum 2 marks if wrong graph identified but appropriate reasons given. 1m – High income countries – graph B. 1m – Time: Carbon footprint was rising steeply as early as the 1960s marking the rise of living standards (consumerism) of both states and individuals. 1m – The share of Carbon footprint is highest in high income countries because they have fossil-fuel-based energy use economies instead of resource consumption, e.g. cropland.
Question 4 (3 т.)
Low income countries – stayed the same. Middle income countries – stayed the same (the sharp increase of the previous 5 years 2003–2007 stalled as the demand for their products from high income countries stalled). High income countries – dropped sharply. In 2010 the per capita footprint started to grow again only in a few high income countries as governments began spending billions of dollars to stimulate their economies.
Question 5 (1 т.)
Mongolia: 9.6; United Arab Emirates: -9.9; Brazil: 6.1.
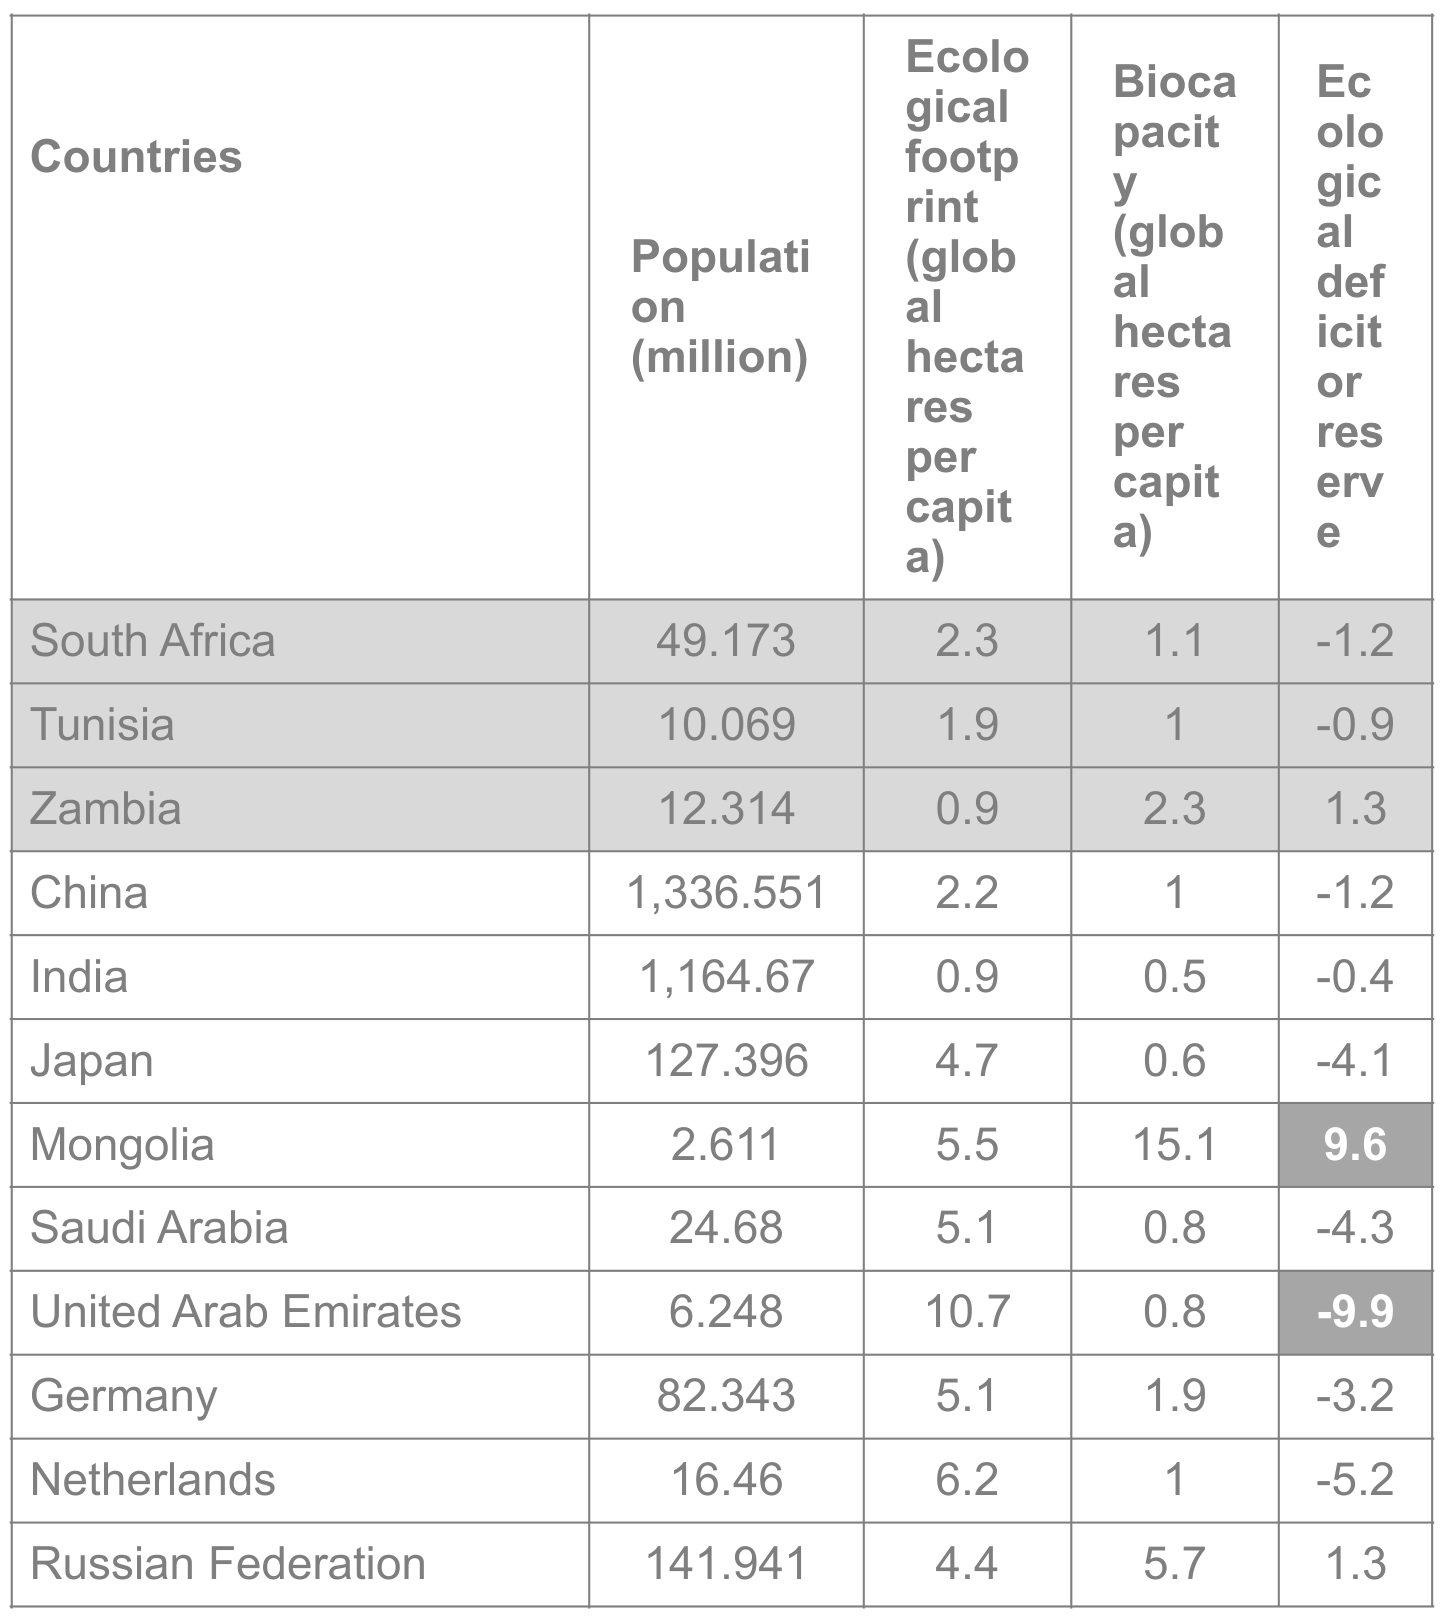
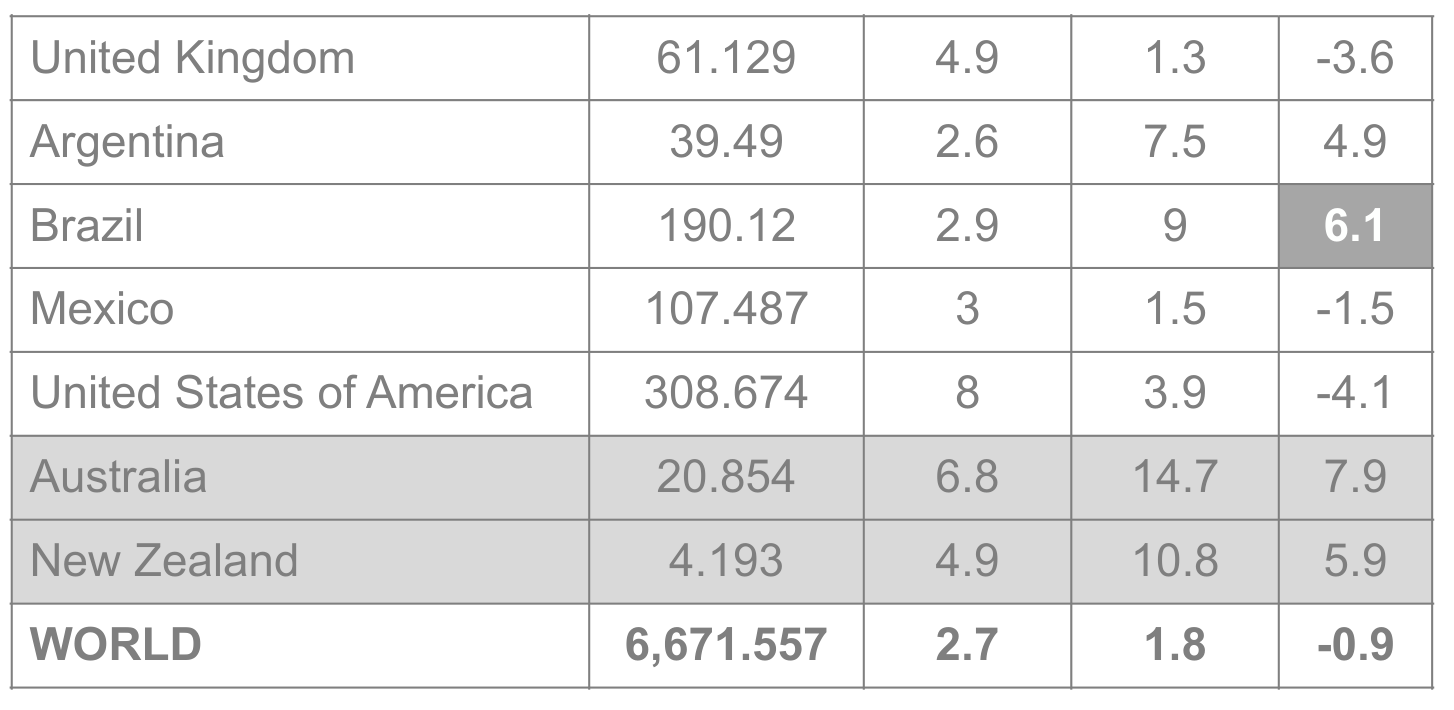
| Countries | Population (million) | Ecological footprint (global hectares per capita) | Biocapacity (global hectares per capita) | Ecological deficit or reserve |
|---|---|---|---|---|
| South Africa | 49.173 | 2.3 | 1.1 | -1.2 |
| Tunisia | 10.069 | 1.9 | 1 | -0.9 |
| Zambia | 12.314 | 0.9 | 2.3 | 1.3 |
| China | 1,336.551 | 2.2 | 1 | -1.2 |
| India | 1,164.67 | 0.9 | 0.5 | -0.4 |
| Japan | 127.396 | 4.7 | 0.6 | -4.1 |
| Mongolia | 2.611 | 5.5 | 15.1 | 9.6 |
| Saudi Arabia | 24.68 | 5.1 | 0.8 | -4.3 |
| United Arab Emirates | 6.248 | 10.7 | 0.8 | -9.9 |
| Germany | 82.343 | 5.1 | 1.9 | -3.2 |
| Netherlands | 16.46 | 6.2 | 1 | -5.2 |
| Russian Federation | 141.941 | 4.4 | 5.7 | 1.3 |
| United Kingdom | 61.129 | 4.9 | 1.3 | -3.6 |
| Argentina | 39.49 | 2.6 | 7.5 | 4.9 |
| Brazil | 190.12 | 2.9 | 9 | 6.1 |
| Mexico | 107.487 | 3 | 1.5 | -1.5 |
| United States of America | 308.674 | 8 | 3.9 | -4.1 |
| Australia | 20.854 | 6.8 | 14.7 | 7.9 |
| New Zealand | 4.193 | 4.9 | 10.8 | 5.9 |
| WORLD | 6,671.557 | 2.7 | 1.8 | -0.9 |
Question 6 (1 т.)
1.3 planets (the ecological footprint of South Africa 2.3 / biocapacity of the world 1.8 =
1.3 planets)
Question 7 (2 т.)
1m – Although the per capita ecological footprint is low, South Africa and Tunisia face ecological deficit due to large population density and high birth rates (population growth); they have a deficit of agricultural land (especially Tunisia). South Africa and Tunisia are facing resource depletion (intensive use of resources – consumption of a resource is faster than it can be replenished). Zambia still has some ecological reserves – it is well known for its natural resources, especially water resources (Zambezi River and Congo River) important for population and economy (hydro energy, transport, mining and industry). 1m – Although the per capita ecological footprint is high, Oceania (Australasia) still has ecological reserves due to much smaller population density/growth which results with much smaller pressure on the land (smaller ecological footprint). Countries in this area are using fewer global hectares than their own land mass provides. These areas still have significant export potential (food reserves).
Question 8 (2 т.)
1m – Personal behaviour: means of transportation, electricity, gas, fuel consumption (reduction and/or change of source, e.g. photovoltaics on roof), use of water saving gadgets , purchasing food (organic local production for local consumption), becoming a vegetarian, residence to the home environment- friendly, waste treatment (recycling). 1m – Corporate activities: establishment of corporate ethics on natural resource development and product manufacturing (CSR), human rights and environmental pollution control measures, investment activities to the creation of an environment such as desert greening projects.
Native references
References
Ewing B., D. Moore, S. Goldfinger, A. Oursler, A. Reed and M. Wackernagel 2010: The Ecological Footprint Atlas 2010. Oakland: Global Footprint Network.
World Wide Fund For Nature International, Zoological Society of London and Global Footprint Network 2010: Living Planet Report 2010. Biodiversity, Biocapacity and Development.
Committee Report · Appendix 1
Committee Report, October 2014 — Appendix 1. This section contains some examples of good answers with comments from the marking teams in speech bubbles. All the exemplar answers are taken from scripts of students who are not educated in English. These source-attributed exemplars retain their native wording, numbering, marks and disagreements with the Marking Scheme.
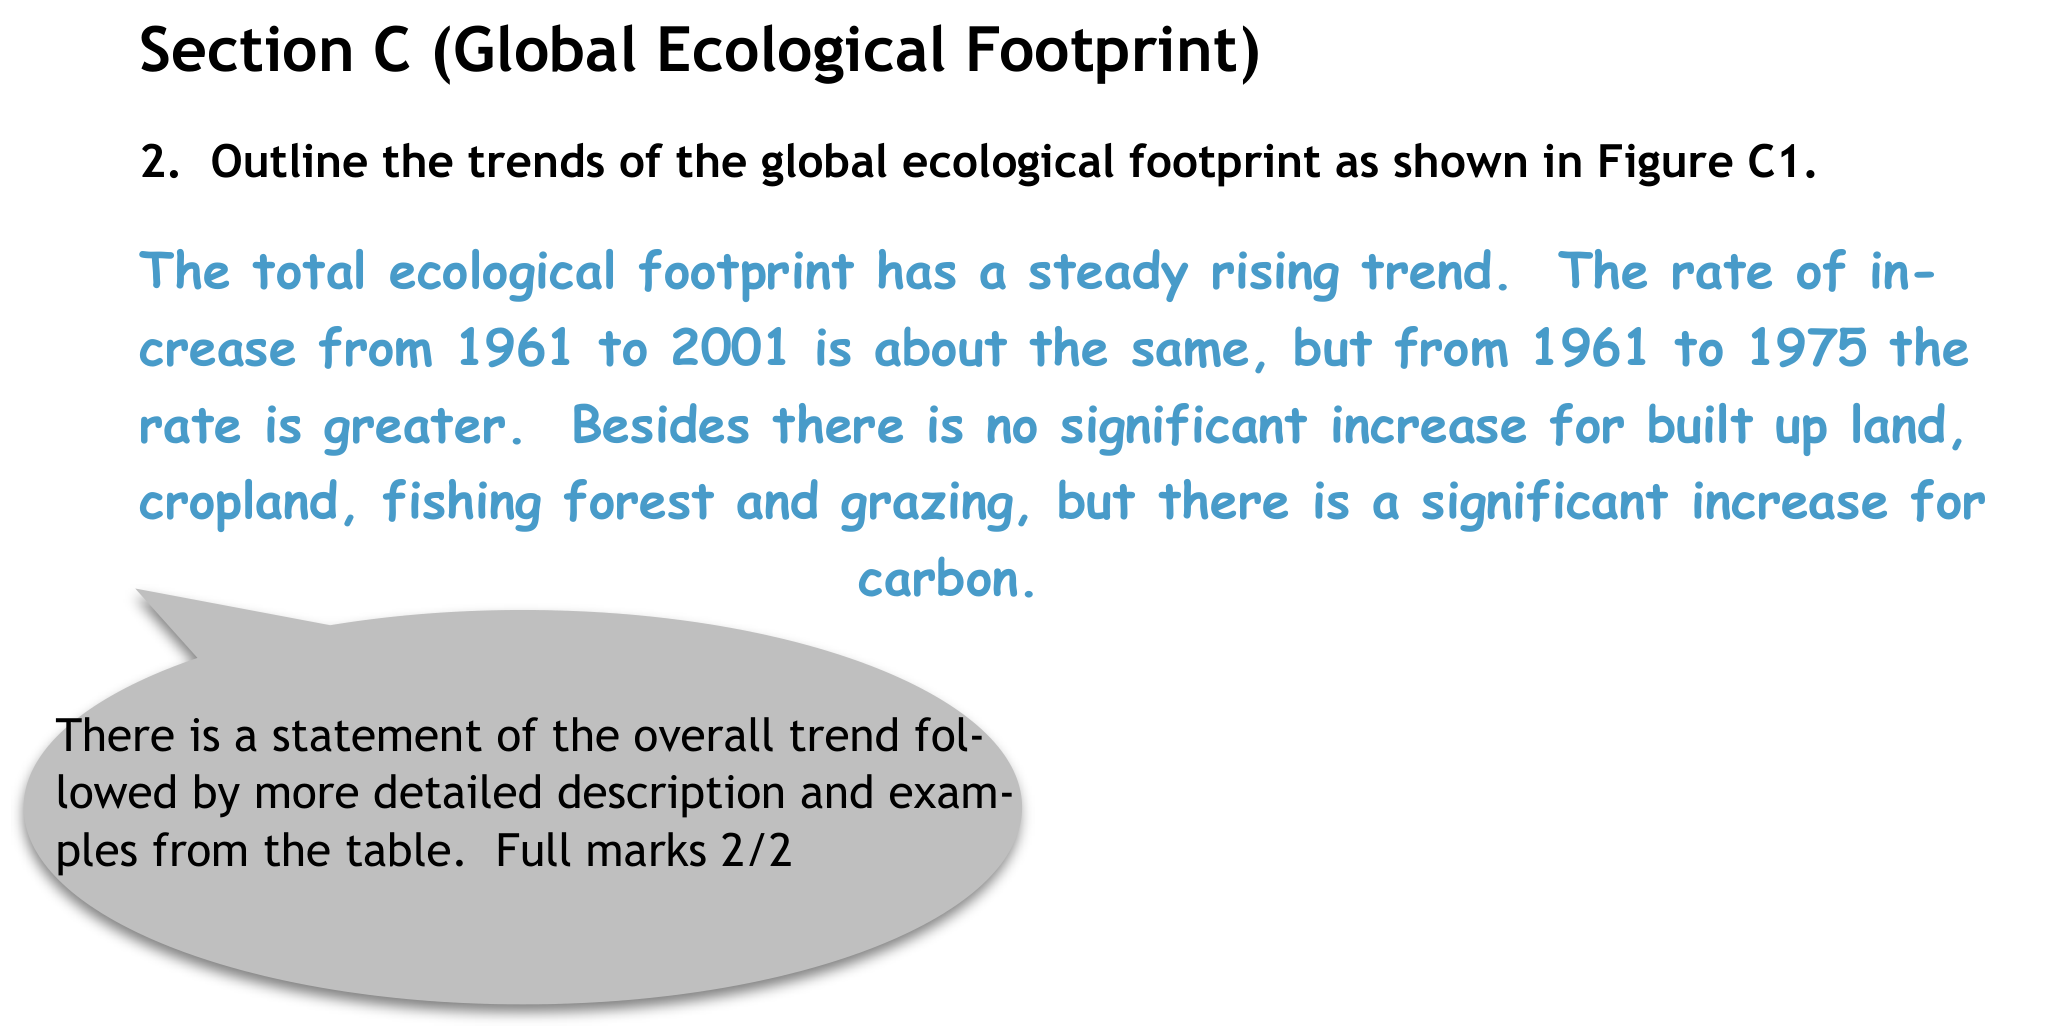
Committee Report exemplar · C2, scored2/2; complete answer and examiner bubble.
Source-attributed student answer and marking-team comment:
Section C (Global Ecological Footprint) 2. Outline the trends of the global ecological footprint as shown in Figure C1. The total ecological footprint has a steady rising trend. The rate of increase from 1961 to 2001 is about the same, but from 1961 to 1975 the rate is greater. Besides there is no significant increase for built up land, cropland, fishing forest and grazing, but there is a significant increase for carbon. There is a statement of the overall trend followed by more detailed description and examples from the table. Full marks 2/2
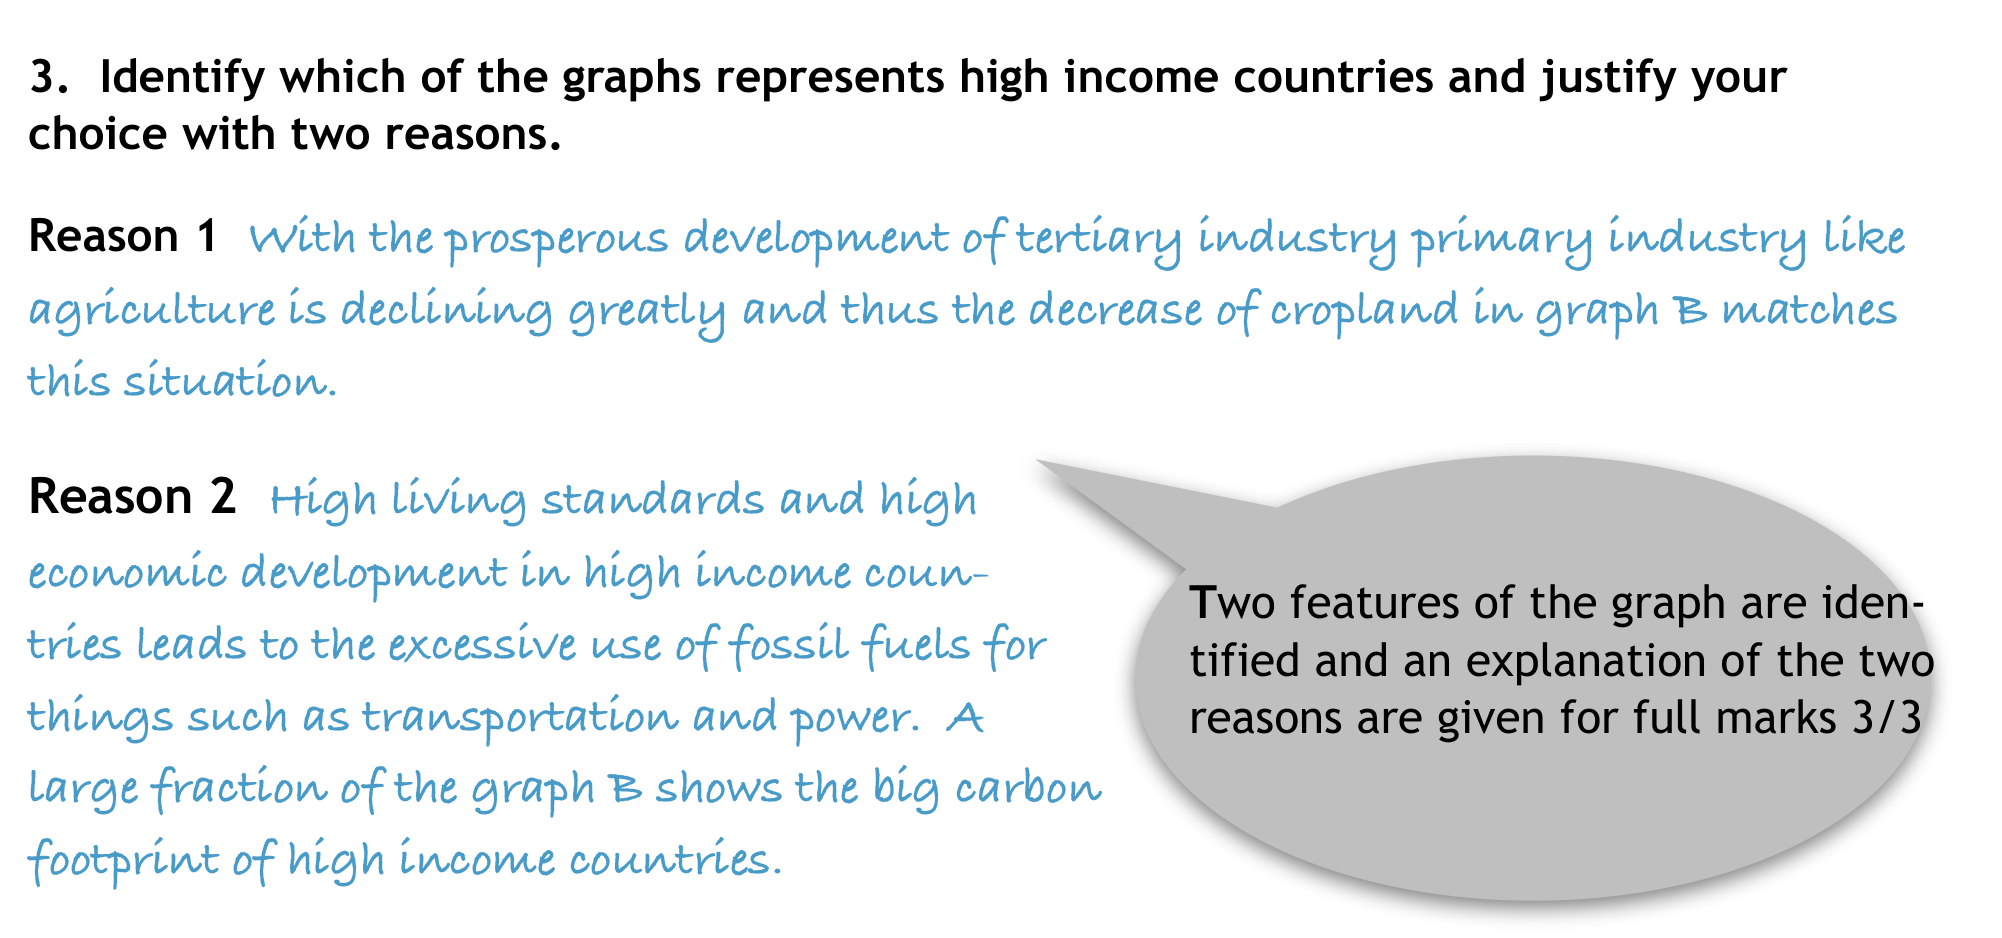
Committee Report exemplar · C3, scored3/3; both reasons and complete examiner bubble.
Source-attributed student answer and marking-team comment:
- Identify which of the graphs represents high income countries and justify your choice with two reasons. Reason 1 With the prosperous development of tertiary industry primary industry like agriculture is declining greatly and thus the decrease of cropland in graph B matches this situation. Reason 2 High living standards and high economic development in high income countries leads to the excessive use of fossil fuels for things such as transportation and power. A large fraction of the graph B shows the big carbon footprint of high income countries. Two features of the graph are identified and an explanation of the two reasons are given for full marks 3/3
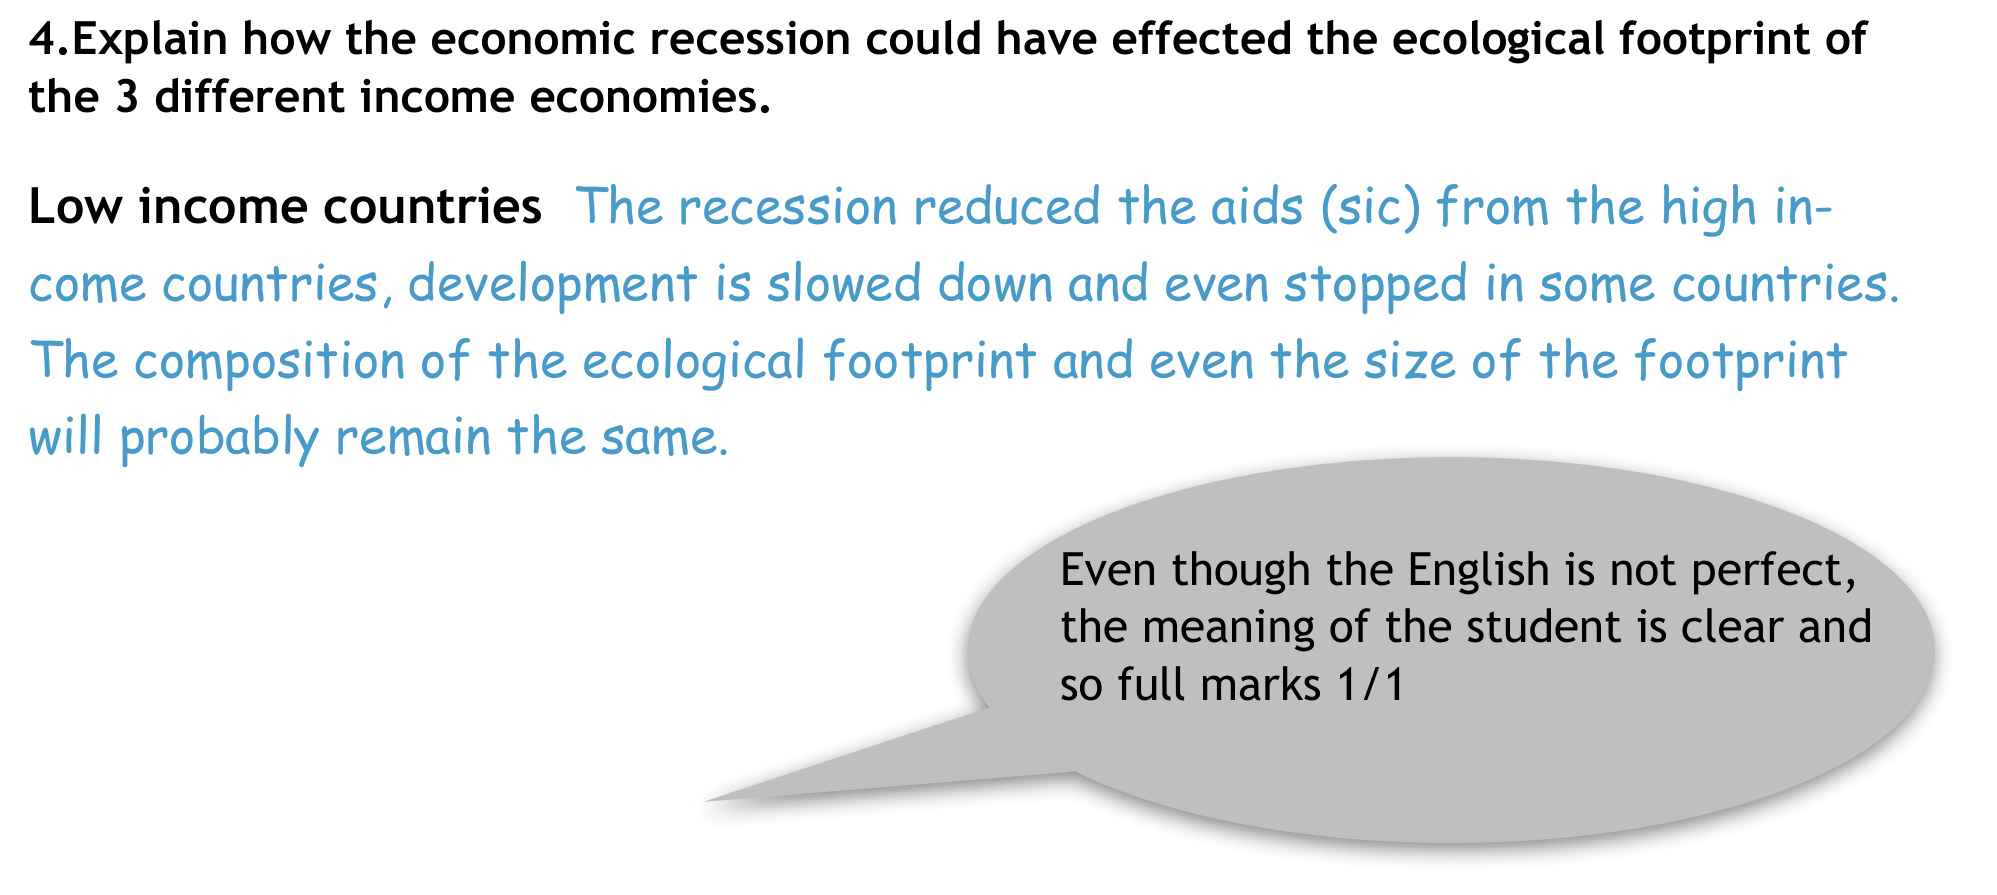
Committee Report exemplar · C4 low-income only, scored1/1; complete student answer and examiner bubble.
Source-attributed student answer and marking-team comment:
4.Explain how the economic recession could have effected the ecological footprint of the 3 different income economies. Low income countries The recession reduced the aids (sic) from the high income countries, development is slowed down and even stopped in some countries. The composition of the ecological footprint and even the size of the footprint will probably remain the same.
Even though the English is not perfect, the meaning of the student is clear and so full marks 1/1
Committee Report · October 2014 · General report
Geography Olympiad 2014 - Krakow
Written Response Test Report
Student Performance
•
Overall the paper was accessible by all students. The total marks were out of 90
with the lowest score being 14 marks (compared to 9 marks in 2013) and the highest score reaching 70 marks (75.5 marks in 2013). The median mark was 47 out of
90 (43 in 2013). Overall this was a higher scoring paper than last year’s WRT.
•
The highest scoring section overall was Section F (Globalisation and Transnational
Corporations) where the median mark was 11 out of 15.
•
Section A (Geology and Coastal Landforms) was the only section where a student
achieved full marks (15)
•
The lowest scoring section was Section C ( Global Ecological Footprint) where the
median mark was 8 out of 15.
•
Section A had several students who did not score at all and Section C and E each
had 2 students who didn’t score at all. However, Section A was also where the
highest mark was achieved.
General Comments
•
The writing committee has continued to make a conscious effort to ask more
‘open’ questions which we hoped would encourage students to write in more extended prose.
•
Questions were structured so that generally, the easier more closed questions came
at the beginning of each section using command words such as identify, outline,
describe, name, and what?
•
The more open, challenging questions came towards the end using command words
such as explain, suggest, comment on and justify.
•
As in previous years, the team also tried to produce sections that integrated physical and human geography topics.
•
We always try to provide a variety of data representation/visualisation (eg. maps,
graphs, tables, etc.) to reflect the range of sources that geographers work with.
•
We also tried to introduce some more modern topics e.g. geography of health; the
solar powered boat schools and the recent expansion of globalisation.
•
Some questions were very poorly answered by students:
o
In question C7 students were asked to comment on the differences between
the data shown in the table for Africa and Oceania. 87 students did not
score on this part.
o
QuestionA4 asked students to draw a series of diagrams to show the formation of a delta. 58 students did not score on this part.62 students were unable to give a reasonable definition of globalisation in question F1.
• However, other questions were more competently answered:
o
Question B2 asked about afforestation and only 8 students were unable to
gain a mark here.
o
Section F2 asked students to give factors influencing the process of globalisation and only 21 students did not score on this section.
o
It was pleasing to see that more than half the students could explain the
impacts of El Nino in Section D2.
Command words
•
There seemed to be fewer instances where students misinterpreted the command
words. This may have been because again time was given for students who are not
educated in English to read and digest the command words before the test starts.
•
The writing committee does not see this should be a particular problem for non-
English speakers.
Marking
Again, I am grateful to everyone who marked the WRT this year and especially to Anu
Printsmann and Dubravka Spevec whose academic backgrounds and meticulous approach contributed to a robust marking process.
Consistency and quality assurance is achieved by teams of two markers marking all the
scripts of the students for one section. The provisional mark scheme was prepared by
the writing team before the test took place. This was adjusted if necessary, by the
paid of geography specialist markers and the moderators (Anu and Sue) after a sample
of 30 papers had been marked. Each pair double marked papers where there was an
issue or marked together and then the moderators sample marked papers from every
team and marked each moderated question with a coloured dot. We moderated approximately 10% of all scripts and at least one question was moderated from a student
from each participating country.
I am confident that this system is effective and robust.
Again, the writing team were pleased with the way in which students attempted all questions in the test. No topic seemed to be inaccessible to students, although certain parts
appeared to pose a problem. This is still a small issue about command words we think for
some countries where students are not educated in English. The writing team recognise
that there is always room for improvement and will always strive to construct a fair and
equitable test.
Additional points:
• We try hard to ensure that there is no cascading disadvantage, ie that students who get
one question wrong are not penalised in subsequent questions.
• Correct exemplification is always considered for extra marks if the mark scheme allows.
• We want to credit what the students know, understand and can do in geography and so
we use positive marking, unless the question requires a specific answer which can be
right or wrong.
• For some of the more ‘open’ questions you will see from the mark scheme that we have
used level marking rather than point marking. This arises from the increased opportunity for students to write extended answers. All the marking team were happy with this
approach.
I would like to express my thanks to all the writing team:
Josef Tan, Anu Printsmann and Dubravka Spevec and to Kath Berg for the hours of work
that went into producing the Written Response Test for the 2014 Geography Olympiad.
In order to support participating countries further, a selection of high scoring answers is
appended below (Appendix 1). This is intended to be accessible from the iGeo website.
Sue Lomas
Chair, Written Response Test Committee
Assessment Coordinator
sue-lomas@talktalk.net
October 2014
Оригинал в Архива: 2014WRT-KrakowQuestionBooklet.pdf · официални решения: 2014WRT-MarkingScheme.pdf · допълнителни данни: 2014WRT-KrakowFinalReport.pdf · допълнителни данни: 2014WRT-Resources.pdf