INPhO 2020, Теория — Задача 4. Sound source
Indian National Physics Olympiad – 2020 · 2 февруари 2020 г. · 20 т.
Внимание: Бележка към темата
The complete retained question booklet includes the summary answer boxes, sixteen blank detailed-answer pages and two blank graph sheets. All matching archived HBCSE key content is retained, including its handwritten graph and comment not for grading purposes. Printed sign/symbol discrepancies and the key cover page-count mismatch remain literal with labelled source notes.
Native cover and instructions
Indian National Physics Olympiad – 2020
Date: 02 February 2020. Time: 09:00–12:00 (3 hours). Maximum Marks: 80.
Roll Number: . Extra sheets attached: [blank box]. INO Centre (e.g. Ranchi): [blank line].
(Do not write below this line)
- This booklet consists of 23 pages (excluding this page) and total of 5 questions.
- This booklet is divided in two parts: Questions with Summary Answer Sheet and Detailed Answer Sheet. Write roll number at the top wherever asked.
- The final answer to each sub-question should be neatly written in the box provided below each sub-question in the Questions & Summary Answer Sheet.
- You are also required to show your detailed work for each question in a reasonably neat and coherent way in the Detailed Answer Sheet. You must write the relevant Question Number(s) on each of these pages.
- Marks will be awarded on the basis of what you write on both the Summary Answer Sheet and the Detailed Answer Sheet. Simple short answers and plots may be directly entered in the Summary Answer Sheet. Marks may be deducted for absence of detailed work in questions involving longer calculations. Strike out any rough work that you do not want to be considered for evaluation.
- Adequate space has been provided in the answersheet for you to write/calculate your answers. In case you need extra space to write, you may request additional blank sheets (maximum two) from the invigilator. Write your roll number on the extra sheets and get them attached to your answersheet and indicate number of extra sheets attached at the top of this page.
- Non-programmable scientific calculators are allowed. Mobile phones cannot be used as calculators.
- Use blue or black pen to write answers. Pencil may be used for diagrams/graphs/sketches.
- This entire booklet must be returned at the end of the examination.
Table of Constants
| Constant | Symbol | Value |
|---|---|---|
| Speed of light in vacuum | ||
| Planck’s constant | ||
| Universal constant of Gravitation | ||
| Magnitude of electron charge | ||
| Rest mass of electron | ||
| Value of | ||
| Avogadro’s number | ||
| Acceleration due to gravity | ||
| Universal Gas Constant | ||
| Permeability constant |
| Question | Marks | Score |
|---|---|---|
| 1 | 13 | |
| 2 | 12 | |
| 3 | 15 | |
| 4 | 20 | |
| 5 | 20 | |
| Total | 80 |
HOMI BHABHA CENTRE FOR SCIENCE EDUCATION
Tata Institute of Fundamental Research
V. N. Purav Marg, Mankhurd, Mumbai, 400 088
Native key notice
Please note that alternate/equivalent methods and different way of expressing final solutions may exist.
Source note: The retained key cover says “16 pages (excluding this page)”; the native PDF contains eighteen pages, including its appended handwritten graph. Its cover otherwise repeats the question cover instructions and constants.
Условие
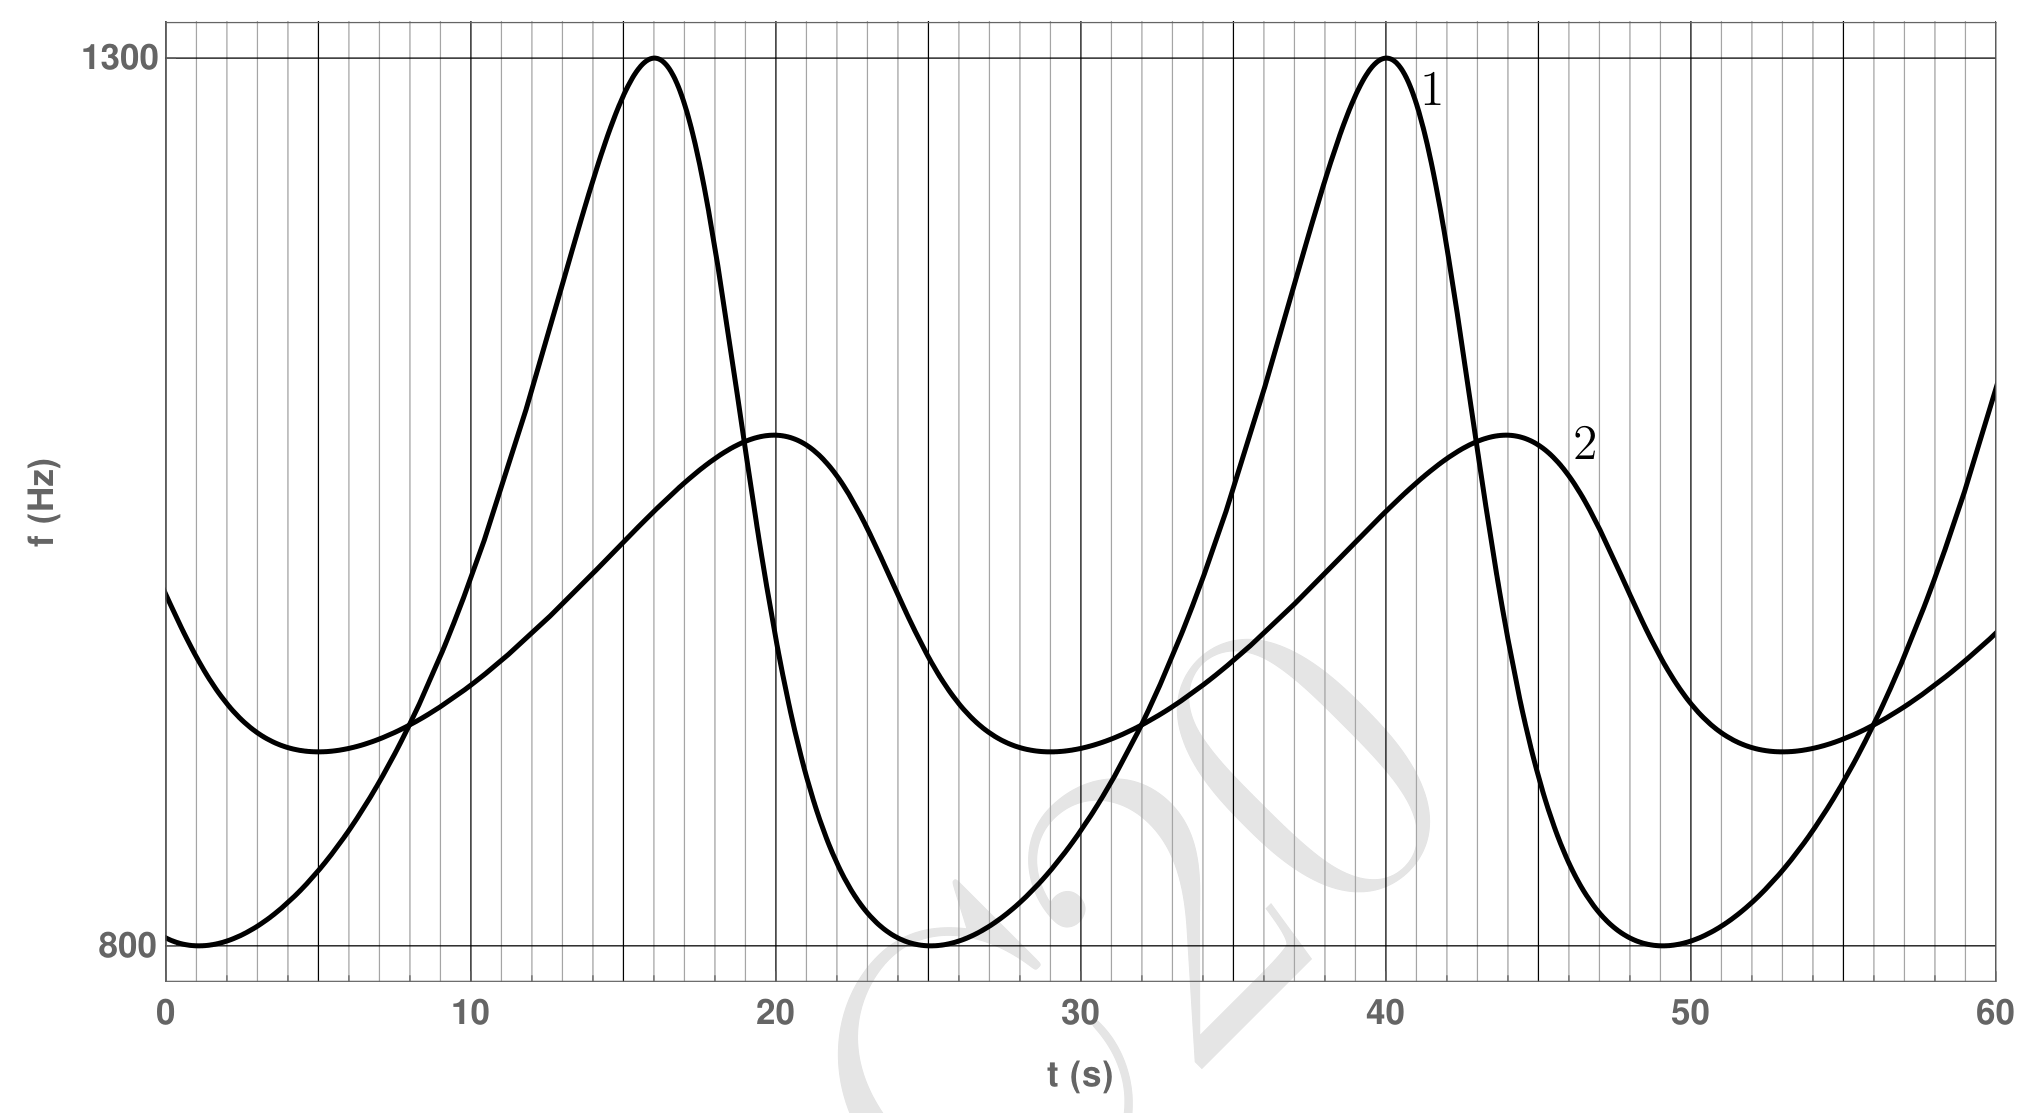
A sound source S is performing uniform circular motion with time period . It is continuously emitting sound of a fixed frequency . Two detectors 1 and 2 are placed somewhere in the same plane as the circular trajectory of the source. The frequency , of the sound received by the two detectors is plotted as a function of time as shown below (the clocks of the two detectors are synchronized).
Take the speed of sound in the medium to be .
a) Determine the time period of the source.
Summary answer box: [blank]. [2 т.]
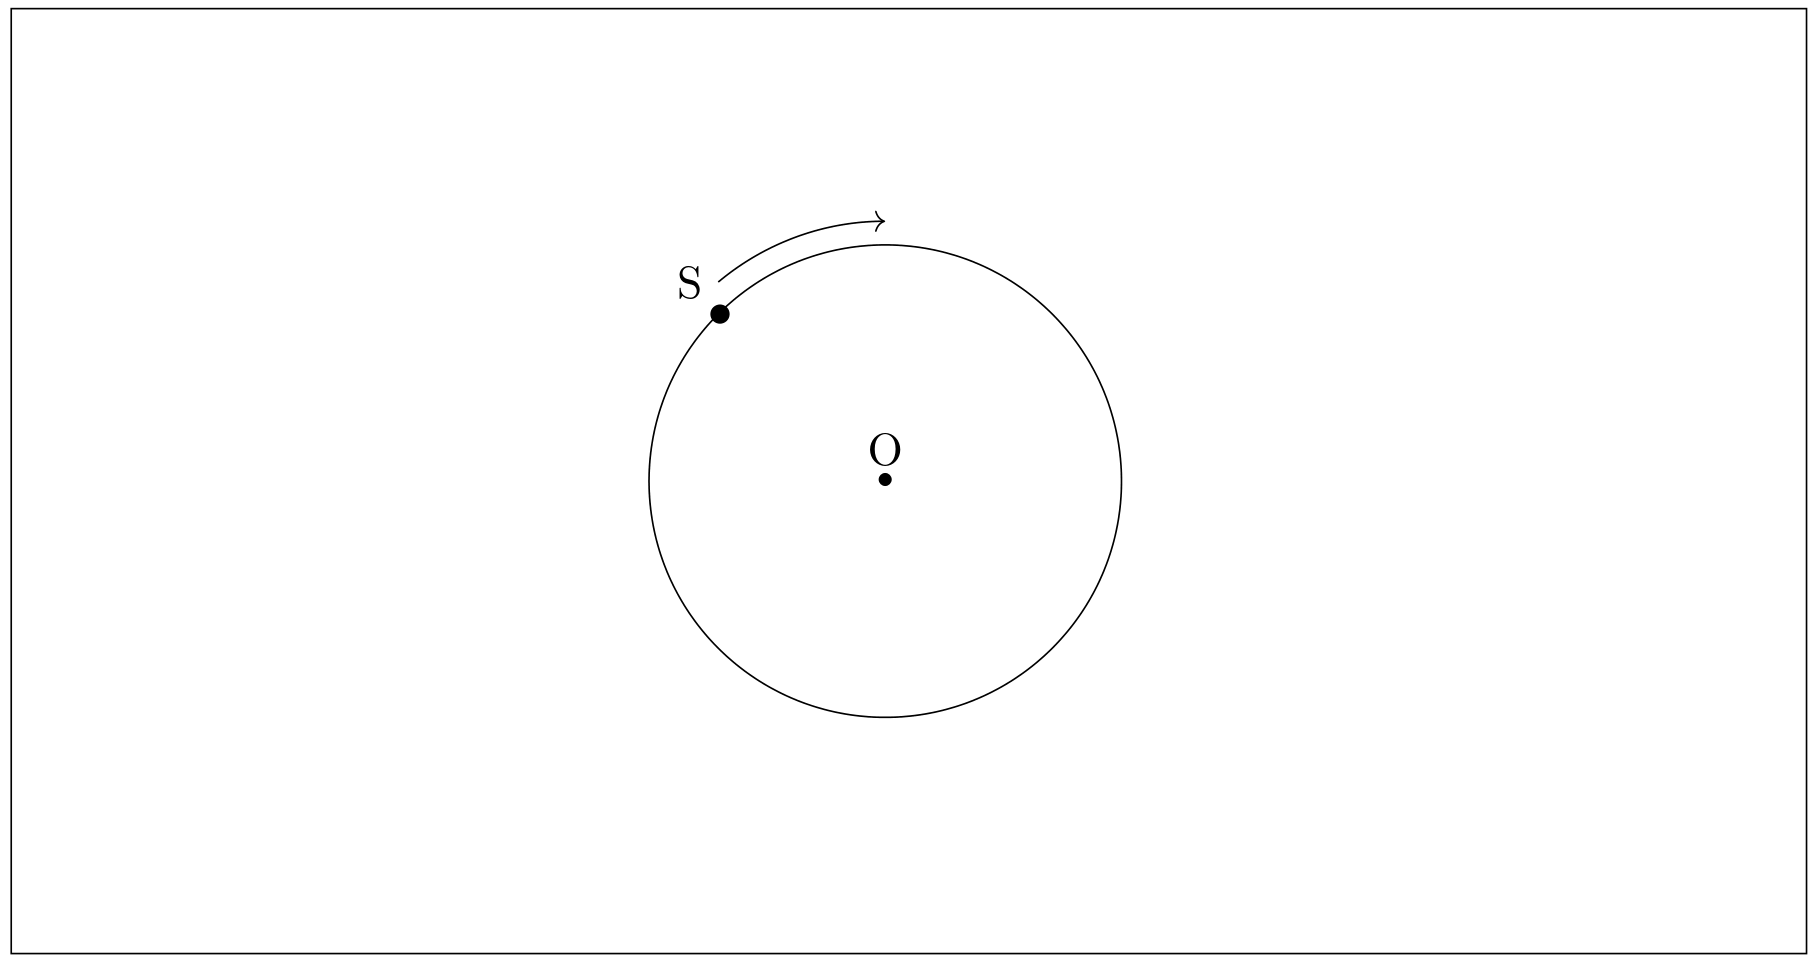
b) The figure below shows the circular trajectory of the source S. Qualitatively mark the positions of both the detectors by indicating 1 and 2. Here O denotes the centre of the trajectory. You must provide detailed justification of your answer in the detailed answer sheet.
[6 т.]
c) Obtain the frequency of the source.
Summary answer box: [blank]. [3 т.]
d) Calculate the distance () between the detectors.
Summary answer box: [blank].
Detailed answers can be found on page numbers: [blank]. [9 т.]
Решение
(a)
Note the time at the peak frequencies of any of the detectors. For detector 1, first peak is at and the second peak is at . Hence the time period of source .
(b)
Couple of things can be easily seen from the graphs:
Time period of the source .
Time difference between the maximum and minimum frequencies detected by detector 1 .
Time difference between the maximum and minimum frequencies detected by detector 2 .
Time difference between the maximum frequencies detected by detector 1 and 2 .
Maximum frequency detected by 1 .
Minimum frequency detected by 1 .
Resolution of the graph is not enough to give the maximum and minimum frequencies detected by the detector 2. Let the source is moving in the circle of radius . There are four possibilities:
- Both detectors are outside the circle.
- Both detectors are inside the circle.
- One detector is inside and other is outside the circle.
- One detector is either inside or outside the circle, and other detector is at .
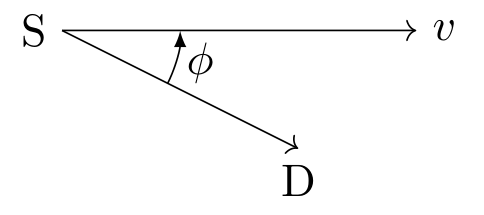
When source is approaching the stationary detector is at an angle , the frequency detected by is
Here is the frequency emitted by the source and is the speed of the sound. If we consider fourth possibility, we should have observed a sharp change in the plot when source is crossing the detector. Hence, we rule out this case.
When the detector is outside the circle (see figure below):
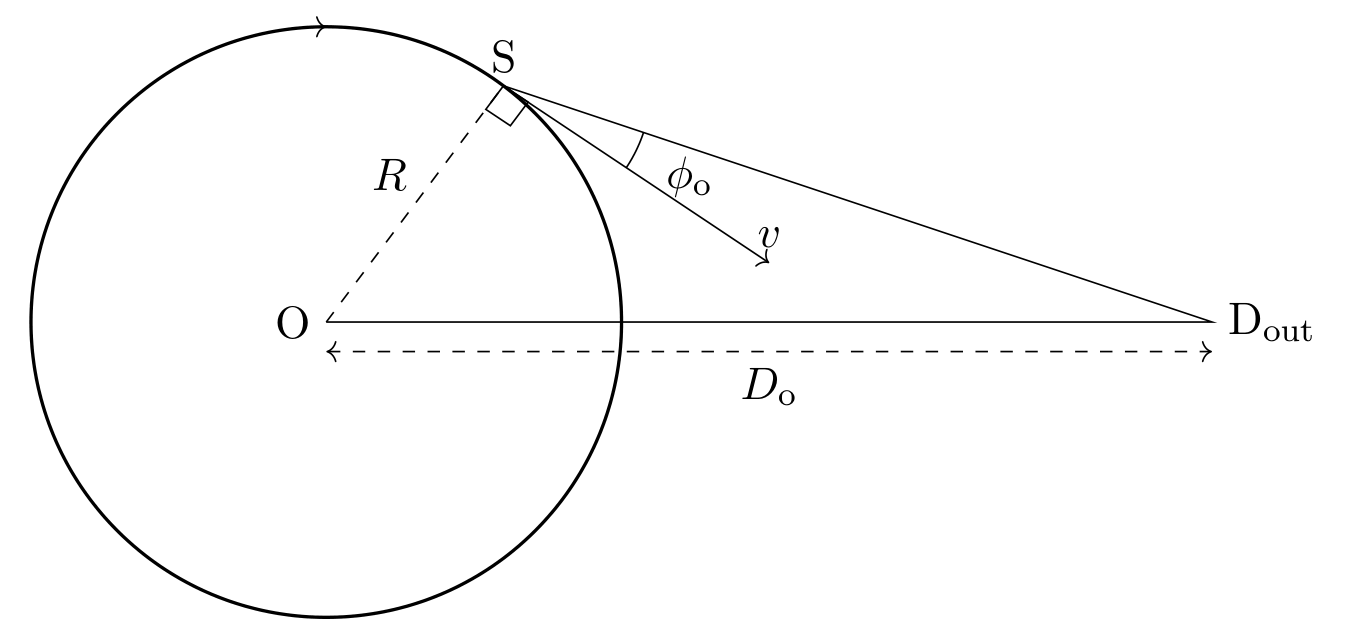
For maximum and minimum frequency, .
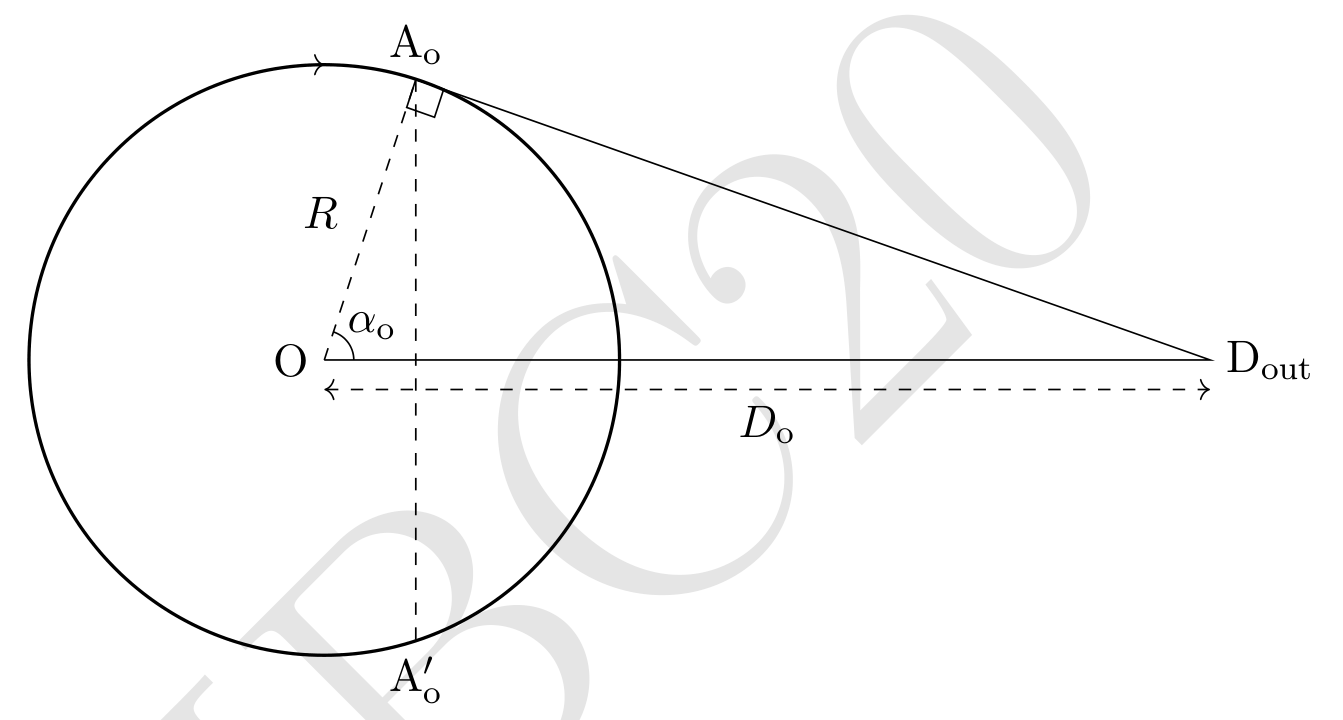
If both the detectors are outside, maximum and minimum frequencies detected by them are same which is not the case if you observe the graph given in the question. Hence, we rule out the first possibility.
When detector is inside the circle (see figure below):
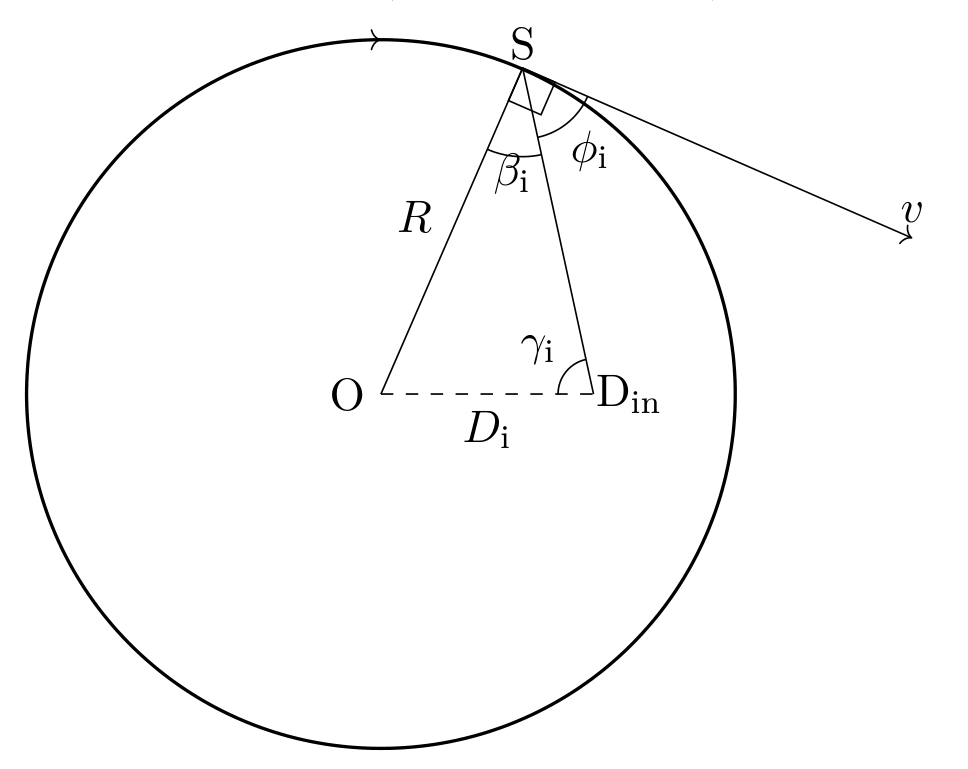
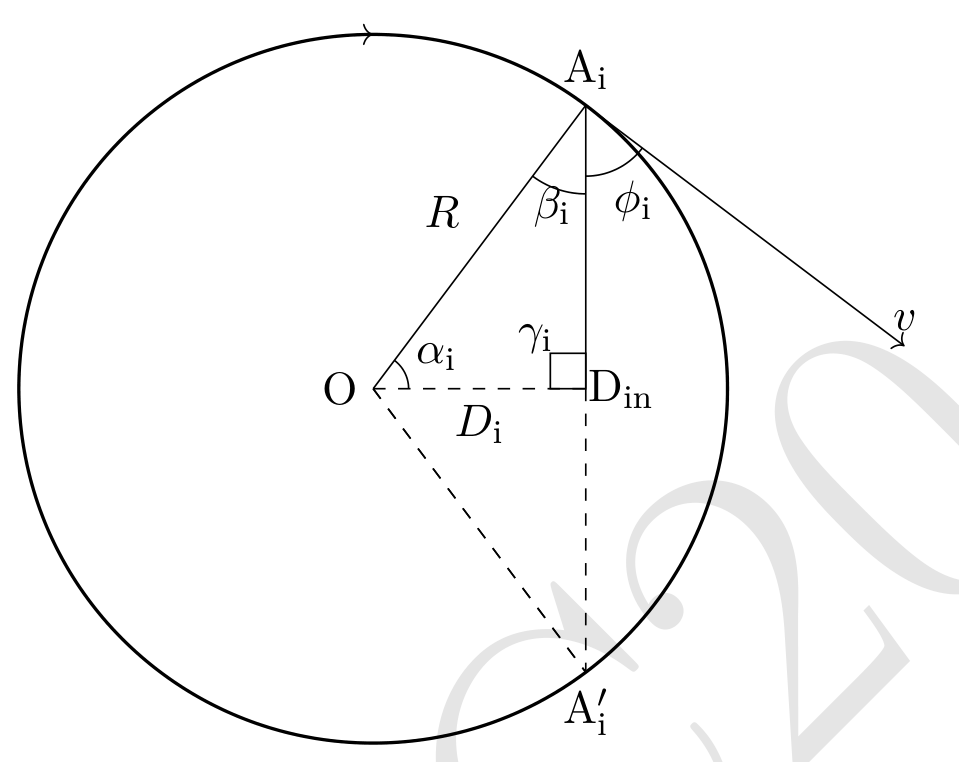
is maximum (minimum) when is ().
If both the detectors are inside, again there are two possibilities: they are at the same distances or at the different distances from the center. In the former case, their observed peak frequencies will be same which is clearly not evident from the given graph. In the latter case, their maximum frequencies will be different but the time difference between the maximum and minimum frequencies will also be different. However from the graph, the time difference between maximum and minimum frequencies for detectors 1 and 2 is
This is possible only if one detector is inside and other detector is outside. Also, detector may not be colinear with the center.
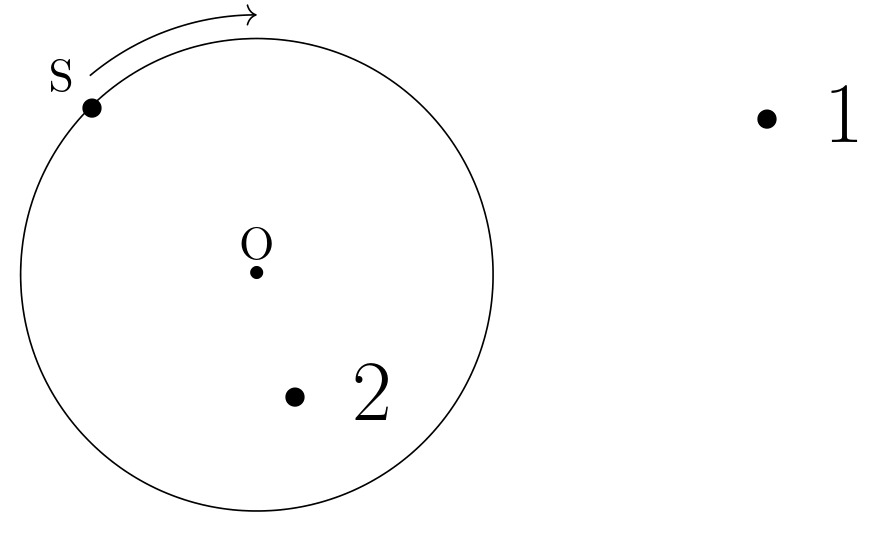
In this part, marking (anywhere) 1 outside and 2 inside the circle with a correct justification will be given full credit.
(c)
From equations (4.1) and (4.2),
(d)
We have to find out , and angle between the detectors. From equations (4.10) and (4.11),
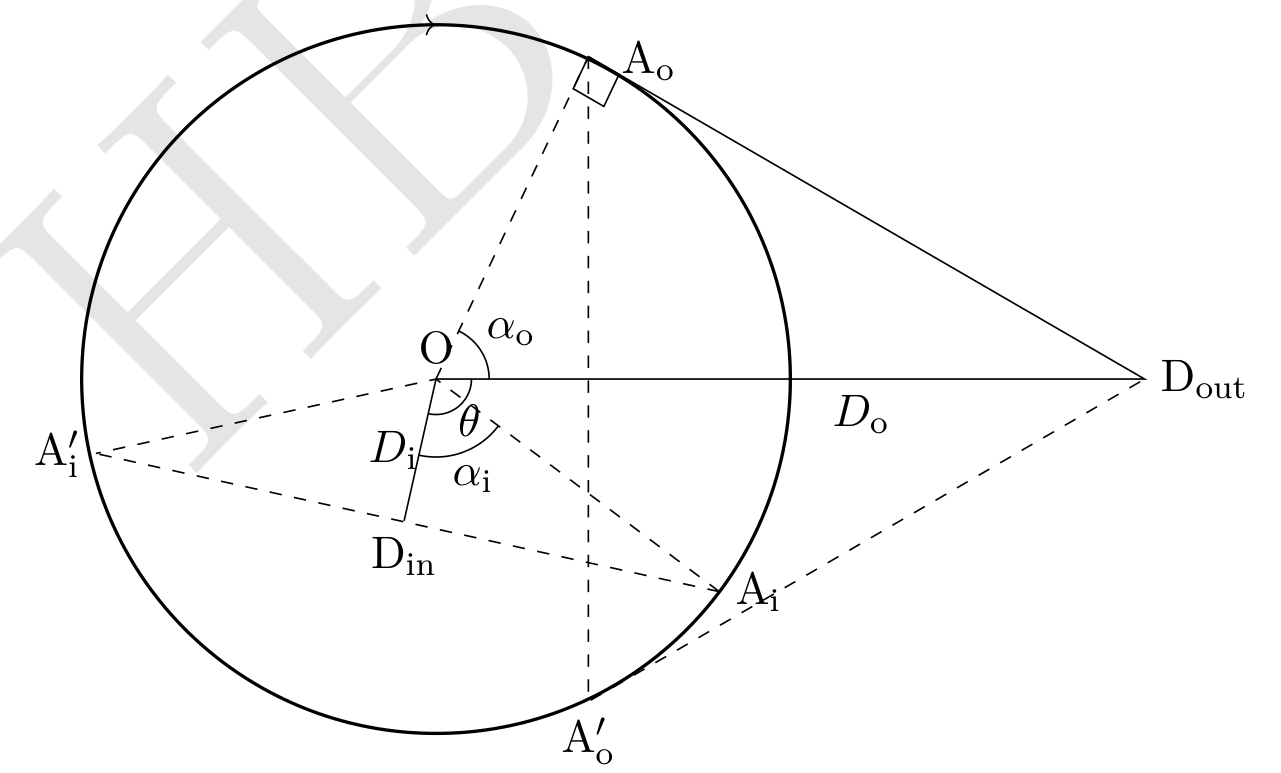
By symmetry, and are equidistant from the detector 1. Similarly, and are equidistant from the detector 2. It takes from to ( and ). Hence
There will be signal delay due to finite and .
Let be the angular separation between the detectors. Time difference between the peak frequencies of detectors 1 and 2 is 4 seconds.
The distance between the detectors .
Оригинал в Архива: INPHO2020-Questions-en.pdf · решение от архива: INPHO2020-Solutions-20200220.pdf