IOAA 2014, Анализ на данни · окончателна тема — Задача 2. Thermodynamic test
8th IOAA · Final data analysis paper
Внимание: Бележка към темата
The final paper is preserved in six photographed sheets. Its three whole problems differ from the preliminary solution booklet: Black Hole is renumbered, Thermodynamic test is separate, and the observer problem replaces seven Big Dipper stars with four Mizar-system stars and adds uncertainty estimates. Applicable key material is distinguished from variant comparisons; absent final-key portions and the missing orbit-plot annex are explicit.
Условие
An hypothetical shuttle is launched to investigate the atmosphere (100% CO) of two extrasolar planets P and P. The atmosphere is in static thermodynamic equilibrium. When the shuttle is near each planet, a radio probe is launched toward respective planet, in vertical direction (in the direction of the planet's radius). When the radio probe reaches constant velocity, it starts sending values of the pressure of the atmosphere. In Fig. 3.1 is plotted the atmospheric pressure values (in arbitrary units) as function of the time of descent for the planet P. When the probe touches the surface of planet P it sends the value of the temperature and the value of the gravitational acceleration .
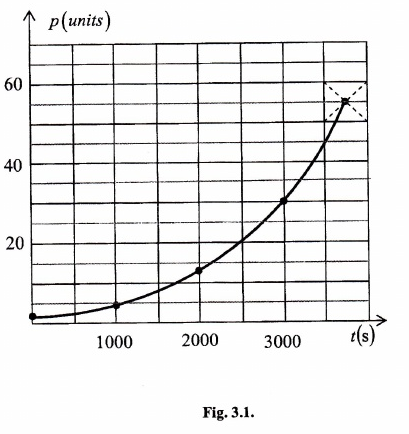
The gravitational acceleration on each planet is assumed to be constant during uniform descent of the radio probes.
a)
Find the altitude from where the radio probe R starts the uniform descent and thus starts the transmitting information.
b)
Find the temperature of planet P at the altitude . You know: The universal gas constant ; the molar mass of CO, .
c)
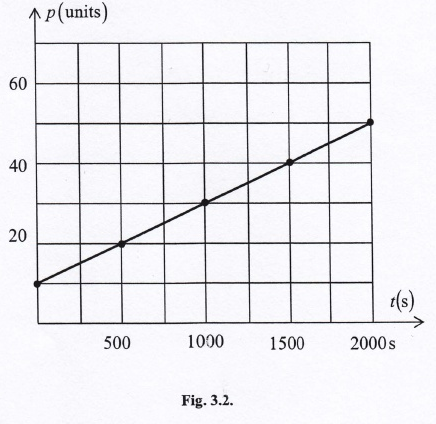
In Fig. 3.2 was plotted the atmospheric pressure values (in arbitrary units) as function of the time of descent of the planet P atmosphere. When the probe touched the surface of the planet P, it sends the value of the temperature and respectively the value of the gravitational acceleration .
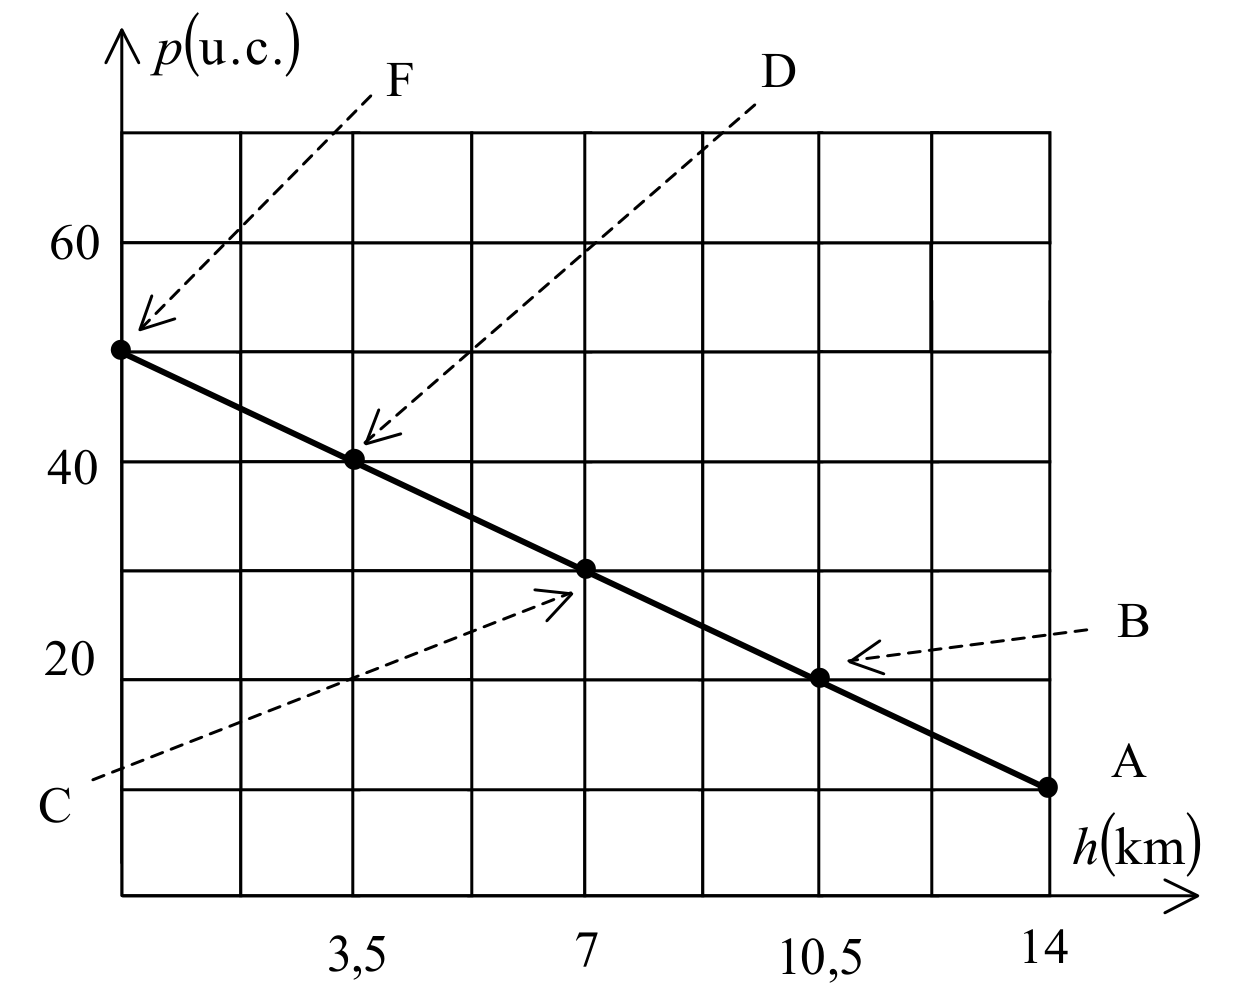
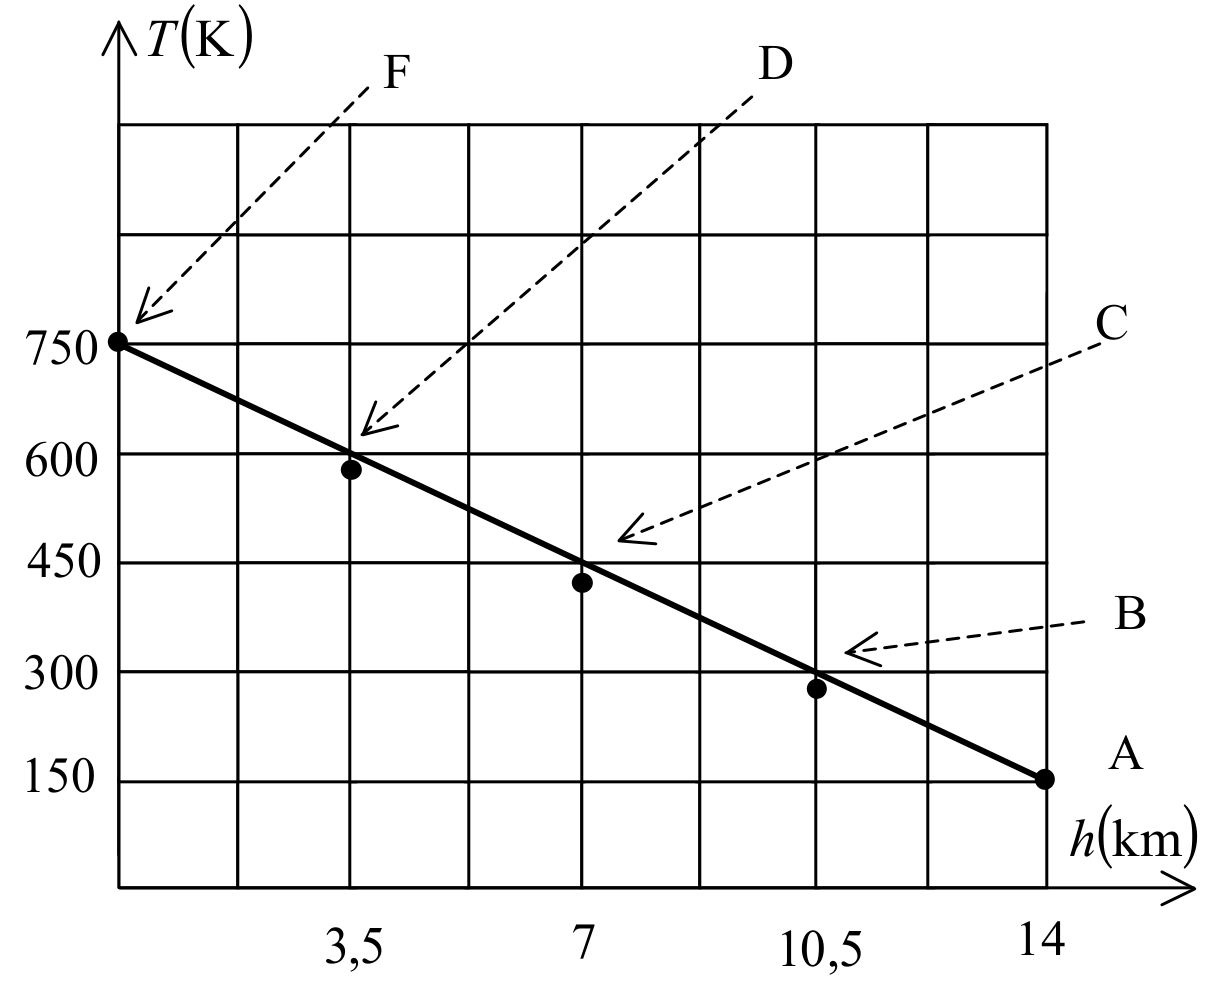
Draw the following dependency graphs for and in the CO atmosphere of the planet P.
Решение
The matching official key is labelled preliminary Problem 3A. Marking scheme: a) 5 points, b) 10 points, c) 10 points. Printed approximations and the inconsistent temperature in the final table are retained.
a) Starting altitude
The pressure and the density of the atmosphere increase with the decrease of the altitude. The pressure at the surface of the planet is .
In figure 1 is represented a thin atmospheric layer with thickness near the surface of the planet P where the atmosphere density can be considered . Inside this layer the pressure and the temperature are variable, reaching the values p and T near the surface.
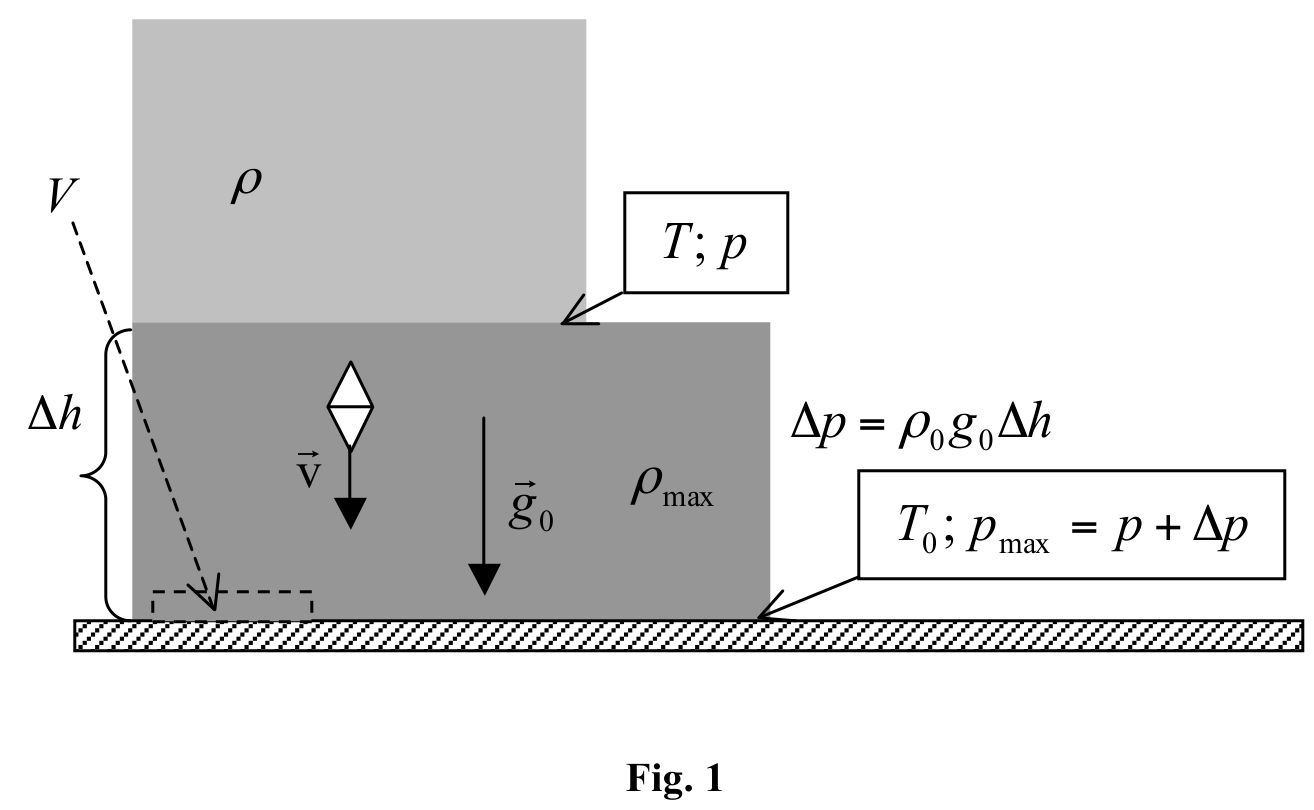
The following relations can be written :
- the variation of the pressure due to the altitude variation , the gravitational acceleration near the surface of planet P;
The superior layer where the density is constant is represented too. At its base the pressure and temperature have the values and respectively .
For a gas volume inside the near surface layer of the atmosphere,near the surface of the planet for mol of de gas according with Mendeleev – Klapeyron law
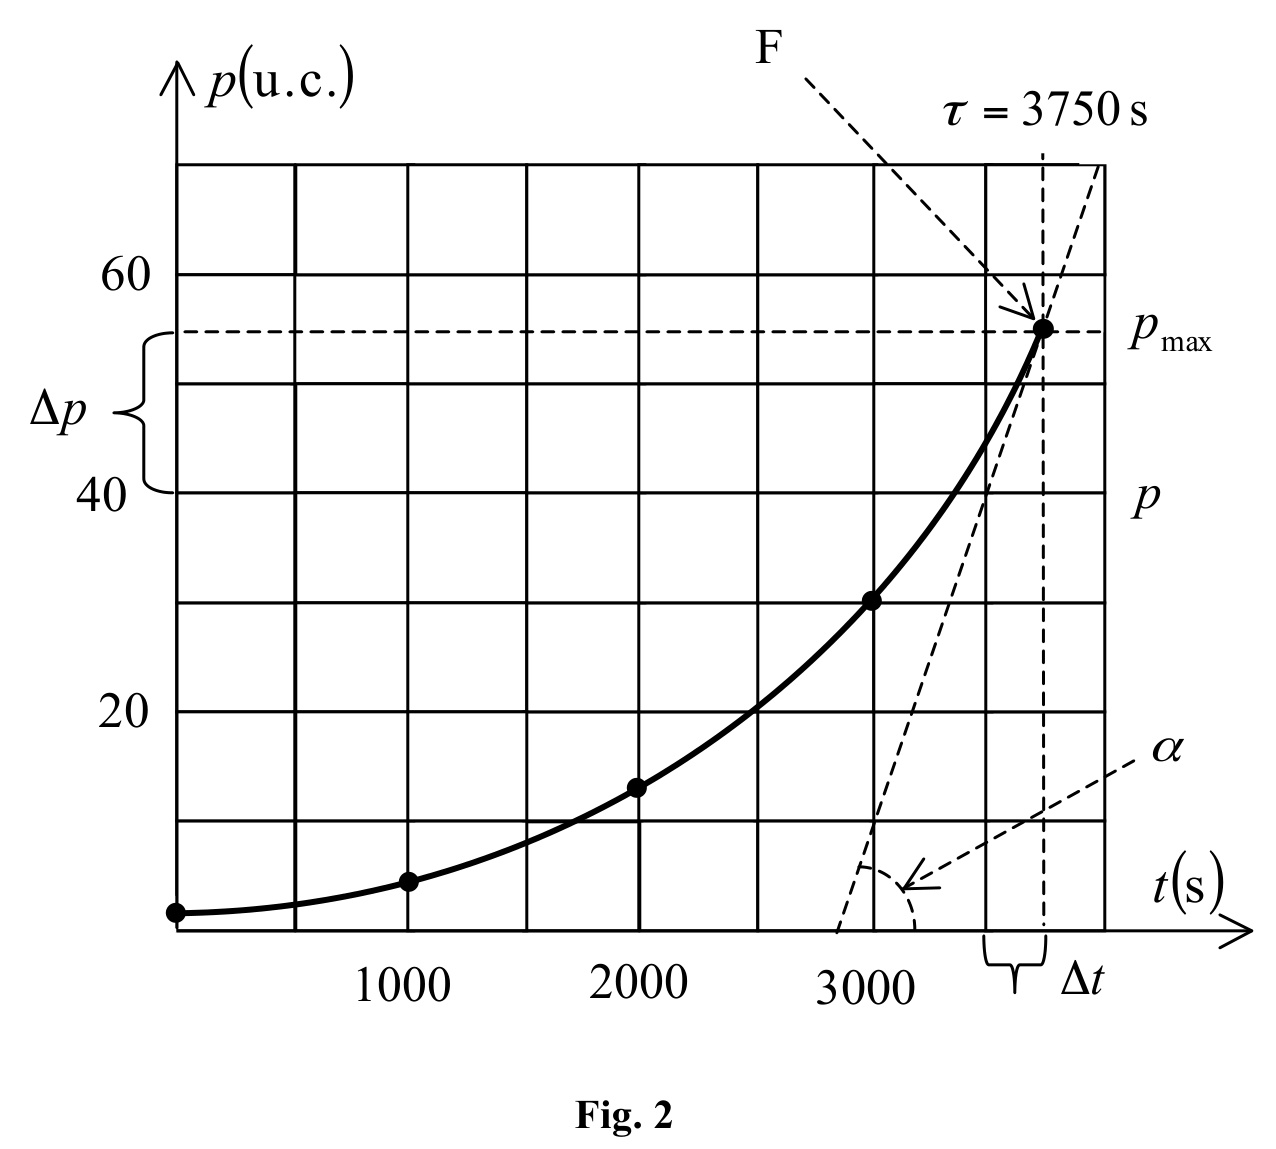
Just before touching the surface of the planet P the radio- probe moves uniformly, so the distance is spend with speed , in time :
Where accordingly to fig .2 in the point F , the trigonometric tangent of is:
The rapport :
Can be determined in the graph in the point F :
b) Temperature at 39.6 km
b) Descending from the initial altitude , with speed , the radio-probe , after 1000 s arrives at the altitude
On Graph at altitude , the atmospheric pressure is ,- see point C on graph.
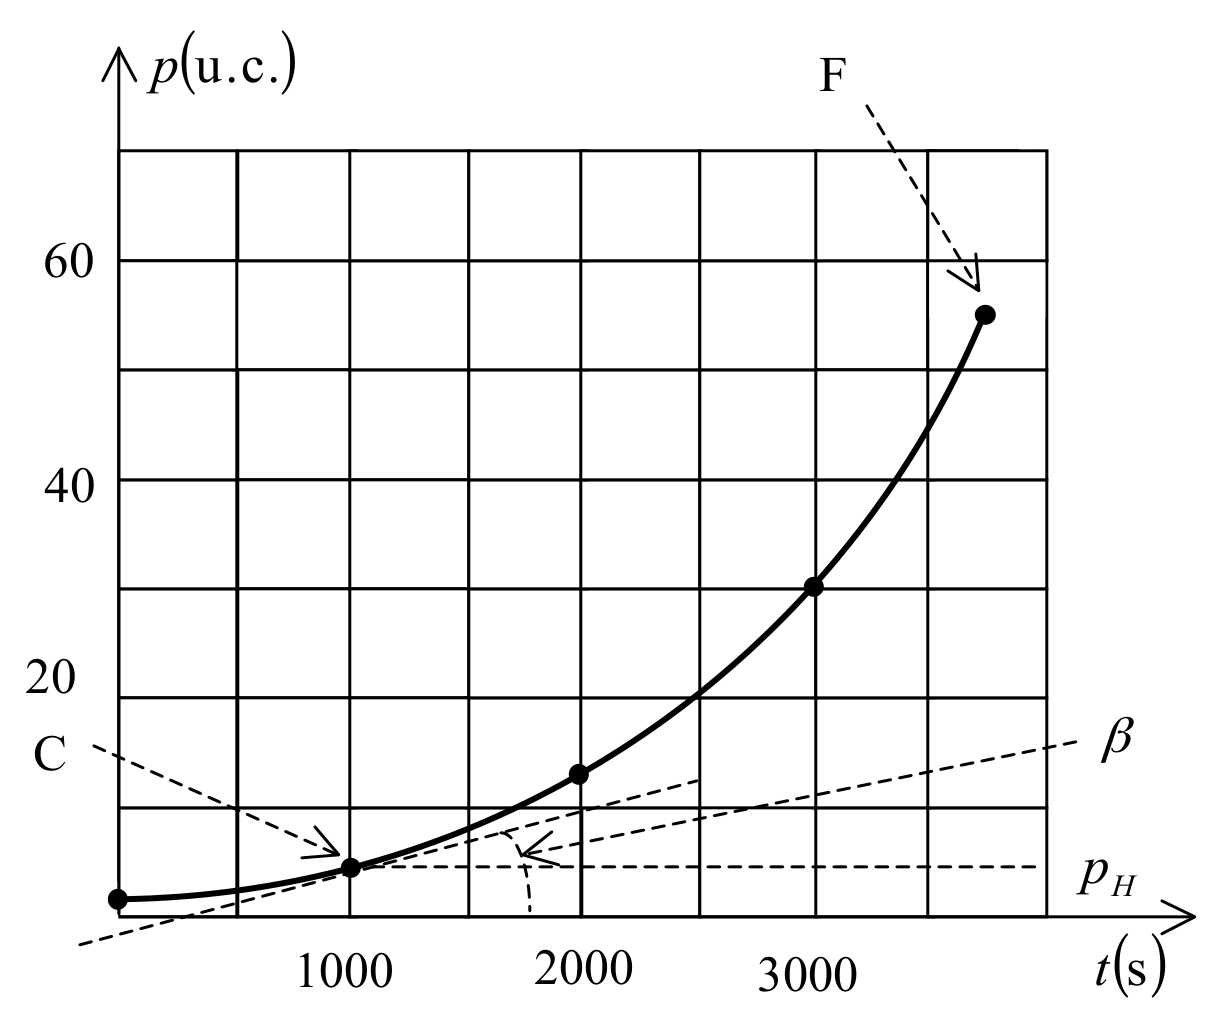
In this point
c) Pressure and temperature on P₂
c) By using the same algorithm, corresponding to the points F, D, C, B şi A in graph on figure 4 :
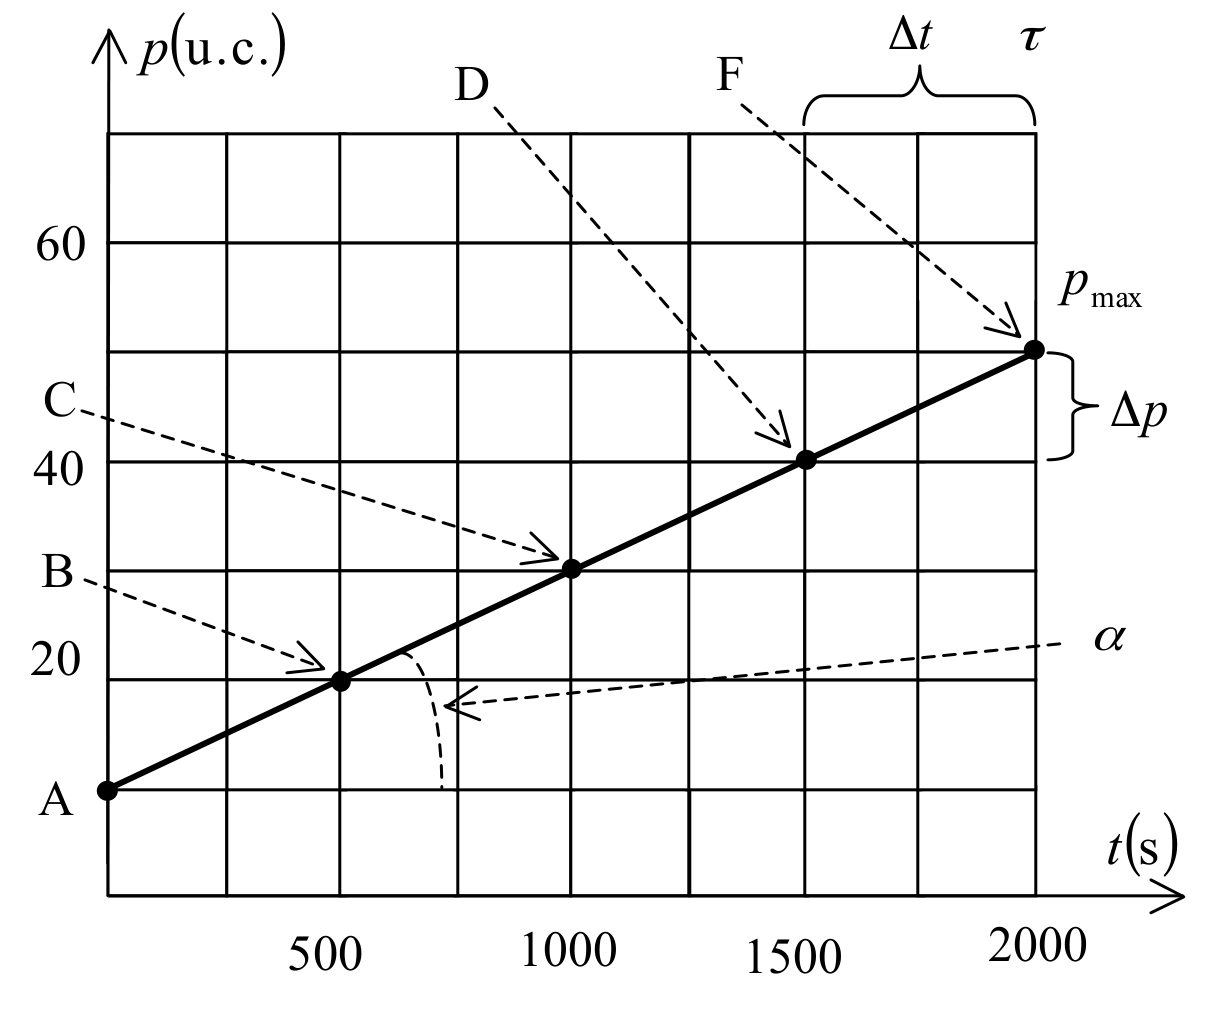
At F, , and .
Thus D has , , .
Thus C has , , .
Thus B has , , .
Thus A has , , .
| Point | t (s) | p (arbitrary units) | h (km) | T (K) |
|---|---|---|---|---|
| A | 0 | 10 | 14 | 148.4 |
| B | 500 | 20 | 10.5 | 296.8 |
| C | 1000 | 30 | 7 | 445.3 |
| D | 1500 | 40 | 3.5 | 593.3 |
| F | 2000 | 50 | 0 | 750 |
Source note: the intermediate calculation prints 593.7 K for D; the final table prints 593.3 K. Both source values are retained.
Оригинал в Архива: ioaa11.jpg · официални решения: DA_Solution.pdf · допълнителни данни: ioaa12.jpg · допълнителни данни: ioaa13.jpg · допълнителни данни: ioaa14.jpg · допълнителни данни: ioaa15.jpg · допълнителни данни: ioaa16.jpg