IOAA 2016, Анализ на данни — Задача 1. Binary Pulsar
Data Analysis Examination · 50 т.
Условие
Through systematic searches during the past decades, astronomers have found a large number of millisecond pulsars (spin period ). Majority of these pulsars are found in binaries, with nearly circular orbits.
For a pulsar in a binary orbit, the measured pulsar spin period () and the measured line-of-sight acceleration () both vary systematically due to orbital motion. For circular orbits, this variation can be described mathematically in terms of orbital phase () as,
where is the orbital period of the binary, is the intrinsic spin period of the pulsar and is the radius of the orbit.
The following table gives one such set of measurements of and at different heliocentric epochs, , expressed in truncated Modified Julian Days (tMJD), i.e. number of days since MJD = 2,440,000.
| No. | T (tMJD) | P (μs) | a (m s) |
|---|---|---|---|
| 1 | 5740.654 | 7587.8889 | - 0.92 ± 0.08 |
| 2 | 5740.703 | 7587.8334 | - 0.24 ± 0.08 |
| 3 | 5746.100 | 7588.4100 | - 1.68 ± 0.04 |
| 4 | 5746.675 | 7588.5810 | + 1.67 ± 0.06 |
| 5 | 5981.811 | 7587.8836 | + 0.72 ± 0.06 |
| 6 | 5983.932 | 7587.8552 | - 0.44 ± 0.08 |
| 7 | 6005.893 | 7589.1029 | + 0.52 ± 0.08 |
| 8 | 6040.857 | 7589.1350 | + 0.00 ± 0.04 |
| 9 | 6335.904 | 7589.1358 | + 0.00 ± 0.02 |
By plotting as a function of , we can obtain a parametric curve. As evident from the relations above, this curve in the period-acceleration plane is an ellipse.
In this problem, we estimate the intrinsic spin period, , the orbital period, , and the orbital radius, , by an analysis of this data set, assuming a circular orbit.
(D1.1) Plot the data, including error bars, in the period-acceleration plane (mark your graph as “D1.1”). [7 т.]
(D1.2) Draw an ellipse that appears to be a best fit to the data (on the same graph “D1.1”). [2 т.]
(D1.3) From the plot, estimate , and , including error margins. [7 т.]
(D1.4) Write expressions for and in terms of , , . [4 т.]
(D1.5) Calculate approximate value of and based on your estimations made in (D1.3), including error margins. [6 т.]
(D1.6) Calculate orbital phase, , corresponding to the epochs of the following five observations in the above table: data rows 1, 4, 6, 8, 9. [4 т.]
(D1.7) Refine the estimate of the orbital period, , using the results in part (D1.6) in the following way:
(D1.7a) First determine the initial epoch, , which corresponds to the nearest epoch of zero orbital phase before the first observation. [2 т.]
(D1.7b) The expected time, , of the estimated orbital phase angle of each observation is given by,
where is the number of full cycle of orbital phases that may have elapsed between and (or ). Estimate and for each of the five observations in part (D1.6). Note down difference between observed and . Enter these calculations in the table given in the Summary Answersheet. [7 т.]
(D1.7c) Plot against (mark your graph as “D1.7”). [4 т.]
(D1.7d) Determine the refined values of the initial epoch, , and the orbital period, . [7 т.]
Отговори
- (D1.3) Pt = (0.67 ± 0.02) μs; P0 = (7588.48 ± 0.02) μs; at = (1.71 ± 0.06) m s⁻²
- (D1.4)
- (D1.5) PB = (1.13 ± 0.05) d; r = (2.74 ± 0.19) × 10⁻³ AU
- (D1.6) 148.62°, 278.77°, 164.57°, 0.00°, 0.00° (rows 1, 4, 6, 8, 9)
- (D1.7a) 5740.189 tMJD
- (D1.7d) T0,r = 5740.179 tMJD; PB,r = 1.1261 d
Решение
(D1.1)
Graph Number : D1.1
- Plot uses more than 50% of graph paper: 0.5
- Axes labels ( and ): 0.5
- Dimensions of axes: 0.5
- Ticks and values on axes (or scale written explicitly): 0.5
- Points correctly plotted:
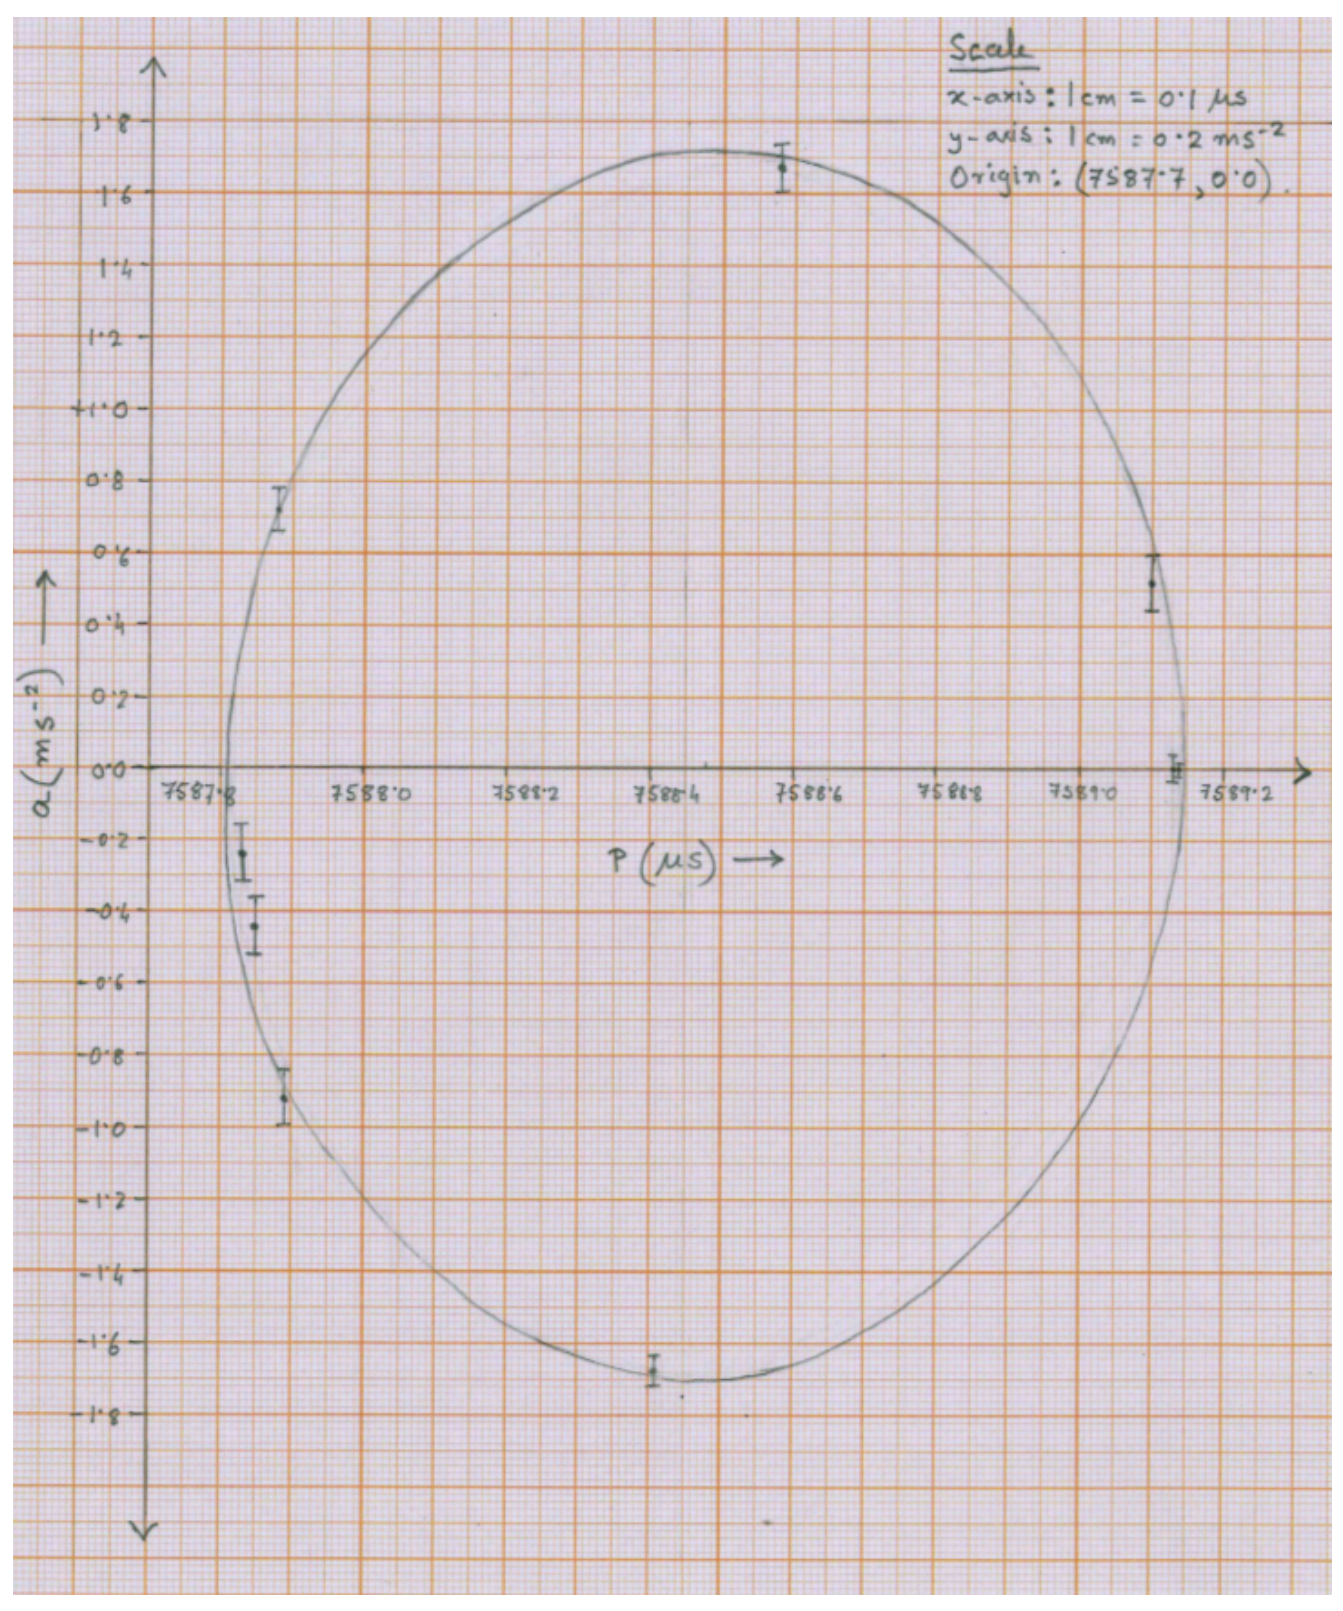
| Points plotted | 9 | 8 | 7 | 6 | 5 | |
|---|---|---|---|---|---|---|
| Marks given | 4.0 | 3.5 | 3.0 | 2.0 | 1.0 | 0 |
Correctness of points: deduction of 0.5 for each wrong point.
- Errorbars on points (at least 5): 1.0
(D1.2)
See above
- Elliptical curve with visual best fit: 1.0
- Curve symmetric about line: 0.5
- Curve symmetric about some value of (): 0.5
(D1.3)
Values are determined from lengths of axes of ellipse and mid-point of -axis.
Error margins may be determined by estimating extreme ellipses covering the points with errorbars. Any reasonable method of estimating error margins will be accepted.
[ on graph]
[2.0]
[2.0]
[ on graph] [3.0]
- Marking table:
| Parameter | Half credit Minimum | Full credit Minimum | Full credit Maximum | Half credit Maximum |
|---|---|---|---|---|
| (μs) | 0.59 | 0.63 | 0.71 | 0.75 |
| (μs) | 0.01 | 0.02 | 0.04 | 0.05 |
| (μs) | 7588.38 | 7588.43 | 7588.53 | 7588.58 |
| (μs) | 0.01 | 0.02 | 0.04 | 0.05 |
| (m s) | 1.61 | 1.65 | 1.77 | 1.81 |
| (m s) | 0.04 | 0.05 | 0.07 | 0.08 |
- Wrong values due to wrong/poor plot/fit in (D1.1) and (D1.2) WILL BE penalised.
- Error estimation is based on graph drawing. Quoted values correspond to the envelope of possible ellipses drawn to include all points with errorbars. Any reasonable method to estimate error to be given credit.
(D1.4)
We can easily recover the orbital period () and the radius of the orbit () in a circular orbit:
[1.0]
[1.0]
[1.0]
[1.0]
Alternative algebraic routes accepted. Each of and carry 2.0 marks.
(D1.5)
[1.0]
[1.0]
[1.0]
[1.0]
[1.0]
[1.0]
Errors in and can be also estimated as maximum possible (worst case) error. In such case, errors would be about 1.5 times the standard error calculated above ().
(D1.6)
Using these newly determined orbital parameters, we can calculate the angular orbital phase for each data point, i.e., for each pair of acceleration and period measured (, ).
Care has to be taken to choose the value of the phase from among , depending on the sign of and .
| Sr. no. | (tMJD) | (μs) | (m s) | |
|---|---|---|---|---|
| 1 | 5740.654 | 7587.8889 | −0.92 | 148.62° |
| 4 | 5746.675 | 7588.5810 | +1.67 | 278.77° |
| 6 | 5983.932 | 7587.8552 | −0.44 | 164.57° |
| 8 | 6040.857 | 7589.1350 | +0.00 | 0.00° |
| 9 | 6335.904 | 7589.1358 | +0.00 | 0.00° |
- Credit for each correct value: 1.0 for first three, 0.5 for last two.
- Credit for or is 0.5 per value.
- All values wrong due to wrong expression for gets a maximum of 1.0 mark.
- Values in radians accepted.
(D1.7a)
[1.0]
[1.0]
Tolerance: tMJD. Using instead of gets zero.
(D1.7b)
where Integer part of .
| Sr. No. | (tMJD) | (MJD) | (days) | ||
|---|---|---|---|---|---|
| 1 | 5740.654 | 148.62° | 0 | 5740.654 | 0.000 |
| 4 | 5746.675 | 278.77° | 5 | 5746.689 | −0.014 |
| 6 | 5983.932 | 164.57° | 216 | 5983.855 | 0.077 |
| 8 | 6040.857 | 0.00° | 267 | 6040.751 | 0.106 |
| 9 | 6335.904 | 0.00° | 529 | 6335.684 | 0.220 |
Deduction for each wrong/missing value of , and : 0.5
No double penalty in one row.
(D1.7c)
Graph Number : D1.7
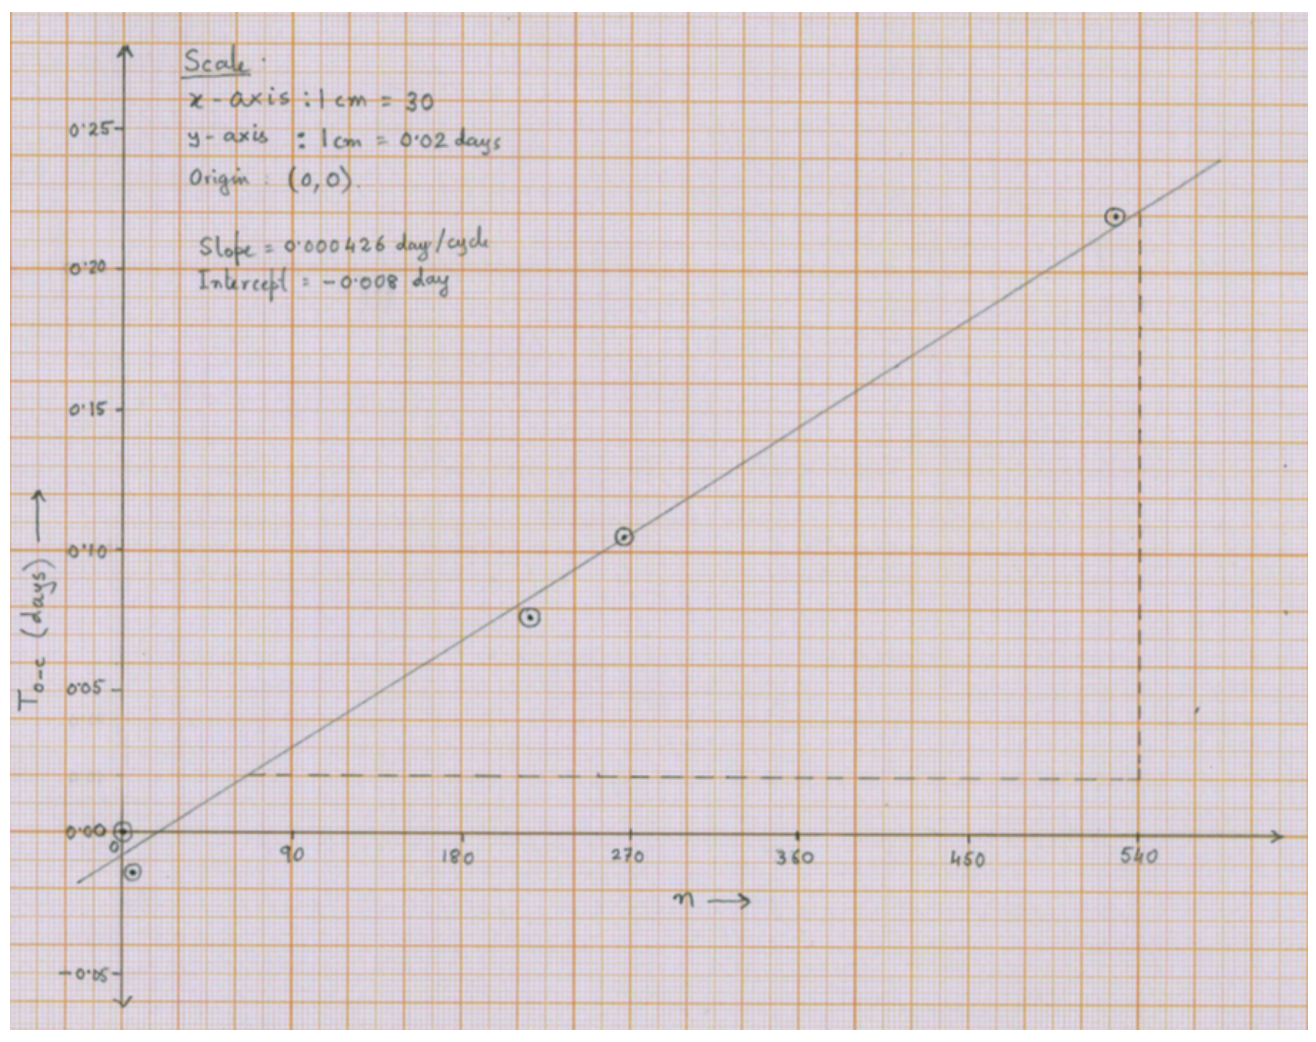
- Plot uses more than 50% of graph paper: 0.5
- Axes labels ( and ) including dimensions: 0.5
- Ticks and values on axes (or scale written explicitly): 0.5
- Points correctly plotted: 0.5 for each point
- Goodness of linear fit credited in next part
(D1.7d)
A linear fit to the plot of vs gives the offset of period per cycle (slope) and the shift in the zero-phase point (intercept). [2.0]
This concept, which may be evident in the subsequent calculation, gains the credit, explicit statement is not necessary.
From a linear fit,
Slope Intercept [3.0]
- Credit for good visual linear fit: 1.0
- Correct values of slope and intercept: 1.0 each
- Tolerance: in slope and in intercept.
[1.0]
[1.0]
Incorrect sign of correction applied carries penalty of 0.5 for each quantity.
Оригинал в Архива: Data-analysis-qp.pdf · официални решения: data_analysis_sol.pdf