IOAA 2018, Анализ на данни — D1. Dust and Young Stars in Star-forming Galaxies
12th International Olympiad on Astronomy and Astrophysics — Data Analysis Competition · 75 т.
Указания
The data analysis competition lasts for 5 hours and is worth a total of 150 points.
Dedicated IOAA Summary Answer Sheets are provided for writing your answers. Enter the final
answers into the appropriate boxes in the corresponding Summary Answer Sheet. On each Answer
Sheet, please fill in
- Student’s Code
Graph Paper is required for your solutions. On each Graph Paper sheet, please fill in
- Student’s Code
- Question no.
- Graph no. and total number of graph paper sheets used.
There are Answer Sheets for carrying out detailed work/rough work. On each Answer Sheet, please
fill in
- Student’s Code
- Question no.
- Page no. and total number of pages.
- Start each problem on a separate Answer Sheet. Please write only on the printed side of the sheet.
Do not use the reverse side. If you have written something on any sheet which you do not want to be marked, cross it out.
- Use as many mathematical expressions as you think may help the graders to better understand your
solutions. The graders may not understand your language. If it is necessary to explain something in words, please use short phrases (if possible in English).
- You are not allowed to leave your working desk without permission. If you need any assistance
(malfunctioning calculator, need to visit a restroom, need more Answer Sheets, Graph Paper etc.), please put up your hand to signal the invigilator.
- The beginning and end of the competition will be indicated by a long sound signal. Additionally,
there will be a short sound signal fifteen minutes before the end of the competition (before the final long sound signal).
- At the end of the competition you must stop writing immediately. Sort and put your Summary
Answer Sheets, Graph Papers, and Answer Sheets in one stack. Put all other papers in another stack.
You are not allowed to take any sheet of paper out of the examination area.
- Wait at your table until your envelope is collected. Once all envelopes are collected, your student
guide will escort you out of the competition room.
- A list of constants is given on the next page.
Table of constants
| Group | Quantity | Value |
|---|---|---|
| Earth | Mass | |
| Earth | Radius | |
| Earth | Acceleration of gravity | |
| Earth | Obliquity of Ecliptic | 23°27′ |
| Earth | Length of Tropical Year | 365.2422 mean solar days |
| Earth | Length of Sidereal Year | 365.2564 mean solar days |
| Earth | Albedo | 0.39 |
| Moon | Mass | |
| Moon | Radius | |
| Moon | Mean Earth-Moon distance | |
| Moon | Orbital inclination with the Ecliptic | 5.14° |
| Moon | Albedo | 0.14 |
| Moon | Apparent magnitude (mean full moon) | −12.74 |
| Sun | Mass | |
| Sun | Radius | |
| Sun | Luminosity | |
| Sun | Absolute Magnitude | 4.80 mag |
| Sun | Surface Temperature | 5772 K |
| Sun | Angular diameter at Earth | 30′ |
| Sun | Orbital velocity in Galaxy | |
| Sun | Distance from Galactic center | 8.5 kpc |
| Physical constants | 1 au | |
| Physical constants | 1 pc | 206265 au |
| Physical constants | Gravitational constant (G) | |
| Physical constants | Planck constant (h) | |
| Physical constants | Boltzmann constant | |
| Physical constants | Stefan-Boltzmann constant | |
| Physical constants | Hubble constant | |
| Physical constants | Speed of light in vacuum | 299792458 m/s |
| Physical constants | Magnetic Permeability of free space | |
| Physical constants | 1 Jansky (Jy) |
Бележки за изданието
The independently archived question and solution PDFs are the source editions used here. D1.4 remains in the questions, answer form and worked key, but the key explicitly marks its 12 marks “discarded”; printed totals of 75 per problem and 150 overall are retained. Section 1.3 calls “unattenuated” although section 1.2 defines it as observed; the source wording is preserved. The answer form labels the mass-function field D2.2.2 and omits a separate orbital-radius field. D2.3.3 calls the curve an upper limit and the curve a lower limit; the official figure places them in the opposite vertical order, as the mass function requires. In the key, equation (19) prints a strict inequality at the radius bound, equation (32) leaves the cgs-to-SI conversion implicit, and the D2.3.4 rubric assigns only four of its printed five marks. These source inconsistencies have not been silently corrected.
The solution PDF repeats an older wording of the questions: replaces , replaces , D1.1.3 explicitly requests least-squares fitting, Table 1 is called UV photometry, and the dex explanation is written . It additionally gives the 21 µJy ALMA limit and explicit redshift-factor hint reproduced with D1.4. Its APOGEE velocities are rounded to 34.85 and 42.57 km/s; its D2.3.2 options are (1) Blue Giant (2) Blue Dwarf (3) Red Giant (4) Red Dwarf (5) Main-Sequence Star (6) White Dwarf. The question edition’s data and five options are retained above; the official answer remains (3) Red Giant.
Условие
As a by-product of the star-forming process in a galaxy, interstellar dust can significantly absorb stellar light in ultraviolet (UV) and optical bands, and then re-emit in far-infrared (FIR), which corresponds to a wavelength range of –.
1.1.
In the UV spectrum of a galaxy, the major contribution is from the light of the young stellar population generated in recent star-formation processes, thus the UV luminosity can act as a reliable tracer of the star-formation rate (SFR) of a galaxy. Since the observed UV luminosity is strongly affected by dust attenuation, extragalactic astronomers define an index called the UV continuum slope () to quantify the shape of the UV continuum:
where is the monochromatic flux of the galaxy at a given wavelength (in the unit of ) and is a scaling constant.
(D1.1.1) AB magnitude is a specific magnitude system. The AB magnitude is defined as:
The AB magnitude of a typical galaxy is roughly constant in the UV band. What is the UV continuum slope of this kind of galaxy? (Hint: ) [6 т.]
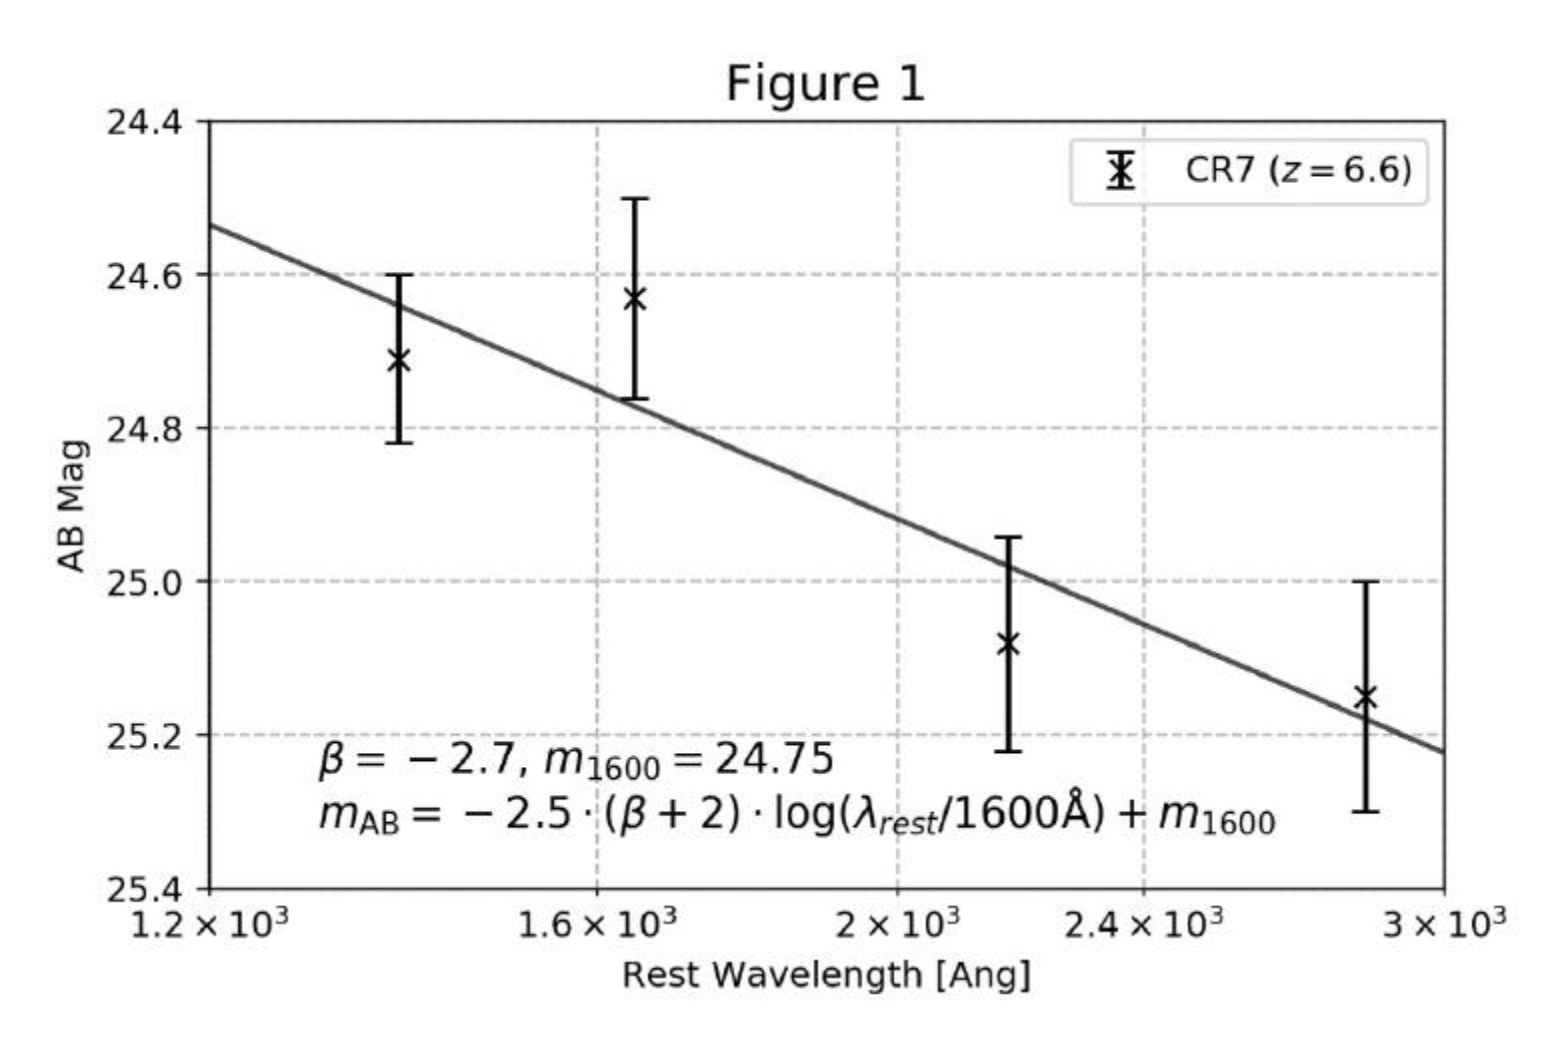
(D1.1.2) Table 1 presents the observed IR photometry results for a galaxy called CR7. Plot the AB magnitude of CR7 versus the logarithm of the rest-frame wavelength on graph paper and labelled as Figure 1. [12 т.]
(D1.1.3) Calculate CR7’s UV slope, plot the best-fit UV continuum on Figure 1 and make a comparison with the results you obtained in (D1.1.1). Is it dustier than the typical galaxy in (D1.1.1)? Please answer with [YES] or [NO]. (Hint: Express as a function of and , where is the AB magnitude at (1600 Å))
Table 1. (Observed Frame) IR Photometry of CR7 at z = 6.60
| Band | Y | J | H | K |
|---|---|---|---|---|
| Central Wavelength (µm) | 1.05 | 1.25 | 1.65 | 2.15 |
| AB Magnitude | 24.71 ± 0.11 | 24.63 ± 0.13 | 25.08 ± 0.14 | 25.15 ± 0.15 |
[5 т.]
1.2.
Under the assumption that dust grains in the galaxy absorb the energy of UV photons and re-emit it by blackbody radiation, the relation between the UV continuum slope (), UV brightness (at 1600 Å) and FIR brightness could be established:
where is the observed far-infrared flux and is the observed flux at rest-frame wavelength 160 nm (1600 Å) (The “flux” is defined as ). Table 2 presents 20 measurements of , and in nearby galaxies (Meurer et al. 1999).
Table 2. UV slope, flux and FIR flux of 20 nearby galaxies
| Galaxy Name | UV Slope | ||
|---|---|---|---|
| NGC4861 | -2.46 | -9.89 | -9.97 |
| Mrk 153 | -2.41 | -10.37 | -10.92 |
| Tol 1924-416 | -2.12 | -10.05 | -10.17 |
| UGC 9560 | -2.02 | -10.38 | -10.41 |
| NGC 3991 | -1.91 | -10.14 | -9.80 |
| Mrk 357 | -1.80 | -10.58 | -10.37 |
| Mrk 36 | -1.72 | -10.68 | -10.94 |
| NGC 4670 | -1.65 | -10.02 | -9.85 |
| NGC 3125 | -1.49 | -10.19 | -9.64 |
| UGC 3838 | -1.41 | -10.81 | -10.55 |
| NGC 7250 | -1.33 | -10.23 | -9.77 |
| NGC 7714 | -1.23 | -10.16 | -9.32 |
| NGC 3049 | -1.14 | -10.69 | -9.84 |
| NGC 3310 | -1.05 | -9.84 | -8.83 |
| NGC 2782 | -0.90 | -10.50 | -9.33 |
| NGC 1614 | -0.76 | -10.91 | -8.84 |
| NGC 6052 | -0.72 | -10.62 | -9.48 |
| NGC 3504 | -0.56 | -10.41 | -8.96 |
| NGC 4194 | -0.26 | -10.62 | -8.99 |
| NGC 3256 | 0.16 | -10.32 | -8.44 |
(D1.2.1) Based on the data given in Table 2, plot the diagram on graph paper and labelled as Figure 2 and find a linear fit to the data. Write down your best-fit equation (i.e. ) by the side of your diagram. [14 т.]
(D1.2.2) Quantify the dispersion (in ‘units’ of dex, where for example, ) between the observed and predicted using the following equation:
[6 т.]
1.3.
Under the previous assumption of the energy transfer process, the ratio of to can be expressed as:
Where is the unattenuated flux and is the dust absorption (in magnitudes) as a function of wavelength .
(D1.3.1) Express as a function of IRX. [6 т.]
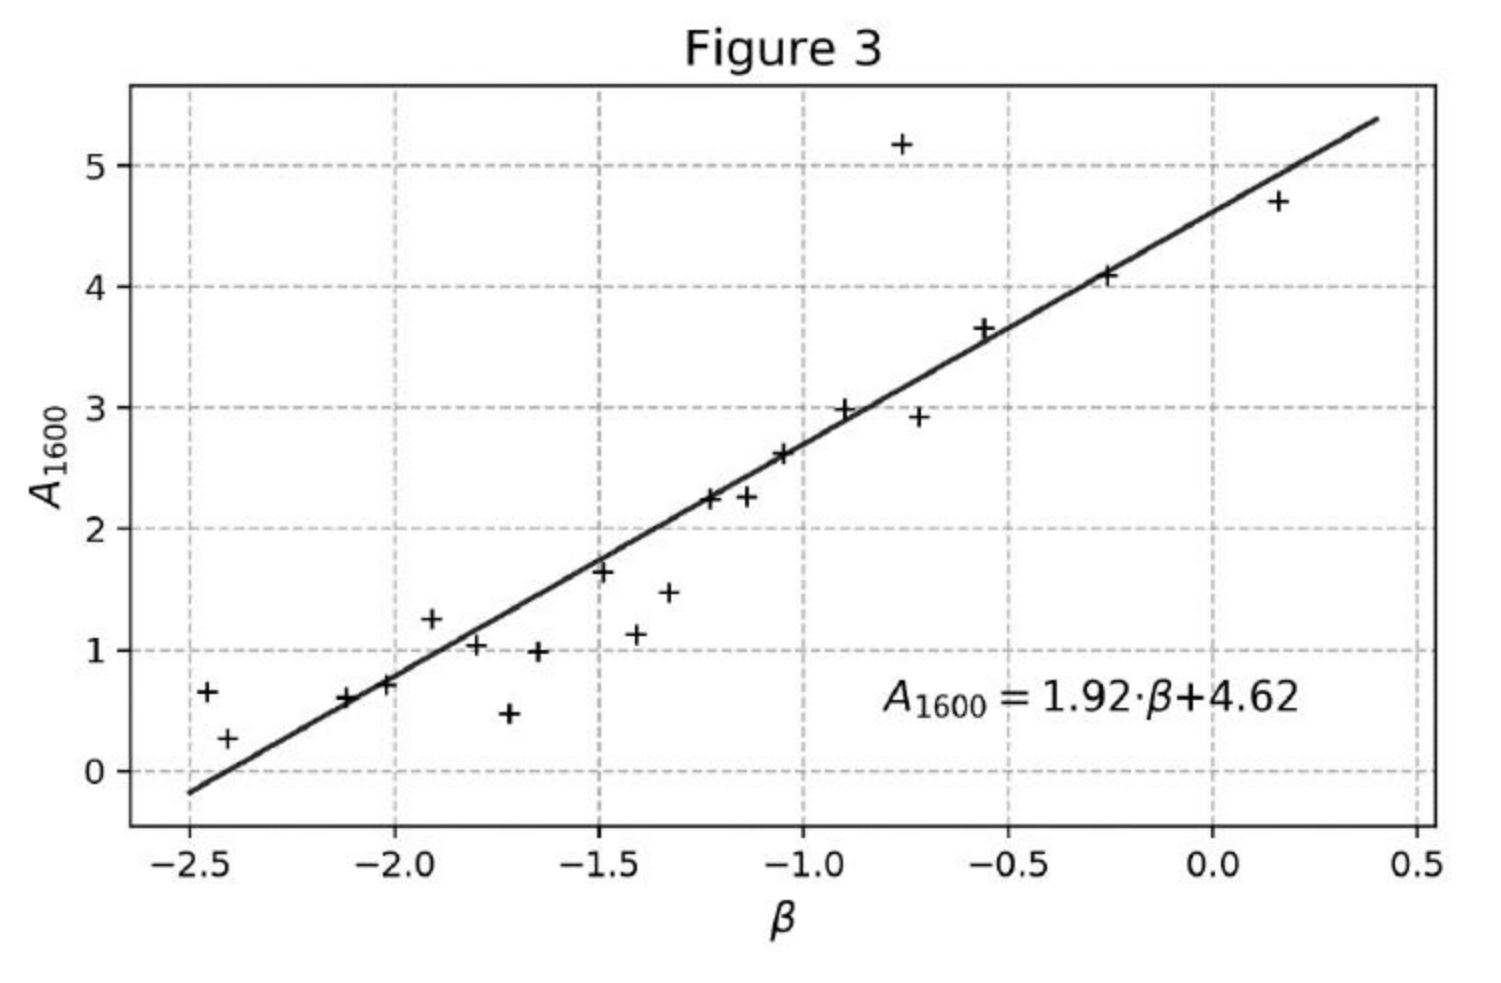
(D1.3.2) Based on Table 2 data and the function of you derived above, plot the diagram on graph paper and label it as Figure 3 and find a linear fit to the data. Write down your best-fit equation (i.e. ) by the side of your diagram. [12 т.]
(D1.3.3) If your linear model in (D1.3.2) is correct, what is the expected UV continuum slope of a dust-free galaxy? [2 т.]
1.4.
After establishing the local relation between UV continuum slope and IRX, we could probably test this empirical law in the high-redshift universe. In 2016, researchers obtained an Atacama Large Millimeter / submillimeter Array (ALMA) observation of CR7, and the FIR continuum corresponded to a upper limit of an FIR flux of .
(D1.4.1) Calculate the IRX of CR7. Is it an upper limit or lower limit?
Hint: here should be written in the form of:
where (1600 Å) and is the observed flux in the rest-frame [6 т.]
(D1.4.2) Is the current observation long enough to show any deviation of CR7 from the relationship you just derived in the local universe? Please answer with [YES] or [NO] on the summary answer sheet, give the IRX difference and show the working used to calculate it on the answer sheet. [6 т.]
Summary Answer Sheet — (D1) Dust and Young Stars in Galaxies
Student’s Code: □□□–□□
(D1.1.1) The UV slope of such a typical galaxy is □;
(D1.1.2) See Figure 1;
(D1.1.3) The UV slope of CR7 is □; [YES] or [NO]? □;
(D1.2.1) See Figure 2; The best-fit Equation is: □;
(D1.2.2) The dispersion is □ dex;
(D1.3.1) as a function of IRX: □;
(D1.3.2) See Figure 3; The Best-fit Equation is: □;
(D1.3.3) Expected UV slope of a dust-free galaxy: □;
(D1.4.1) The IRX of CR7 is □; Here the value is a □ limit (please fill with [upper] or [lower]);
(D1.4.2) Is the current observation deep enough ([YES] or [NO])? □.
Graph Paper
Student’s Code: □□□–□□

Решение
Official solution and grading. Section 1.4 is explicitly marked “discarded” in the official key; its printed questions and worked answers are retained.
1.1. UV continuum slope () [23 marks]
(D1.1.1) The AB magnitude of a typical galaxy is roughly constant, therefore:
Conversion between and could be expressed as:
Therefore, the UV continuum slope should be .
[Equation (2): 3 marks; final result: 3 marks] [6 т.]
(D1.1.2) First of all, we need to convert all the wavelength into rest-frame value, using the definition of redshift:
Thus, the rest-frame wavelength of four bands are listed in the following table:
| Band | Y | J | H | K |
|---|---|---|---|---|
| Rest-frame Wavelength (Å) | 1382 | 1645 | 2171 | 2829 |
The plot is shown as Figure 1. Detailed standards of grading the plot are in the solution of (D1.1.3).
[Equation (3): 2 marks; Correct wavelengths: 2 marks; Figure: 8 marks] [12 т.]
(D1.1.3) Here we can express the AB magnitude of CR7 (UV continuum only) using and :
Here is the AB magnitude at rest-frame 1600 Å (observed-frame ). After writing this out, we can fit the data with a linear function , where the slope . Least squares fitting result is , therefore .
(Note: It is not necessary for examinees to express in the same format as Equation 4. If an examinee derived the correct value of , he or she will get full marks in this part.)
The best-fit UV continuum should be plot as a straight line on Figure 1. [beta: 3 marks]
Grading standard of Figure 1: (1) [1 mark] The figure is large enough on the graph paper (larger than 50% of usable space); (2) [2 marks] horizontal axis is rest-frame wavelength and plotted in log scale; (3) [1 marks] vertical axis is AB magnitude and plotted reversely in linear scale (i.e. brighter magnitude is higher in the panel); (4) [1 mark] Ticks on both axes are properly labeled with suitable spacing; (5) [1 mark] Data points and best-fit continuum are plotted properly; (6) [2 mark] Error bars of data points are presented properly;
Compared to the galaxy in (D1.1), CR7 shows smaller value, indicating its UV continuum is bluer than typical galaxy. Therefore, there should be less dust content in CR7, and the correct answer should be [NO]. [2 marks]
[5 т.]
1.2. UV slope and IRX [20 marks]
(D1.2.1) For the galaxy sample in Table 2, the IRX could be calculated as:
[Equation (5): 1 mark]
Therefore, the final dataset we need for plotting is:
| Galaxy Name | UV Slope | IRX |
|---|---|---|
| NGC4861 | -2.46 | -0.08 |
| Mrk 153 | -2.41 | -0.55 |
| Tol 1924-416 | -2.12 | -0.12 |
| UGC 9560 | -2.02 | -0.03 |
| NGC 3991 | -1.91 | 0.34 |
| Mrk 357 | -1.80 | 0.21 |
| Mrk 36 | -1.72 | -0.26 |
| NGC 4670 | -1.65 | 0.17 |
| NGC 3125 | -1.49 | 0.55 |
| UGC 3838 | -1.41 | 0.26 |
| NGC 7250 | -1.33 | 0.46 |
| NGC 7714 | -1.23 | 0.84 |
| NGC 3049 | -1.14 | 0.85 |
| NGC 3310 | -1.05 | 1.01 |
| NGC 2782 | -0.90 | 1.17 |
| NGC 1614 | -0.76 | 2.07 |
| NGC 6052 | -0.72 | 1.14 |
| NGC 3504 | -0.56 | 1.45 |
| NGC 4194 | -0.26 | 1.63 |
| NGC 3256 | 0.16 | 1.88 |
The plot is shown as Figure 2. Best-fit function is:
[Equation (6): 3 marks; Figure 2: 10 marks]
which should be plotted as a straight line on Figure 2.
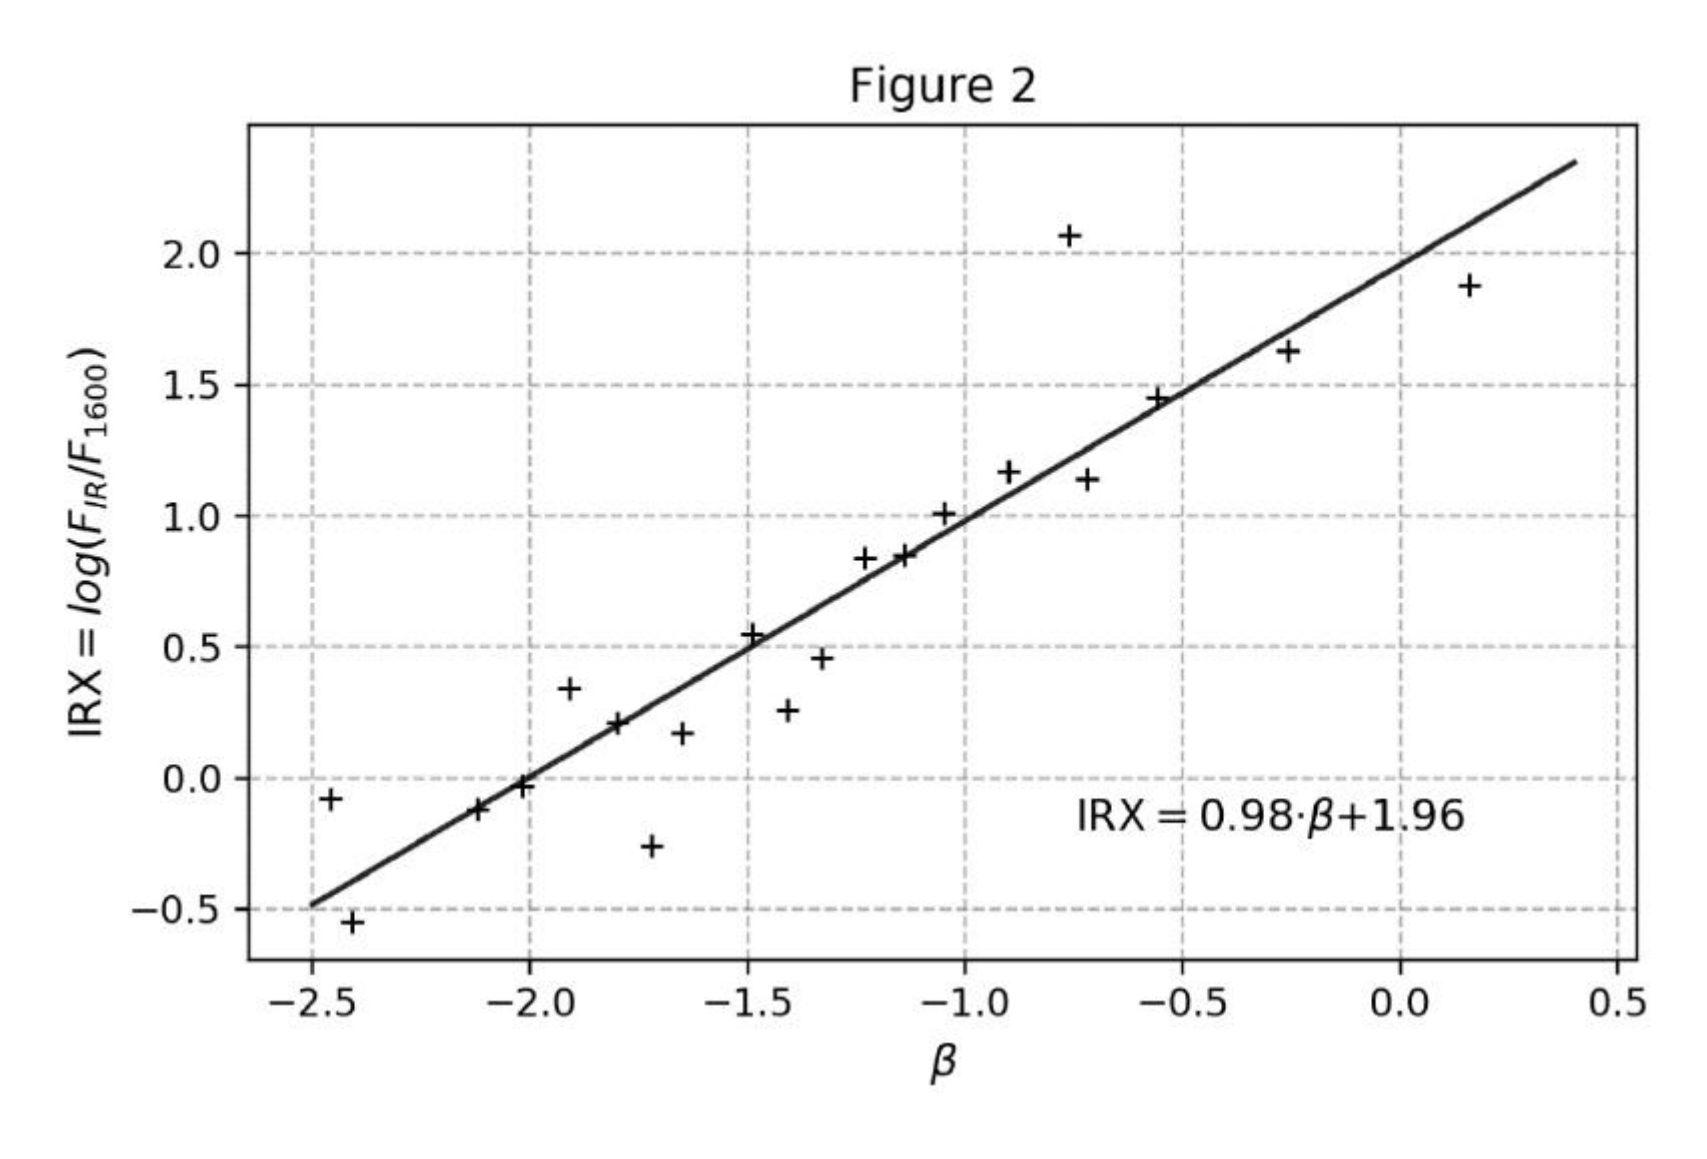
Grading standard of Figure 2: (1) [1 mark] The figure is large enough on the graph paper (larger than 50% of usable space); (2) [2 marks] horizontal axis is , vertical axis is IRX, and both axes are plotted in linear scale; (3) [1 mark] Ticks on both axes are properly labeled with suitable spacing; (4) [5 marks] Data points and best-fit function are plotted properly; (5) [1 mark] Best-fit equation is noted correctly on the same page of Figure 2. [14 т.]
(D1.2.2) With the IRX- relation we derived above, we can calculate the difference between observed IRX and expected value (inferred by ) of each galaxy:
| Name | |||
|---|---|---|---|
| NGC4861 | -0.08 | -0.45 | 0.37 |
| Mrk 153 | -0.55 | -0.40 | -0.15 |
| Tol 1924-416 | -0.12 | -0.12 | 0.00 |
| UGC 9560 | -0.03 | -0.02 | -0.01 |
| NGC 3991 | 0.34 | 0.09 | 0.25 |
| Mrk 357 | 0.21 | 0.20 | 0.01 |
| Mrk 36 | -0.26 | 0.27 | -0.53 |
| NGC 4670 | 0.17 | 0.34 | -0.17 |
| NGC 3125 | 0.55 | 0.50 | 0.05 |
| UGC 3838 | 0.26 | 0.58 | -0.32 |
| NGC 7250 | 0.46 | 0.66 | -0.20 |
| NGC 7714 | 0.84 | 0.75 | 0.09 |
| NGC 3049 | 0.85 | 0.84 | 0.01 |
| NGC 3310 | 1.01 | 0.93 | 0.08 |
| NGC 2782 | 1.17 | 1.08 | 0.09 |
| NGC 1614 | 2.07 | 1.22 | 0.85 |
| NGC 6052 | 1.14 | 1.25 | -0.11 |
| NGC 3504 | 1.45 | 1.41 | 0.04 |
| NGC 4194 | 1.63 | 1.71 | -0.08 |
| NGC 3256 | 1.88 | 2.12 | -0.24 |
Therefore, the dispersion of IRX is:
[Equation (7): 6 marks] [6 т.]
1.3. IRX and : [20 marks]
(D1.3.1) Base on the two assumptions we made in Question (3), we can simplify as:
[Equation (9): 6 marks] [6 т.]
(D1.3.2) Now we can calculate of all the galaxy in Table 2 with Equation 9:
| Name | ||
|---|---|---|
| NGC4861 | -2.46 | 0.66 |
| Mrk 153 | -2.41 | 0.27 |
| Tol 1924-416 | -2.12 | 0.61 |
| UGC 9560 | -2.02 | 0.72 |
| NGC 3991 | -1.91 | 1.26 |
| Mrk 357 | -1.80 | 1.05 |
| Mrk 36 | -1.72 | 0.48 |
| NGC 4670 | -1.65 | 0.99 |
| NGC 3125 | -1.49 | 1.64 |
| UGC 3838 | -1.41 | 1.13 |
| NGC 7250 | -1.33 | 1.47 |
| NGC 7714 | -1.23 | 2.25 |
| NGC 3049 | -1.14 | 2.27 |
| NGC 3310 | -1.05 | 2.63 |
| NGC 2782 | -0.90 | 3.00 |
| NGC 1614 | -0.76 | 5.18 |
| NGC 6052 | -0.72 | 2.93 |
| NGC 3504 | -0.56 | 3.66 |
| NGC 4194 | -0.26 | 4.10 |
| NGC 3256 | 0.16 | 4.71 |
Then we can plot relation as Figure 3. The best-fit equation is:
[Equation (10): 2 marks; Figure 3: 10 marks]
Grading standard of Figure 3: (1) [1 mark] The figure is large enough on the graph paper (larger than 50% of usable space); (2) [2 marks] horizontal axis is , vertical axis is , and both axes are plotted in linear scale; (3) [1 mark] Ticks on both axes are properly labeled with suitable spacing; (4) [5 marks] Data points and best-fit function are plotted properly; (5) [1 mark] Best-fit equation is noted correctly on the same page of Figure 3.
[12 т.]
(D1.3.3) If Equation 10 is correct, then for a dust-free galaxy, the dust attenuation should equal to 0. Therefore, we can derive , which is the expect UV continuum slope of a “dust-free” galaxy.
(Note: The result here is conflict with some observations, for example, the UV slope of CR7 which we just derived. In fact, the linear model here is not necessarily correct and it is just a simplification of complex model: we have made two very rough assumption to derive the relation, and other physical parameters of galaxy, e.g. metallicity, will also influence the overall relation.) [2 т.]
1.4. Extend to high-redshift universe: [12 marks] (discarded)
The problem repeated on solution page 3 additionally states that the FIR continuum was undetected at a upper limit of at rest-frame wavelength (Matthee et al. 2017), corresponding to . Its hint explicitly includes the redshift factor: .
(D1.4.1) Since we have already known the upper limit of of CR7, we only need to derive in order to calculate IRX. First of all, we need to translate the we got in (D 1.3) to :
and we will derive . Therefore:
Thus, the upper limit of CR7’s IRX should be:
[Equation (11), (12), (13): 2 marks respectively] [6 т.]
(D1.4.2) Given the UV continuum slop of CR7 (−2.7), we can infer its expected IRX from the relation in local universe:
The upper limit of observed IRX is 0.18 dex lower than the value predicted by local relation. However, we have already known the local relation has a dispersion of 0.28 dex, which is larger than the 0.18 dex difference. This indicates that the current IRX upper limit is not tight enough (in other words, current observation is not deep enough) to show any difference of CR7 from local galaxies on the diagram of . Therefore, the correct answer should be [NO].
[Equation (14): 2 marks; two IRX difference: 2 marks; [NO]: 2 marks] [6 т.]
Теми и трудност
Трудност: неоценена.
Светлина и астрономически измервания · Звездни величини · Междузвездно поглъщане
Предпоставки: Разширена олимпиадна подготовка
Оригинал в Архива: Data Analysis Problems.pdf · официални решения: Data Analysis Solutions.pdf · допълнителни данни: 18_da.pdf · допълнителни данни: 18_da_anssheet.pdf · допълнителни данни: 18_da_graph.pdf · допълнителни данни: 18_da_graph_log.pdf