IPhO 1984, Теория и експеримент — Задача 2. Problem 2
Problems of the XV International Physics Olympiad (Sigtuna, 1984)
Условие
In certain lakes there is a strange phenomenon called “seiching” which is an oscillation of the water. Lakes in which you can see this phenomenon are normally long compared with the depth and also narrow. It is natural to see waves in a lake but not something like the seiching, where the entire water volume oscillates, like the coffee in a cup that you carry to a waiting guest.
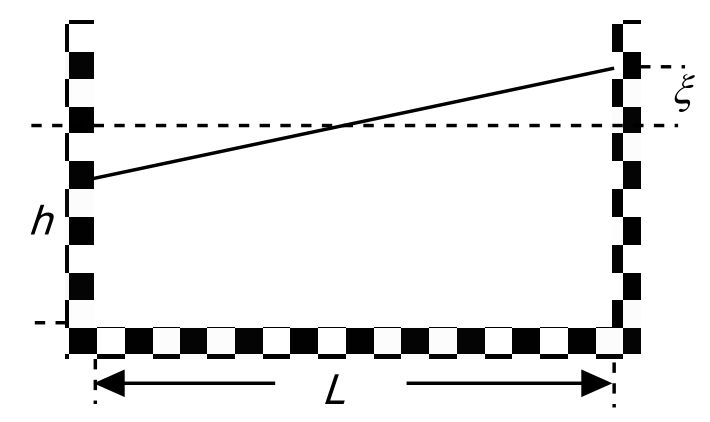
In order to create a model of the seiching we look at water in a rectangular container. The length of the container is and the depth of the water is . Assume that the surface of the water to begin with makes a small angle with the horizontal. The seiching will then start, and we assume that the water surface continues to be plane but oscillates around an axis in the horizontal plane and located in the middle of the container.
Create a model of the movement of the water and derive a formula for the oscillation period . The starting conditions are given in figure above. Assume that . The table below shows experimental oscillation periods for different water depths in two containers of different lengths. Check in some reasonable way how well the formula that you have derived agrees with the experimental data. Give your opinion on the quality of your model.
Table 1. = 479 mm
| / mm | 30 | 50 | 69 | 88 | 107 | 124 | 142 |
|---|---|---|---|---|---|---|---|
| / s | 1.78 | 1.40 | 1.18 | 1.08 | 1.00 | 0.91 | 0.82 |
Table 2. = 143 mm
| / mm | 31 | 38 | 58 | 67 | 124 |
|---|---|---|---|---|---|
| / s | 0.52 | 0.52 | 0.43 | 0.35 | 0.28 |
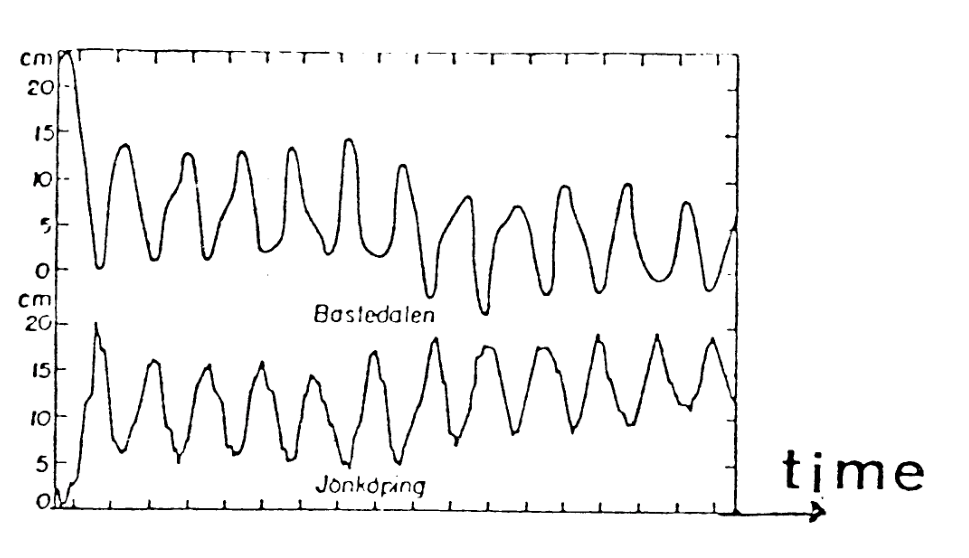
The graph below shows results from measurements in lake Vättern in Sweden. This lake has a length of 123 km and a mean depth of 50 m. What is the time scale in the graph?
Отговори
about 3 hours
Oscillation period of the seiching in Vättern according to the official solution (corrected model, T_experiment ≈ 1.1·Tmodel).
Решение
In the coordinate system of the figure, we have for the centre of mass coordinates of the two triangular parts of the water
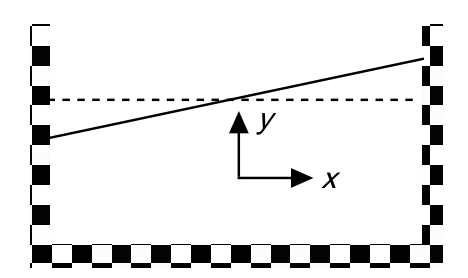
For the entire water mass the centre of mass coordinates will then be
Due to that the component is quadratic in will be much much smaller than the component.
The velocities of the water mass are
and again the vertical component is much smaller the the horizontal one.
We now in our model neglect the vertical components. The total energy (kinetic + potential) will then be
For a harmonic oscillator we have
Identifying gives
Comparing with the experimental data we find , our model gives a slight underestimation of the oscillation period.
Applying our corrected model on the Vättern data we have that the oscillation period of the seiching is about 3 hours.
Many other models are possible and give equivalent results.
Оригинал в Архива: ipho84.pdf