IPhO 2008, Експеримент — Задача 1. B. Task 1: Finding the temperature of solidification of a crystalline substance
39th International Physics Olympiad - Hanoi - Vietnam - 2008 · Experimental Problem · DIFFERENTIAL THERMOMETRIC METHOD
Условие
DIFFERENTIAL THERMOMETRIC METHOD
In this problem, we use the differential thermometric method to fulfill the two following tasks:
- Finding the temperature of solidification of a crystalline solid substance.
- Determining the efficiency of a solar cell.
A. Differential thermometric method
In this experiment forward biased silicon diodes are used as temperature sensors to measure temperature. If the electric current through the diode is constant, then the voltage drop across the diode depends on the temperature according to the relation
where and are respectively the voltage drops across the diode at temperature and at room temperature (measured in °C), and the factor
The value of may vary slightly from diode to diode.
If two such diodes are placed at different temperatures, the difference between the temperatures can be measured from the difference of the voltage drops across the two diodes. The difference of the voltage drops, called the differential voltage, can be measured with high precision; hence the temperature difference can also be measured with high precision. This method is called the differential thermometric method. The electric circuit used with the diodes in this experiment is shown in Figure 1. Diodes D and D are forward biased by a 9V battery, through 10 kΩ resistors, and . This circuit keeps the current in the two diodes approximately constant.
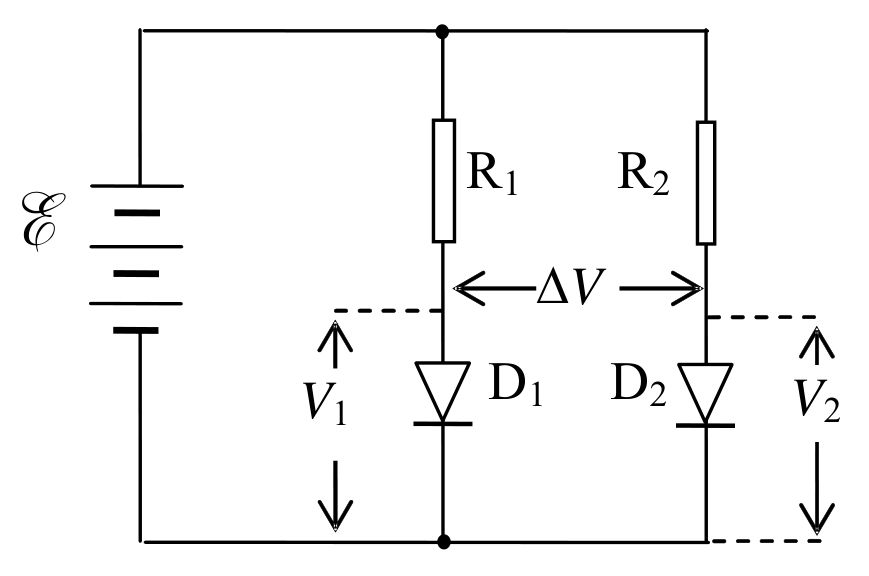
If the temperature of diode D is and that of D is , then according to (1), we have:
and
The differential voltage is:
in which . By measuring the differential voltage , we can determine the temperature difference.
To bias the diodes, we use a circuit box, the diagram of which is shown in Figure 2.
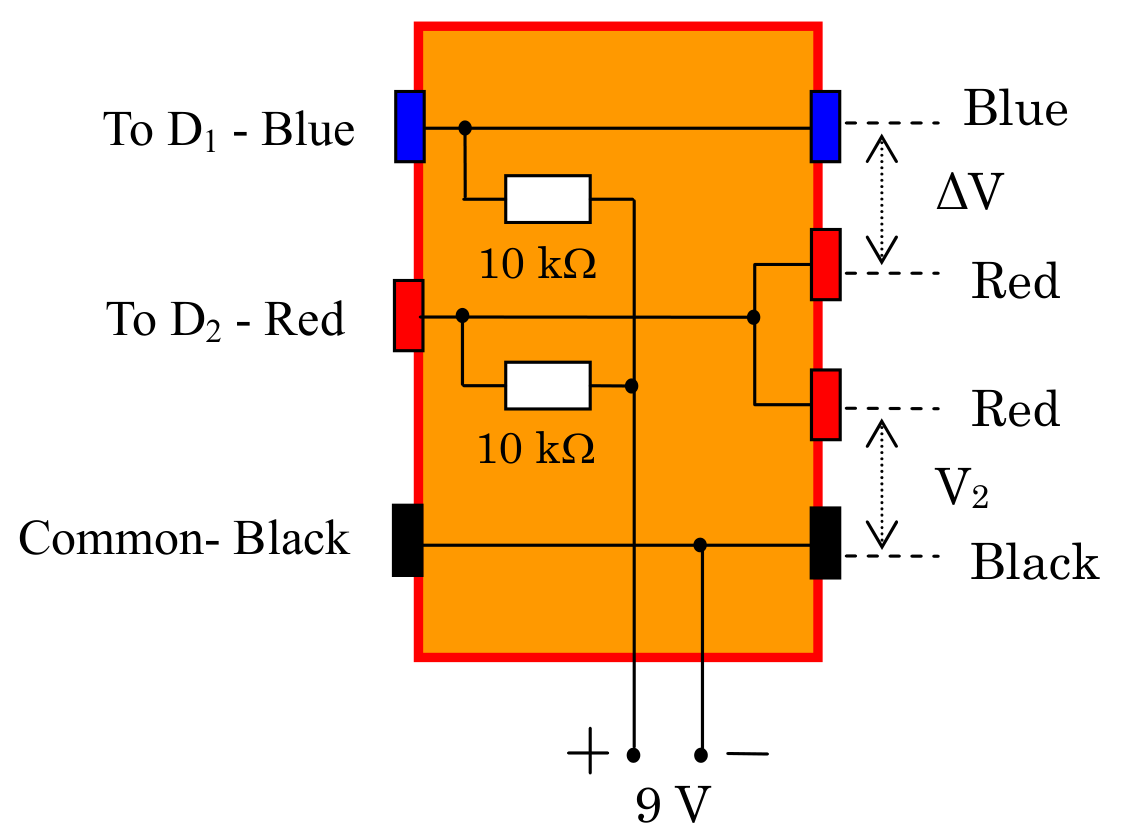
The circuit box contains two biasing resistors of 10 kΩ for the diodes, electrical leads to the 9 V battery, sockets for connecting to the diodes D and D, and sockets for connecting to digital multimeters to measure the voltage drop on diode D and the differential voltage of the diodes D and D.
1. Aim of the experiment
If a crystalline solid substance is heated to the melting state and then cooled down, it solidifies at a fixed temperature , called temperature of solidification, also called the melting point of the substance. The traditional method to determine is to follow the change in temperature with time during the cooling process. Due to the fact that the solidification process is accompanied by the release of the latent heat of the phase transition, the temperature of the substance does not change while the substance is solidifying. If the amount of the substance is large enough, the time interval in which the temperature remains constant is rather long, and one can easily determine this temperature. On the contrary, if the amount of substance is small, this time interval is too short to be observed and hence it is difficult to determine .
In order to determine in case of small amount of substance, we use the differential thermometric method, whose principle can be summarized as follows. We use two identical small dishes, one containing a small amount of the substance to be studied, called the sample dish, and the other not containing the substance, called the reference dish. The two dishes are put on a heat source, whose temperature varies slowly with time. The thermal flows to and from the two dishes are nearly the same. Each dish contains a temperature sensor (a forward biased silicon diode). While there is no phase change in the substance, the temperature of the sample dish and the temperature of the reference dish vary at nearly the same rate, and thus varies slowly with . If there is a phase change in the substance, and during the phase change does not vary and equals , while steadily varies, then varies quickly. The plot of versus shows an abrupt change. The value of corresponding to the abrupt change of is indeed .
The aim of this experiment is to determine the temperature of solidification of a pure crystalline substance, having in the range from 50°C to 70°C, by using the traditional and differential thermal analysis methods. The amount of substance used in the experiment is about 20 mg.
2. Apparatus and materials
- The heat source is a 20 W halogen lamp.
- The dish holder is a bakelite plate with a square hole in it. A steel plate is fixed on the hole. Two small magnets are put on the steel plate.
- Two small steel dishes, each contains a silicon diode soldered on it. One dish is used as the reference dish, the other - as the sample dish.
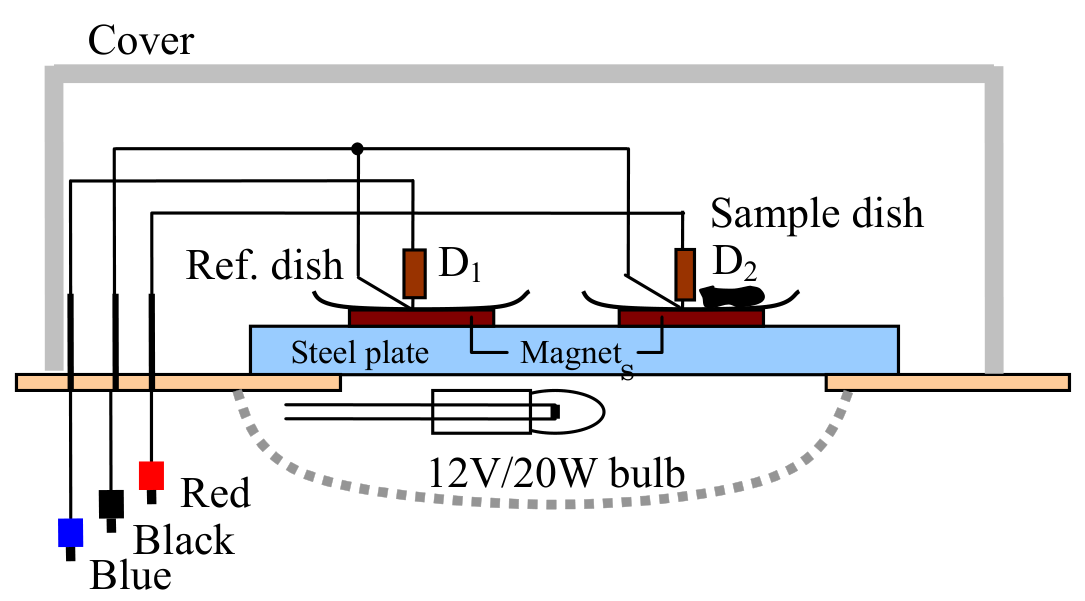
Each dish is placed on a magnet. The magnetic force maintains the contact between the dish, the magnet and the steel plate. The magnets also keep a moderate thermal contact between the steel plate and the dishes.
A grey plastic box used as a cover to protect the dishes from the outside influence.
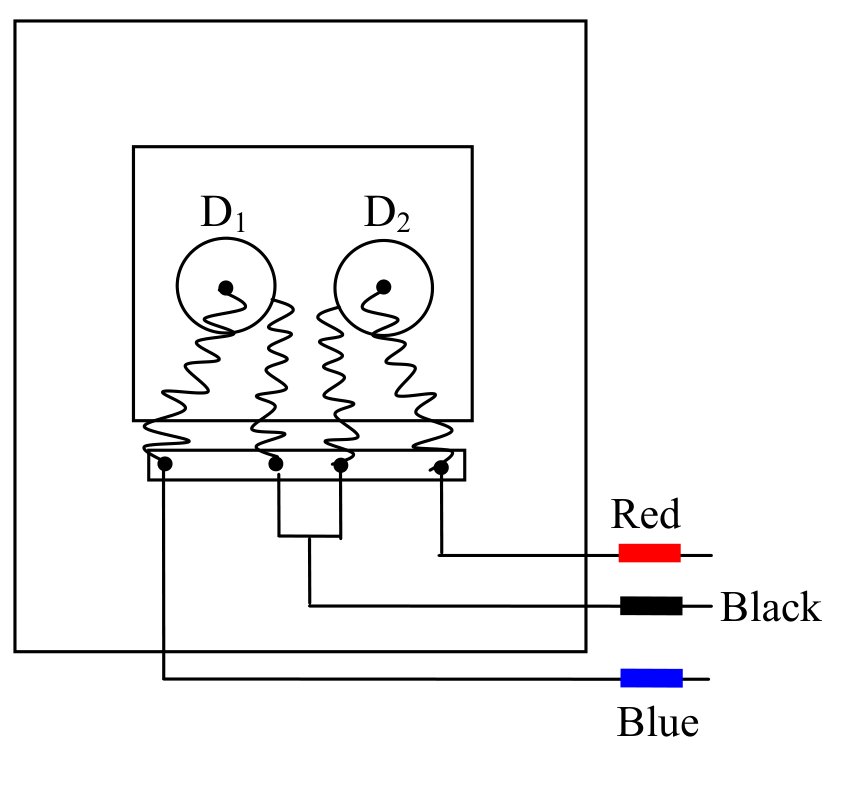
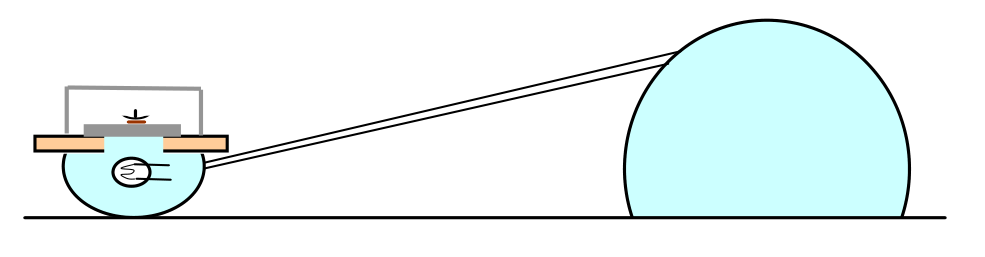
Figure 3 shows the arrangement of the dishes and the magnets on the dish holder and the light bulb.
- Two digital multimeters are used as voltmeters. They can also measure room temperature by turning the Function selector to the ‘’°C/°F” function. The voltage function of the multimeter has an error of ±2 on the last digit.
Note: to prevent the multimeter (see Figure 9) from going into the “Auto power off” function, turn the Function selector from OFF position to the desired function while pressing and holding the SELECT button.
- A circuit box as shown in Figure 2.
- A 9 V battery.
- Electrical leads.
- A small ampoule containing about 20 mg of the substance to be measured.
- A stop watch
- A calculator
- Graph papers.
3. Experiment
1. The magnets are placed on two equivalent locations on the steel plate. The reference dish and the empty sample dish are put on the magnets as shown in the Figure 4. We use the dish on the left side as the reference dish, with diode D on it (D is called the reference diode), and the dish on the right side as the sample dish, with diode D on it (D is called the measuring diode).
Put the lamp-shade up side down as shown in Figure 5. Do not switch the lamp on. Put the dish holder on the lamp. Connect the apparatuses so that you can measure the voltage drop on the diode D, that is , and the differential voltage .
In order to eliminate errors due to the warming up period of the instruments and devices, it is strongly recommended that the complete measurement circuit be switched on for about 5 minutes before starting real experiments.
1.1. Measure the room temperature and the voltage drop across diode D fixed to the sample dish, at room temperature .
1.2. Calculate the voltage drops , and on the measuring diode at temperatures 50°C, 70°C and 80°C, respectively.
2. With both dishes still empty, switch the lamp on. Follow . When the temperature of the sample dish reaches , switch the lamp off.
2.1. Wait until , and then follow the change in and with time, while the steel plate is cooling down. Note down the values of and every 10 s to 20 s in the table provided in the answer sheet. If varies quickly, the time interval between consecutive measurements may be shorter. When the temperature of the sample dish decreases to , the measurement is stopped.
2.2. Plot the graph of versus t, called Graph 1, on a graph paper provided.
2.3. Plot the graph of versus , called Graph 2, on a graph paper provided.
Note: for 2.2 and 2.3 do not forget to write down the correct name of each graph.
3. Pour the substance from the ampoule into the sample dish. Repeat the experiment identically as mentioned in section 2.
3.1. Write down the data of and with time t in the table provided in the answer sheet.
3.2. Plot the graph of versus t, called Graph 3, on a graph paper provided.
3.3. Plot the graph of versus , called Graph 4, on a graph paper provided.
Note: for 3.2 and 3.3 do not forget to write down the correct name of each graph.
4. By comparing the graphs in section 2 and section 3, determine the temperature of solidification of the substance.
4.1. Using the traditional method to determine : by comparing the graphs of versus t in sections 3 and 2, i.e. Graph 3 and Graph 1, mark the point on Graph 3 where the substance solidifies and determine the value (corresponding to this point) of .
Find out the temperature of solidification of the substance and estimate its error.
4.2. Using the differential thermometric method to determine : by comparing the graphs of versus in sections 3 and 2, i.e. Graph 4 and Graph 2 , mark the point on Graph 4 where the substance solidifies and determine the value of .
Find out the temperature of solidification of the substance.
4.3. From errors of measurement data and instruments, calculate the error of obtained with the differential thermometric method. Write down the error calculations and finally write down the values of together with its error in the answer sheet.
Отговори
60 °C
Temperature of solidification from the official solution: Ts = 60±2.5 °C.
4.3. 60 °C
Official final result: Ts = 60±2.5 °C (parts 4.1 and 4.2 of the official solution give Ts = 60.5 °C).
Решение
1.
1.1.
With different experiment sets, may differ from the above value within ±40 mV.
Note for error estimation:
and are calculated using the specs of the multimeter: ±0.5% reading digit +2 on the last digit. Example: if V = 500mV, the error δV = 500×0.5% + 0.2 = 2.7 mV ≈ 3 mV.
Thus, .
All values of within 505÷585 mV are acceptable.
1.2. Formula for temperature calculation:
From Eq (1):
Error calculation:
Example: , then
Thus:
The same rule for acceptable range of as in 1.1 is applied.
2.
2.1. Data of cooling-down process without sample:
| t (s) | (mV) (±3mV) | ΔV (mV) (±0.2mV) |
|---|---|---|
| 0 | 492 | -0.4 |
| 10 | 493 | -0.5 |
| 20 | 493 | -0.5 |
| 30 | 494 | -0.6 |
| 40 | 495 | -0.7 |
| 50 | 496 | -0.7 |
| 60 | 497 | -0.8 |
| 70 | 497 | -0.8 |
| 80 | 498 | -0.9 |
| 90 | 499 | -1.0 |
| 100 | 500 | -1.0 |
| 110 | 500 | -1.1 |
| 120 | 501 | -1.1 |
| 130 | 502 | -1.2 |
| 140 | 503 | -1.2 |
| 150 | 503 | -1.3 |
| 160 | 504 | -1.3 |
| 170 | 504 | -1.4 |
| 180 | 505 | -1.5 |
| 190 | 506 | -1.6 |
| 200 | 507 | -1.6 |
| 210 | 507 | -1.7 |
| 220 | 508 | -1.7 |
| 230 | 508 | -1.8 |
| 240 | 509 | -1.8 |
| 250 | 509 | -1.8 |
| 260 | 510 | -1.9 |
| 270 | 511 | -1.9 |
| 280 | 512 | -1.9 |
| 290 | 512 | -2.0 |
| 300 | 513 | -2.0 |
| 310 | 514 | -2.1 |
| 320 | 515 | -2.1 |
| 330 | 515 | -2.1 |
| 340 | 516 | -2.1 |
| 350 | 516 | -2.2 |
| 360 | 517 | -2.2 |
| 370 | 518 | -2.3 |
| 380 | 518 | -2.3 |
| 390 | 519 | -2.3 |
| 400 | 520 | -2.4 |
| 410 | 520 | -2.4 |
| 420 | 521 | -2.5 |
| 430 | 521 | -2.5 |
| 440 | 522 | -2.5 |
| 450 | 523 | -2.6 |
| 460 | 523 | -2.6 |
The acceptable range of ΔV is ±40 mV. There is no fixed rule for the change in ΔV with T (this depends on the positions of the dishes on the plate, etc.)
2.2.
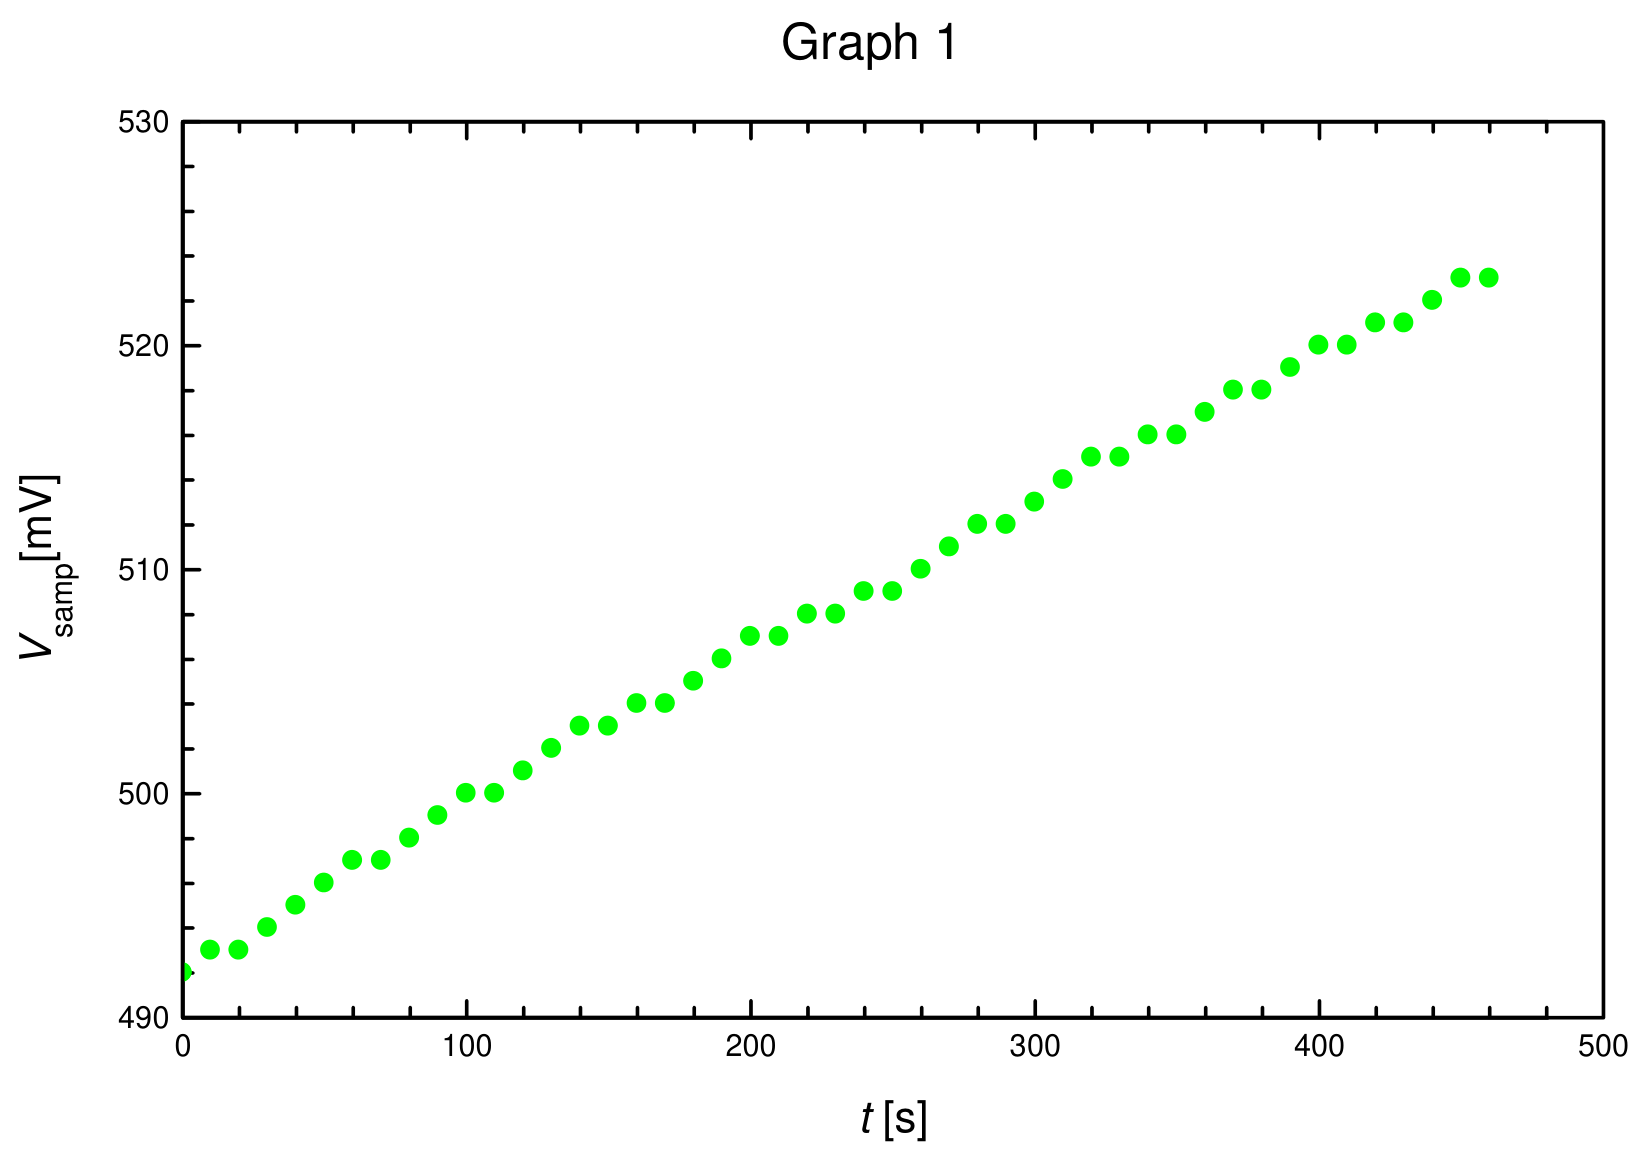
The correct graph should not have any abrupt changes of the slope.
2.3.
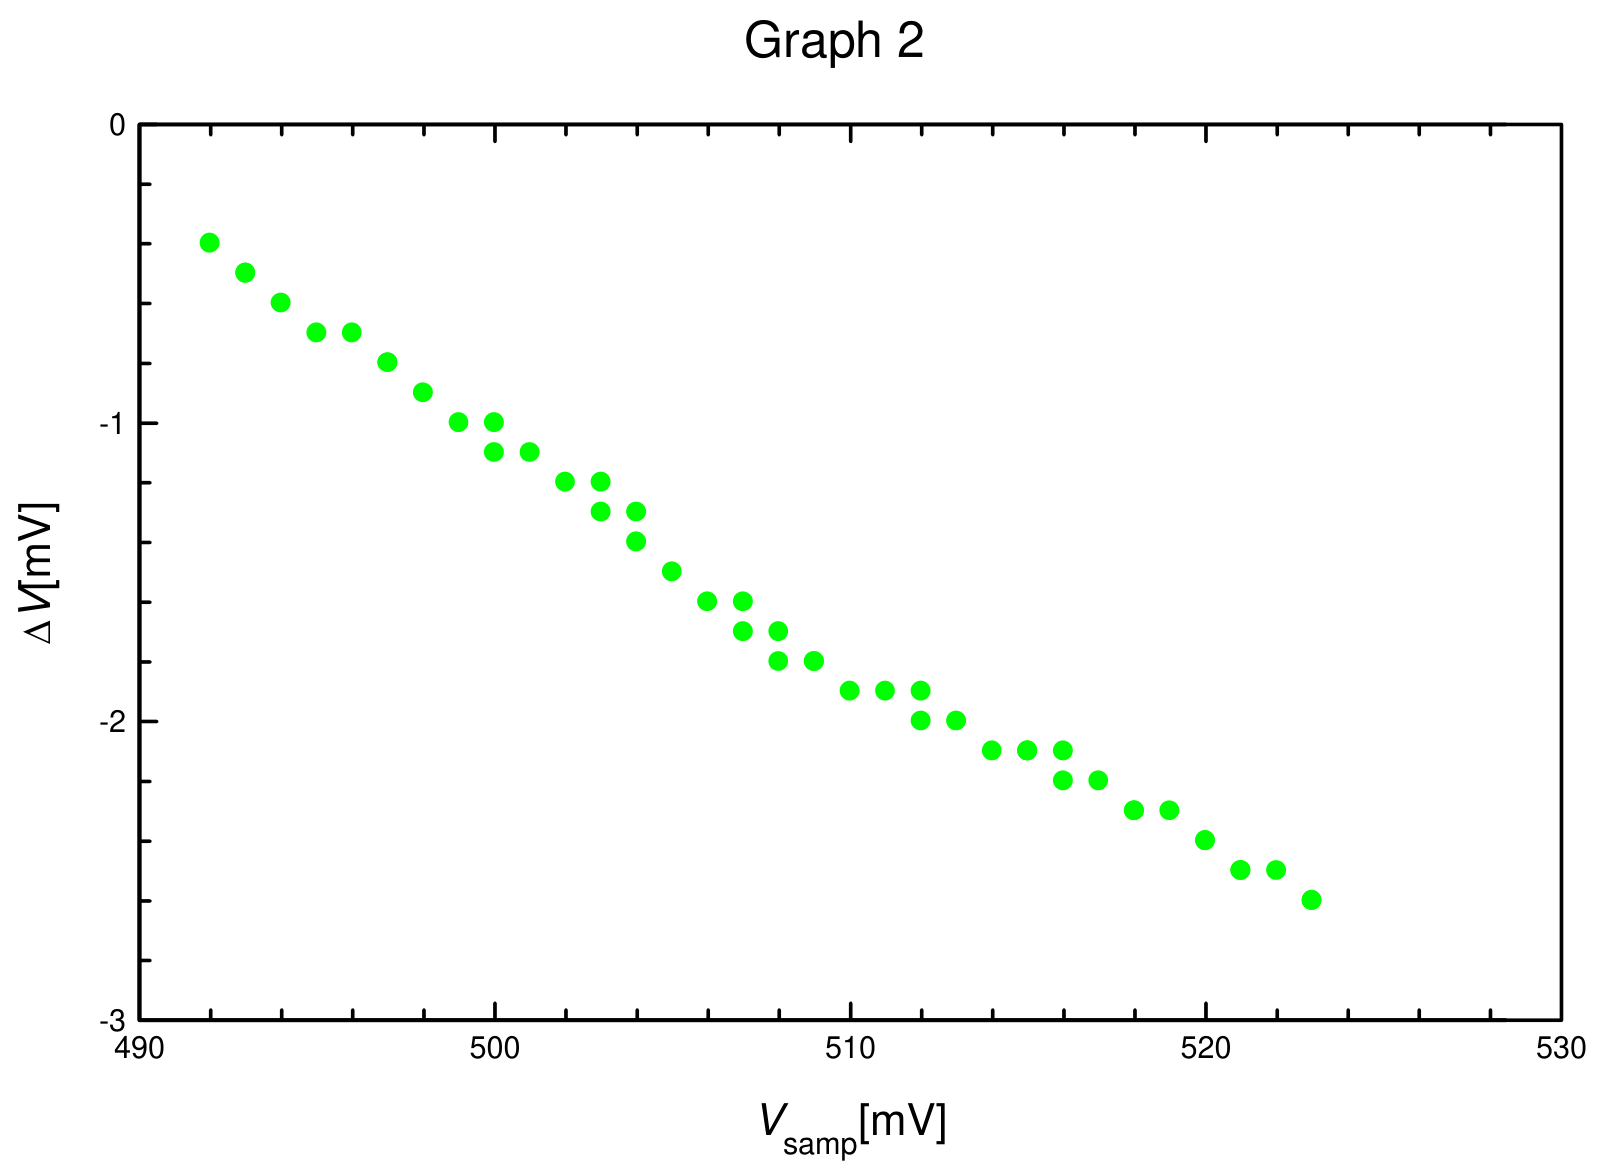
The correct graph should not have any abrupt changes of the slope.
3.
3.1. Dish with substance
| t (s) | (mV) (±3mV) | ΔV (mV) (±0.2mV) |
|---|---|---|
| 0 | 492 | -4.6 |
| 10 | 493 | -4.6 |
| 20 | 493 | -4.6 |
| 30 | 494 | -4.6 |
| 40 | 495 | -4.6 |
| 50 | 496 | -4.6 |
| 60 | 497 | -4.6 |
| 70 | 497 | -4.5 |
| 80 | 498 | -4.5 |
| 90 | 499 | -4.5 |
| 100 | 500 | -4.5 |
| 110 | 500 | -4.5 |
| 120 | 501 | -4.5 |
| 130 | 502 | -4.6 |
| 140 | 503 | -4.6 |
| 150 | 503 | -5.1 |
| 160 | 503 | -5.6 |
| 170 | 503 | -6.2 |
| 180 | 503 | -6.5 |
| 190 | 504 | -6.6 |
| 200 | 505 | -6.5 |
| 210 | 506 | -6.4 |
| 220 | 507 | -6.3 |
| 230 | 507 | -6.1 |
| 240 | 508 | -5.9 |
| 250 | 509 | -5.7 |
| 260 | 510 | -5.5 |
| 270 | 511 | -5.3 |
| 280 | 512 | -5.1 |
| 290 | 512 | -5.0 |
| 300 | 513 | -4.9 |
| 310 | 514 | -4.8 |
| 320 | 515 | -4.7 |
| 330 | 515 | -4.7 |
| 340 | 516 | -4.6 |
| 350 | 516 | -4.6 |
| 360 | 517 | -4.5 |
| 370 | 518 | -4.5 |
| 380 | 518 | -4.4 |
| 390 | 519 | -4.4 |
| 400 | 520 | -4.4 |
| 410 | 520 | -4.4 |
| 420 | 521 | -4.4 |
| 430 | 521 | -4.3 |
| 440 | 522 | -4.3 |
| 450 | 523 | -4.3 |
| 460 | 523 | -4.3 |
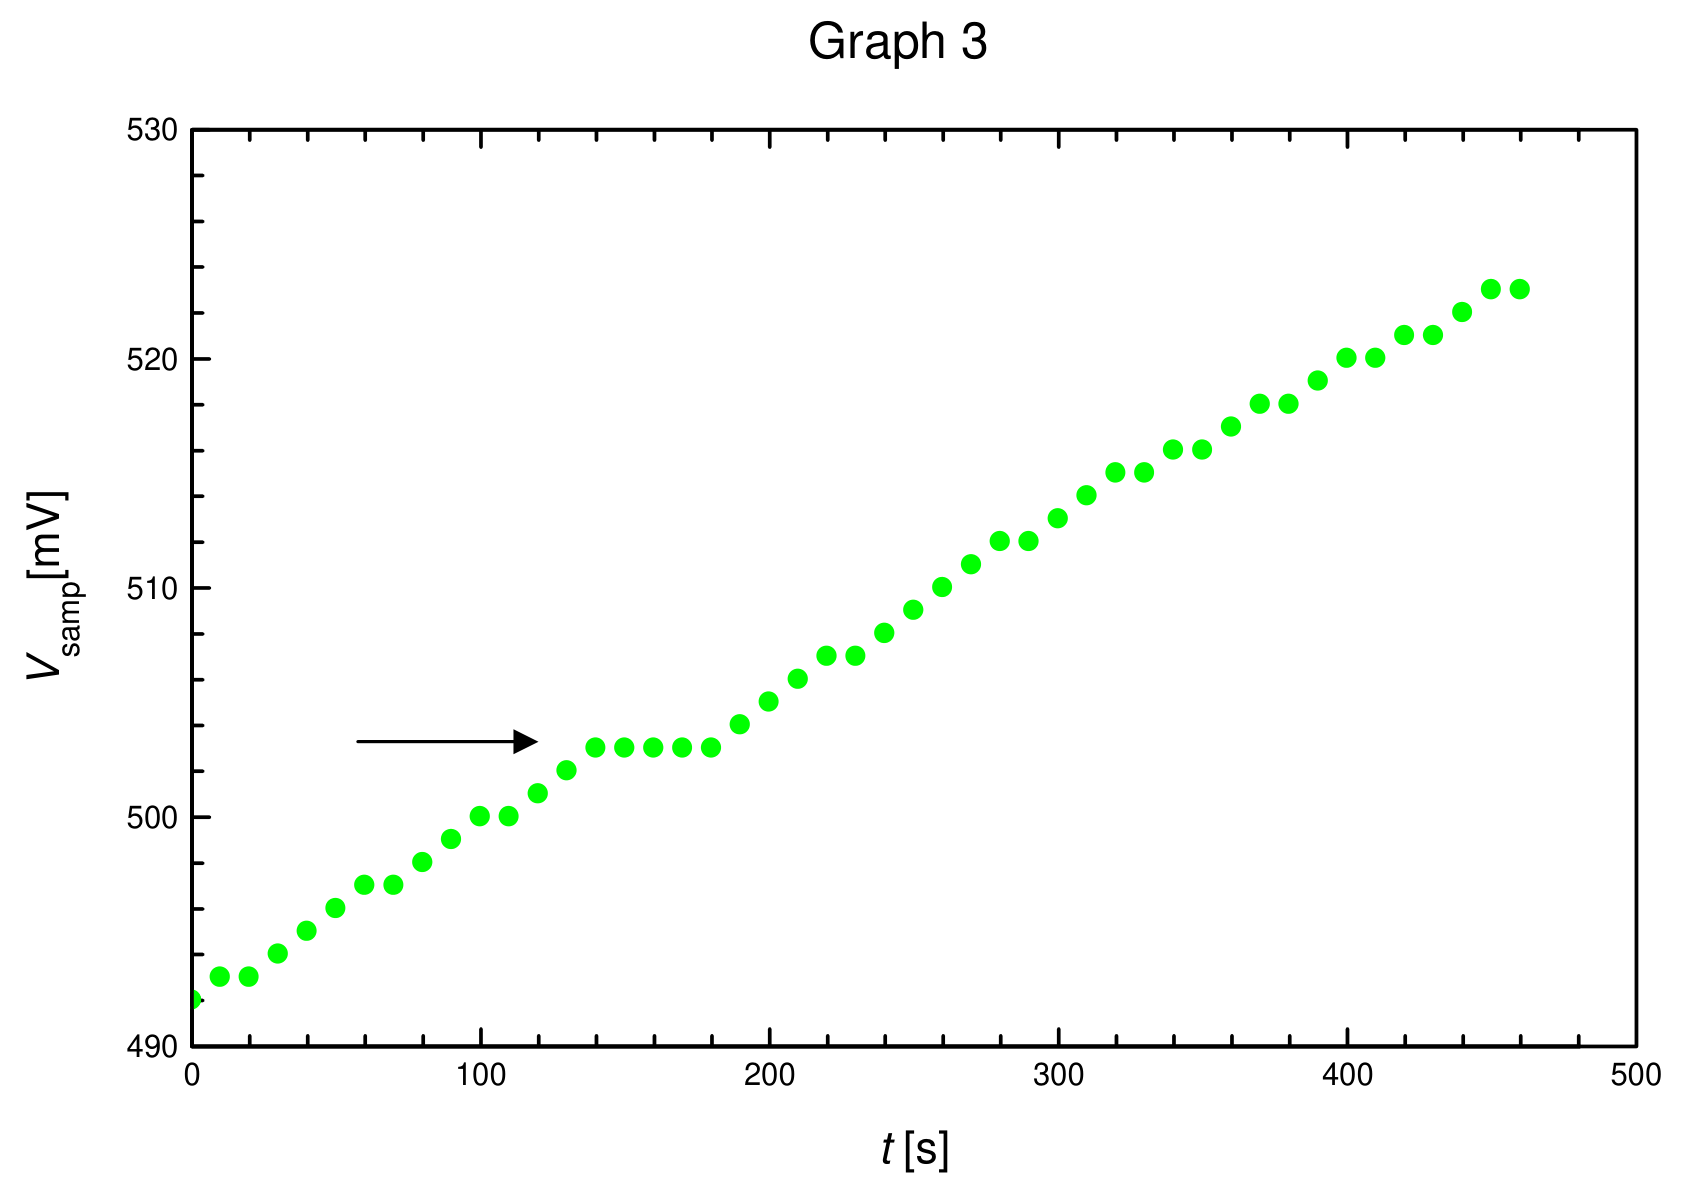
3.2.
The correct Graph 3 should contain a short plateau as marked by the arrow in the above figure.
3.3.
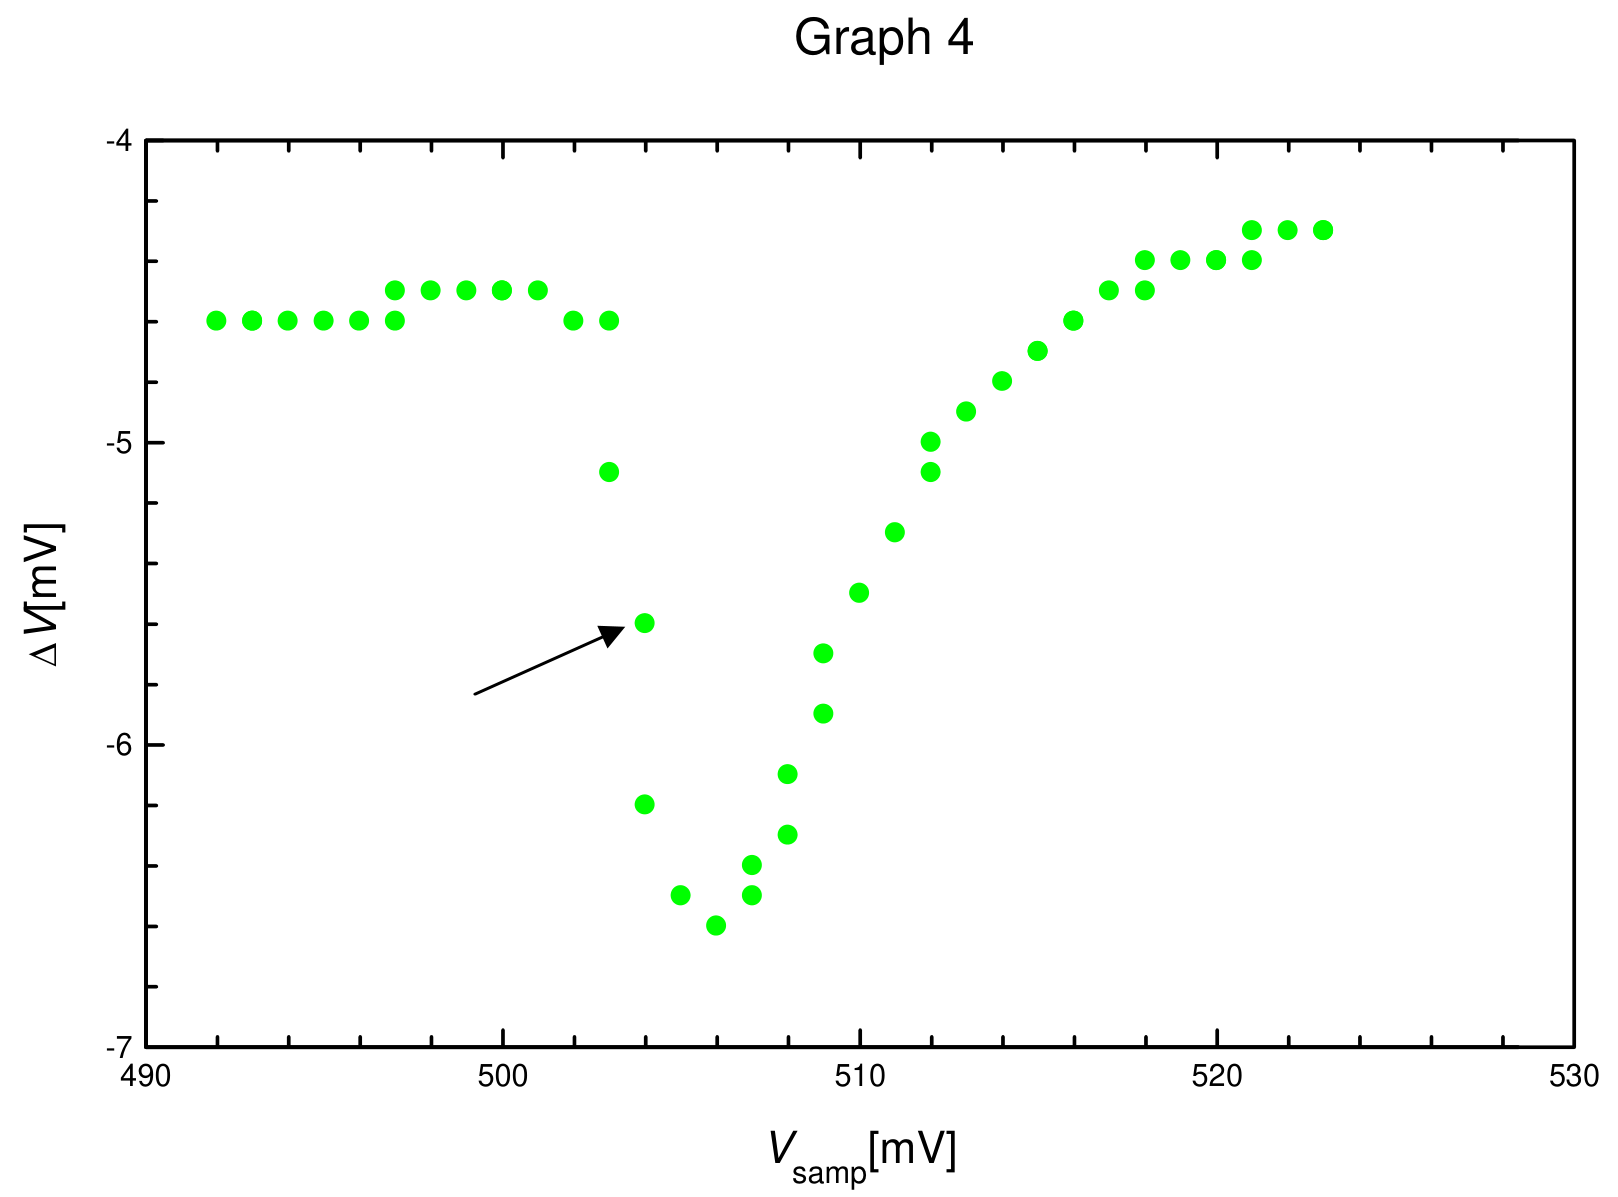
The correct Graph 4 should have an abrupt change in ΔV, as shown by the arrow in the above figure.
Note: when the dish contains the substance, values of ΔV may change compared to those without the substance.
4.
4.1. is shown in Graph 3. Value = (503±3) mV. From that, = 60.5 °C can be deduced.
4.2. is shown in Graph 4. Value = (503±3) mV. From that, = 60.5 °C can be deduced.
4.3. Error calculations, using root mean square method:
Error of : , in which A is an intermediate variable.
Therefore error of can be written as , in which is the error.
Error for A is calculated separately:
in which we have:
Errors of other variables in this experiment:
, read on the multimeter.
From the above constituent errors we have:
Finally, the error of is:
Hence, the final result is:
Note: if the student uses any other reasonable error calculation method that leads to approximately the same result, it is also accepted.
Оригинал в Архива: exp.pdf · официални решения: exp_sol.pdf