IPhO 2014, Експеримент — Задача 2. Part2.1.Investigating a photodiode
Experimental competition. Thursday, 17 July 2014 — Experiment. To see invisible! (20 points) · 17 юли 2014 г. · 3,2 т.
Условие
Part 2.Measure!(16.5 points)
Disconnect the LED from the power supply and remove it. Remove the sheet of white paper.
In this part of the work use laser as a light source, make sure you connect it to its power supply!
Fix the laser, polarizer 1, the screen with the slit and a photodetector (a photodiode) in the holders. Adjust the setting so that the laser beam passes through the polarizer and the slit of the screen to fall strictly onto the photodiode. Using the screw 5c for the beam width adjustment, make sure that the spot size on the photodetector is about 5-6 mm.
The laser emits a linearly polarized light. With the ring 5a designed for the laser reorientation, make sure that the laser beam almost completely passes through the first polarizer and the major axis of the elliptically-shaped spot is vertical. In the following, the orientations of the laser and the photodetector must be fixed with the screws 5d and15c. Set up polarizer 2. Make sure that the polarizers are crossed. Fig. 4B shows the whole setup with the screen mounted.
For measuring the light intensity, of use is the photodiode EMF which is a rather complicated function of the incident light intensity itself. Therefore, for measuring the light intensity the circuit shown in Fig. 2 is used. The DC voltage measured by a multimeter depends on the incident light intensity and the resistance of a resistor. The main objective is to choose such an optimum value of the resistance that the voltage across the resistor is to be proportional to the intensity of the light incident on the photodiode.
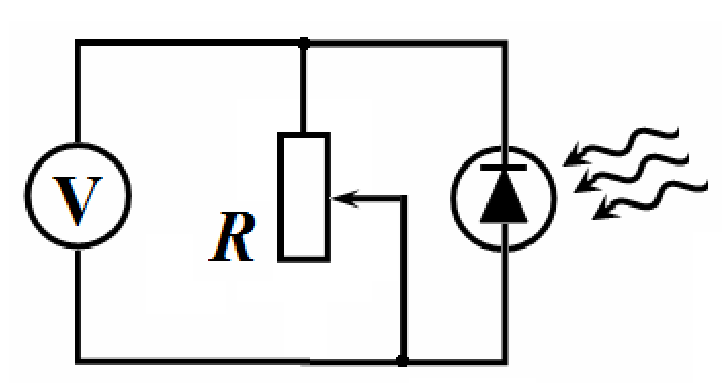
For measurements in this part, remove the second polarizer and the screen from the optical bench.
The filters that attenuate the beam intensity should be necessarily fixed with the clamps on the back side of the polarizer as shown in Fig. 5B.
The maximum values of the measured voltages must be at least 300 mV.
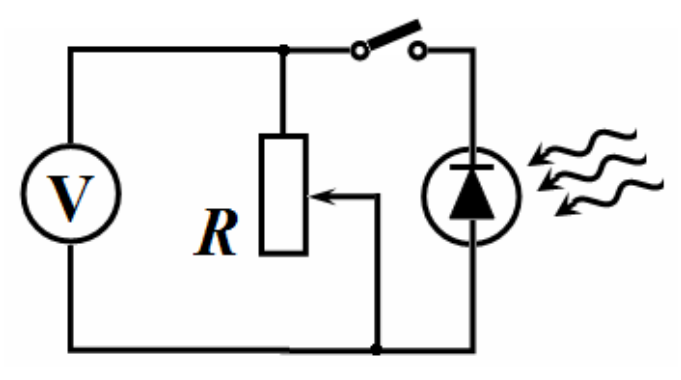
Using a multimeter, you can measure the resistance of the resistor and the voltage across it (of course, you have to properly adjust the register of the multimeter). Add, in an appropriate place, the switch provided so that you could measure both the resistance and the voltage with the single multimeter, i.e. without disconnecting the circuit by just shorting/unshorting the switch and the multimeter register adjustment.
2.1.1 Draw a circuit with the switch installed for measuring of the voltage across the resistor and its resistance. (0.2 points)
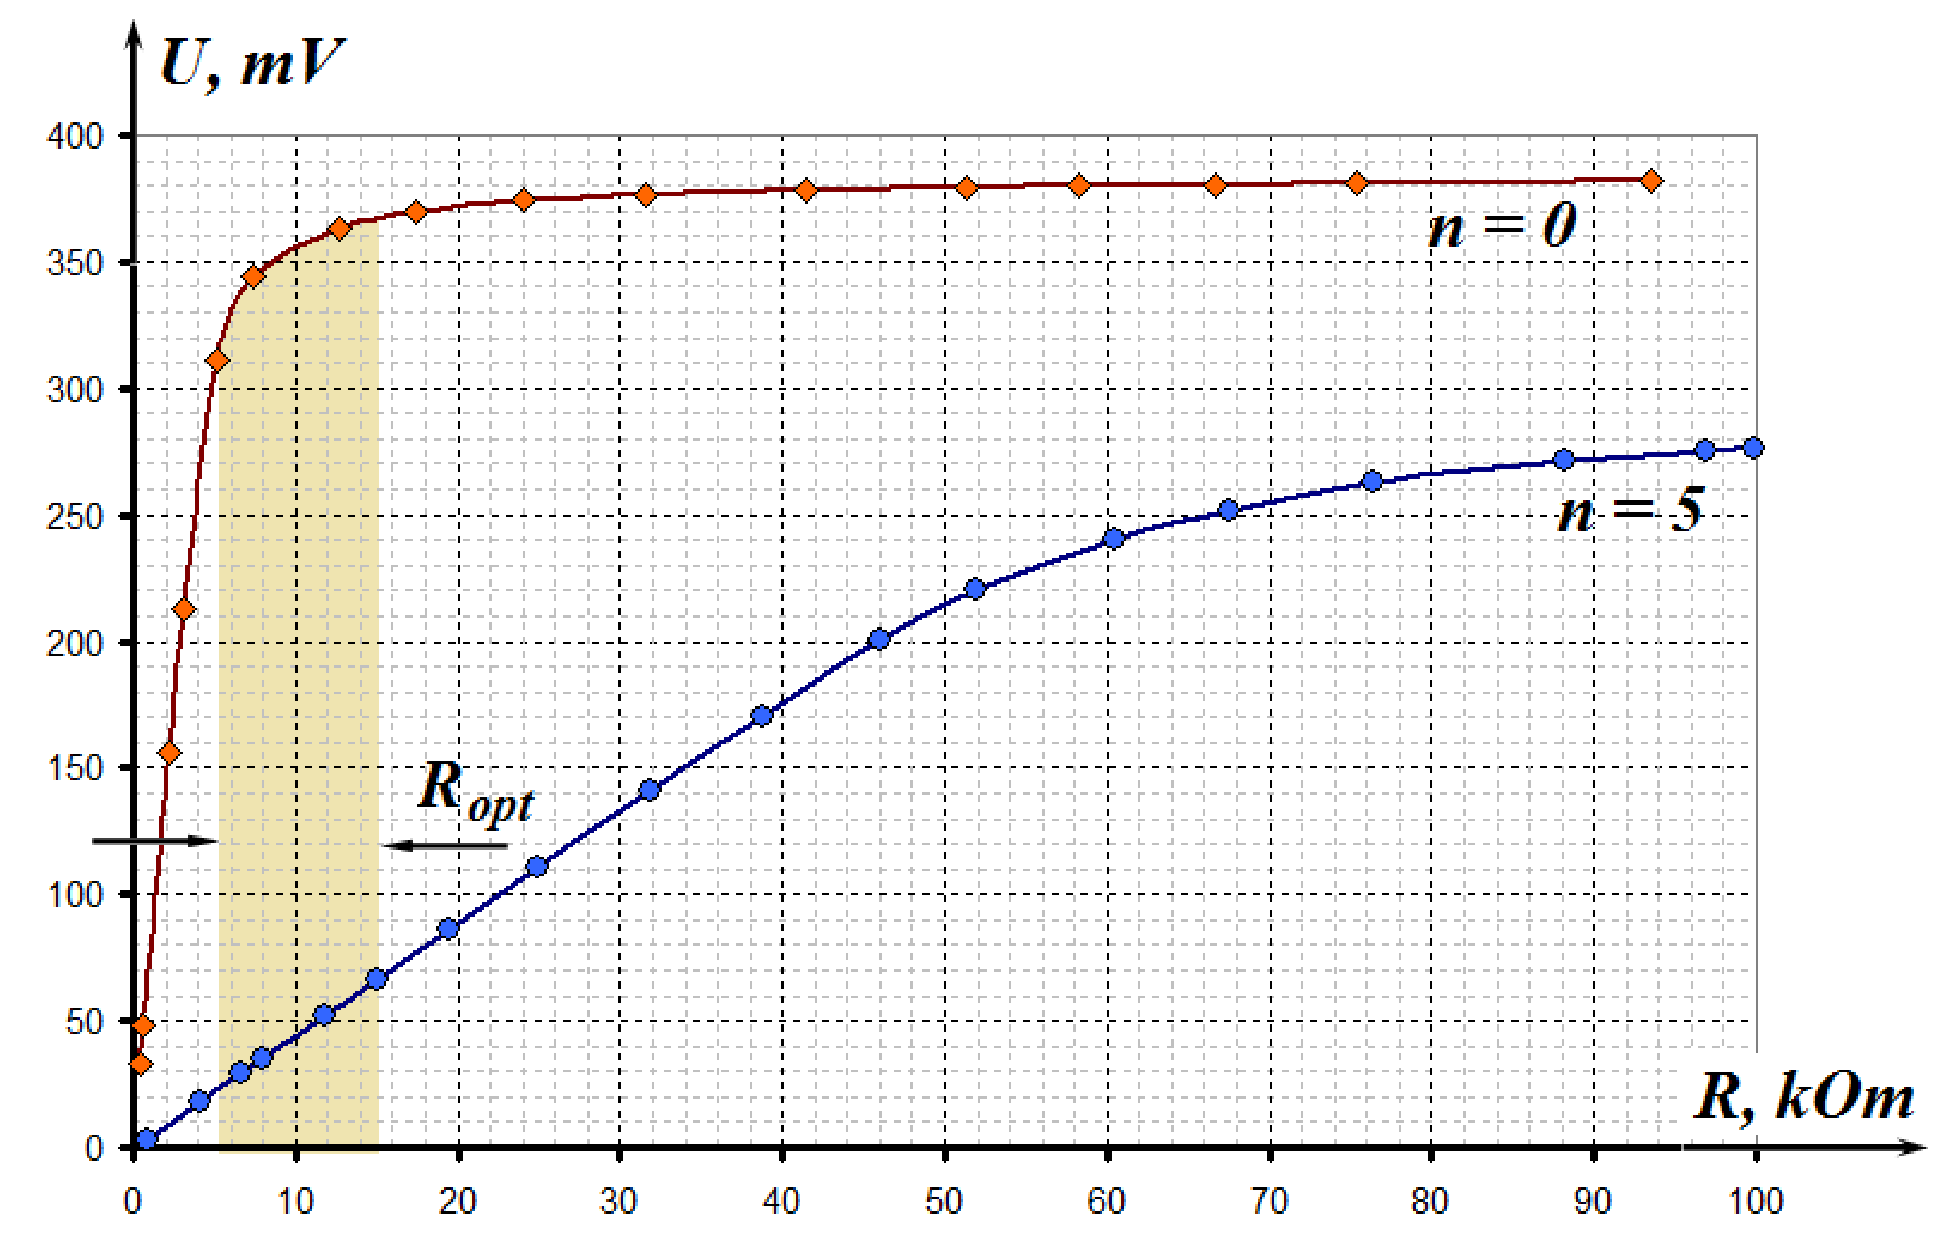
2.1.2 Measure the voltage across the resistor as a function of its resistance for two values of the incident light intensity: maximum (with the number of filters ) and the minimum (with the number of filters ). Plot the corresponding graphs in the same figure. Specify the range of the resistance for which the difference between the voltages is maximal. (1.0 point)
2.1.3 Measure the voltage across the resistor as a function of the number of filters , attenuating the intensity of the incident light on the photodiode. Measurements must be carried out at three fixed values of the resistance, approximately equal to , and . Plot the corresponding graphs in the same figure choosing the scale such that it would be possible to verify whether the voltage across the resistor depends linearly on the intensity of the incident light registered by the photodiode. From the three above mentioned values of the resistance choose an optimum one at which further measurements of the light intensity should be made. (1.0 point)
2.1.4 Using this data obtained, calculate the transmittance of the filter and evaluate its error, with being the intensity of the transmitted light, and being the intensity of the incident light. You can make additional measurements if necessary. (1.0 point)
All subsequent measurements must be made at the optimal value of the resistor chosen!
It is assumed in what follows that the light intensity in relative units is equal to the voltage across the resistor in mV.
Отговори
2.1.2 5-15 kOhm
Official solution: the optimal resistance should be within the range 5-15 kOhm.
2.1.3 10 kOhm
2.1.4 0.59
Решение
Part 2. Measure!
Section 2.1. Investigating a photodiode
2.1.1 In the figure below a position for a circuit switch is shown. During measurements of the resistance, the circuit switch should be unshorted.
2.1.2 In table 1 the results are presented of the measurements of the voltage as a function of the resistance. Those data are plotted in the corresponding graph.
Table 1.
| 0,4 | 33 | 0,9 | 3 |
| 0,6 | 48 | 4,1 | 18 |
| 2,2 | 156 | 6,6 | 29 |
| 3,1 | 213 | 8,0 | 35 |
| 5,1 | 311 | 11,8 | 52 |
| 7,4 | 344 | 15,0 | 66 |
| 12,7 | 363 | 19,4 | 86 |
| 17,4 | 370 | 24,9 | 111 |
| 24,0 | 374 | 31,8 | 141 |
| 31,5 | 376 | 38,8 | 170 |
| 41,5 | 378 | 46,0 | 200 |
| 51,4 | 379 | 51,9 | 220 |
| 58,3 | 380 | 60,4 | 240 |
| 66,6 | 380 | 67,5 | 252 |
| 75,4 | 381 | 76,4 | 263 |
| 93,5 | 382 | 88,2 | 271 |
| 96,9 | 275 | ||
| 99,8 | 276 |
Note that the optimal resistance should be within the range 5-15 , which corresponds to the largest variation in the voltage.
2.1.3 In table 2 the results are shown of the measurements for the voltage as a function of the number of light filters at different values of resistance.
Table 2.
| 29,9 kOhm | 20,4 kOhm | 10,1 kOhm | ||||
|---|---|---|---|---|---|---|
| 0 | 391 | 5,969 | 388 | 5,961 | 377 | 5,932 |
| 1 | 370 | 5,914 | 364 | 5,897 | 341 | 5,832 |
| 2 | 346 | 5,846 | 336 | 5,817 | 294 | 5,684 |
| 3 | 317 | 5,759 | 309 | 5,733 | 179 | 5,187 |
| 4 | 288 | 5,663 | 234 | 5,455 | 105 | 4,654 |
| 5 | 212 | 5,357 | 148 | 4,997 | 66 | 4,190 |
Intensity of the light that has passed through the filter decreases as a geometric progression when increasing the number of filters :
In case if the measured voltage is proportional to the intensity of the incident light, it obeys a similar law:
To verify equation (2), one needs to use a semi-logarithmic scale. In other words, it is necessary to plot as a function of :
That plot is shown in the following figure.
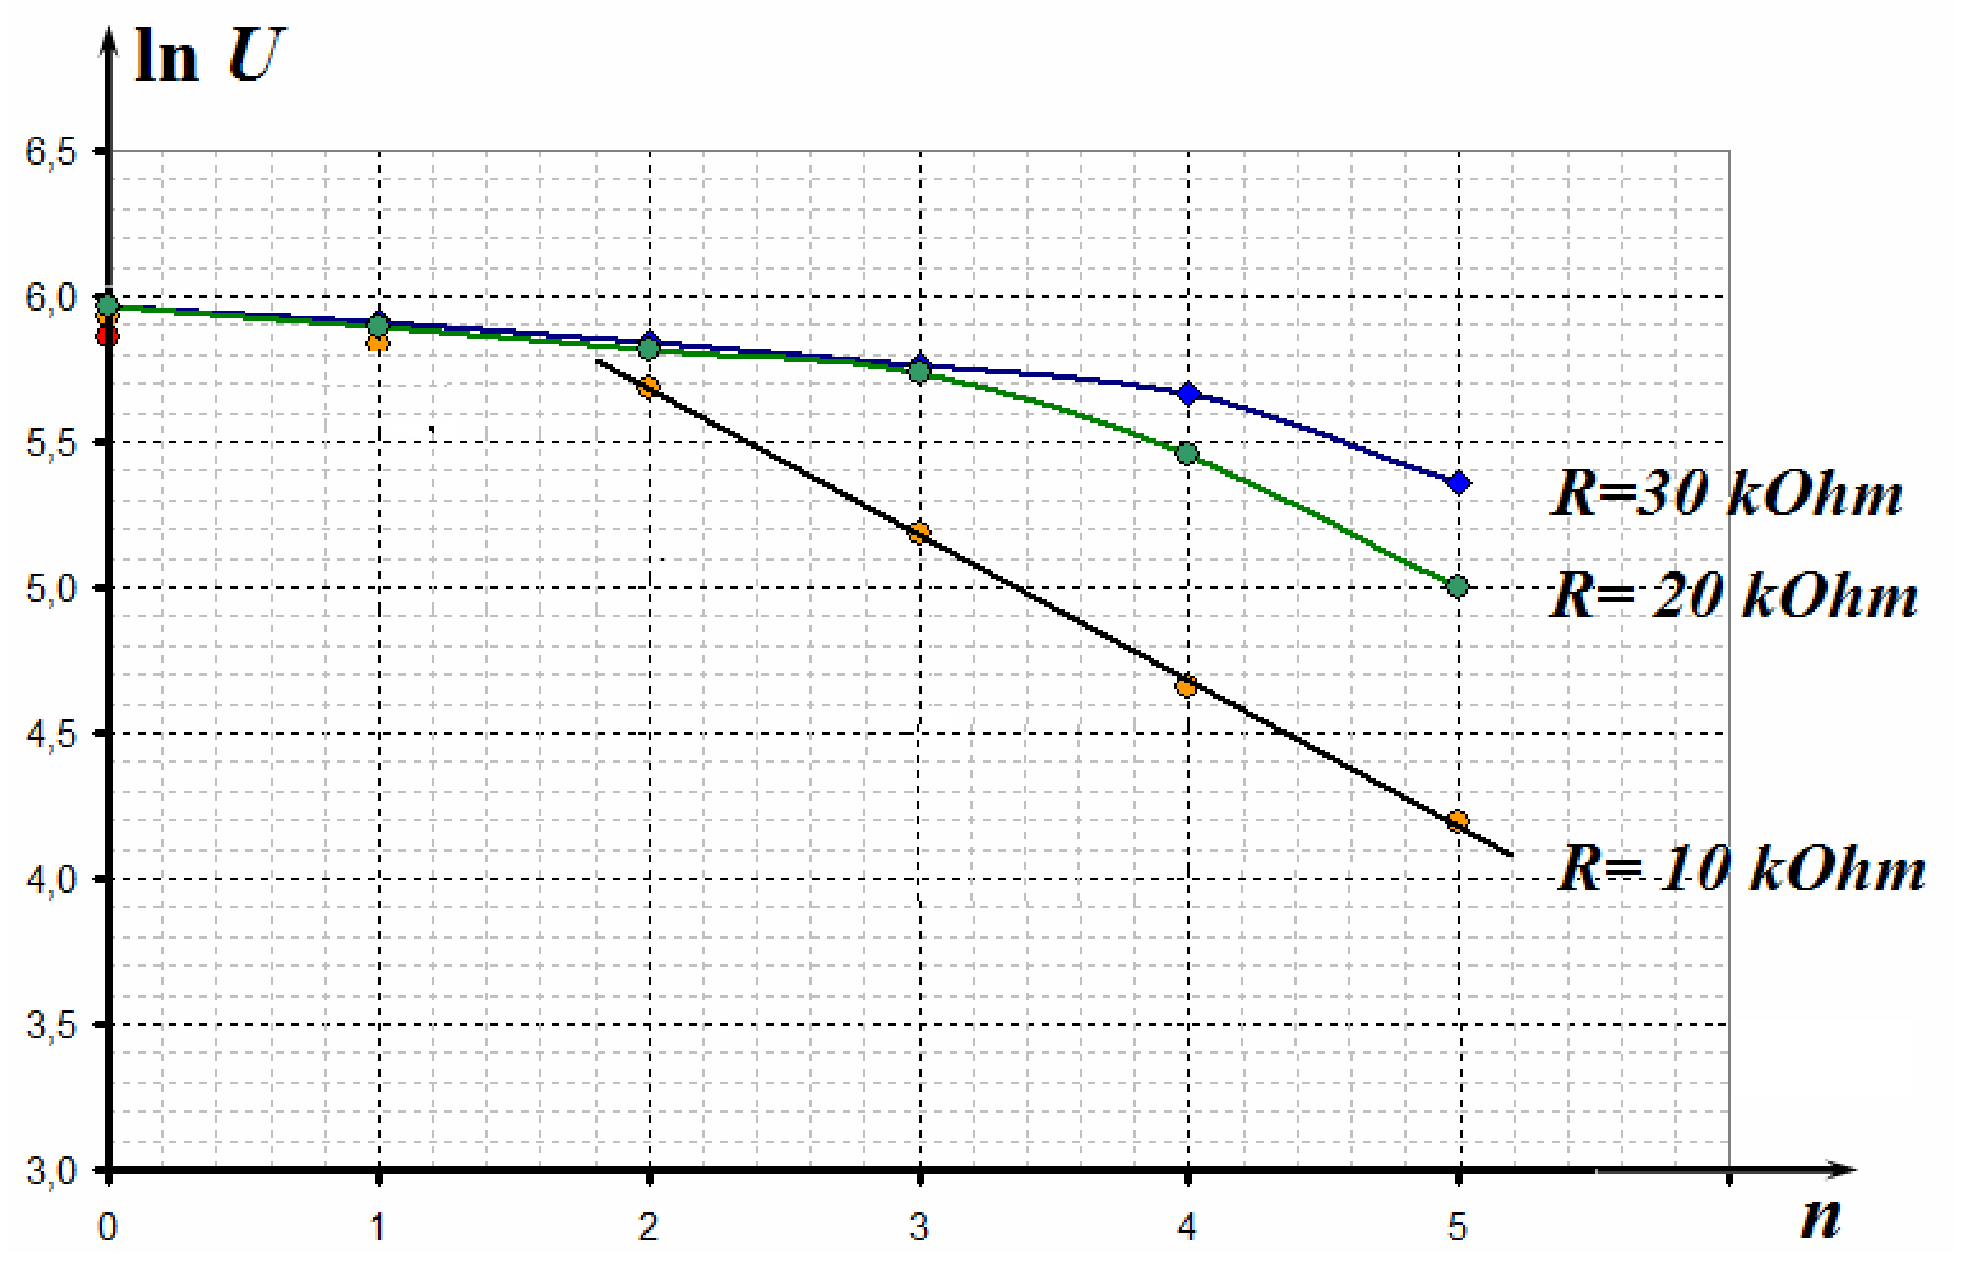
According to the graph above, by decreasing the resistance the dependence turns a linear function and further measurements should be made at the lowest resistance among given values, i.e. at .
2.1.4. According to equation (3) , the slope is . Using the Method of Least Squares, we can obtain its value . Thus, the coefficient of transmission turns to be equal to with an error, which can be calculated by applying the following formula . Finally we obtain
Note that values for produce the following result: .
Оригинал в Архива: 2014_IPhO_Experimenta_Competition.pdf · официални решения: 2014_IPhO_Solution_to_Experimental_Competition.pdf