IPhO 2014, Експеримент — Задача 3. Part 2.2 Light transmission through plastic rulers
Experimental competition. Thursday, 17 July 2014 — Experiment. To see invisible! (20 points) · 17 юли 2014 г. · 5,4 т.
Условие
Place the plastic ruler between the polarizers. You can move the ruler with your hands. Then, secure it with the clamps on the screen with a slit (see Fig. 2B). The lower edge of the ruler should coincide with a line drawn on the screen, and its scale should be at the top. Make sure that both of the rulers provided demonstrate the birefringence phenomenon. Observe a picture emerging when you put one ruler on the top of the other so that light is to pass through both of them.
In this part use an optical scheme shown in Fig. 4B. Make sure that the rulers are fixed on the screen at the position described in Part 1.2.
2.2.1 Measure the intensity of the transmitted light (in ) as a function of the coordinate of the point of the light incidence on the ruler in the range from 0 to 10 cm.. Measurements must be carried out for each ruler provided and for the two rulers stacked together. In each case, measure the maximum value of the voltage. Plot the corresponding graphs in the same figure. (2.0 points)
2.2.2 For each of the two rules calculate the values of the phase shift between the ordinary and extraordinary waves in the range of from 0 to 7 cm. Plot the corresponding graphs . Put down the formula you have used for calculations. (1.2 points)
Note that the phase difference cannot unambiguously be determined from formula (1),additional physical assumptions should be applied to determine it correctly. [1,2 т.]
2.2.3 Assuming that is linear for each ruler
calculate the numerical values of the above coefficients for rulers 1 and 2. (1.0 point)
2.2.4 Using those data obtained in parts 2.2.1-2.2.3, calculate the theoretical values of the intensity of light passing through the two rulers stacked together. Put down the formula that you have used for calculations. Plot the theoretical dependence in the same figure from part 2.2.1. (1.2 point)
Отговори
2.2.3
Official solution values (x in mm, from the MLS fit of the organisers' data).
2.2.4
Решение
Часть 2.2 Light transition through a plastic ruler
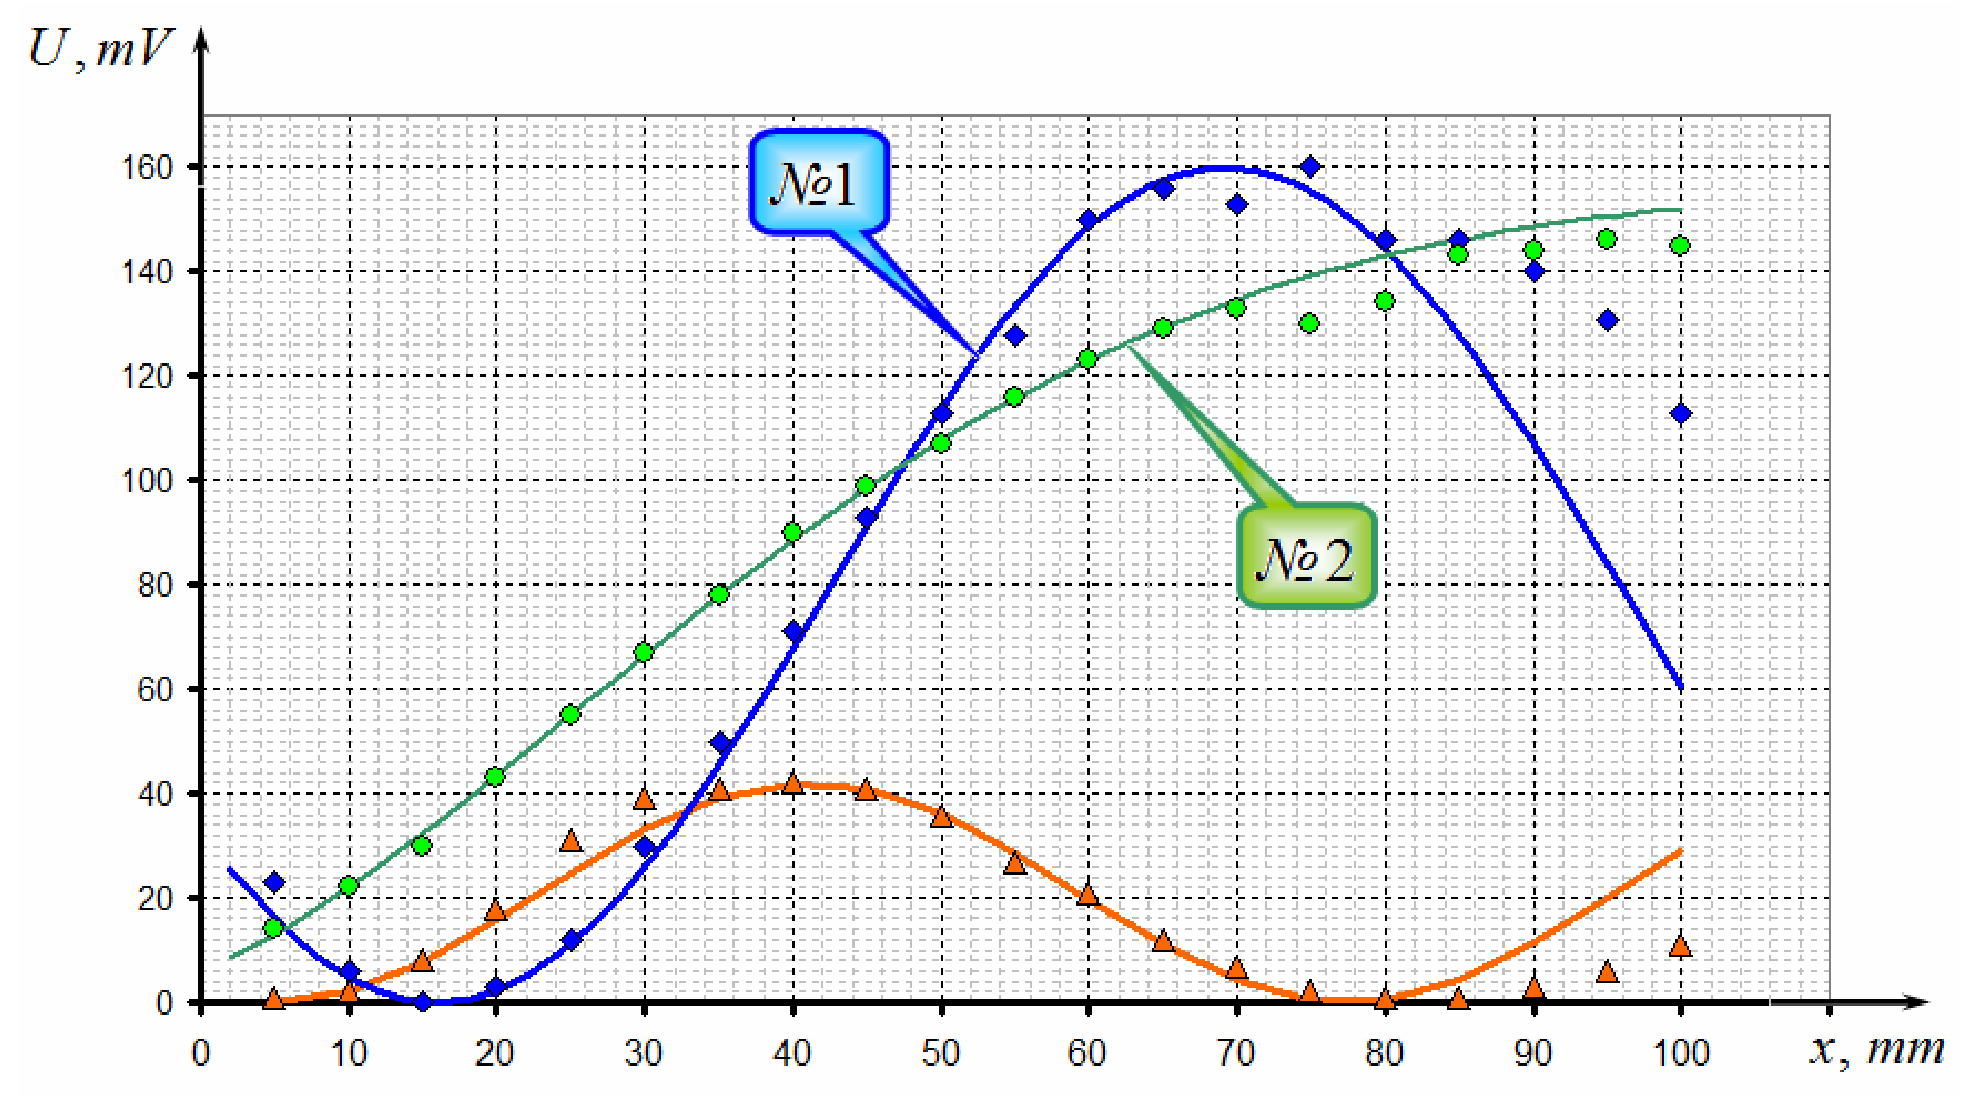
2.2.1 Results of measurements of the light intensity as a function of coordinates of transmission points through ruler #1, #2 and both rulers, are shown in table 3 and in the graph below.
Table 3.
| №1 | №2 | Both rulers | ||||||
|---|---|---|---|---|---|---|---|---|
| X,mm | U,mV | X,mm | U,mV | X,mm | U,mV | |||
| 5 | 23 | 0,778 | 5 | 14 | 0,601 | 5 | 1 | 0,0 |
| 10 | 6 | 0,390 | 10 | 22 | 0,760 | 10 | 2 | 2,1 |
| 15 | 0 | 0,000 | 15 | 30 | 0,896 | 15 | 8 | 7,7 |
| 20 | 3 | 0,275 | 20 | 43 | 1,090 | 20 | 18 | 15,7 |
| 25 | 12 | 0,555 | 25 | 55 | 1,253 | 25 | 31 | 24,7 |
| 30 | 30 | 0,896 | 30 | 67 | 1,408 | 30 | 39 | 33,0 |
| 35 | 50 | 1,186 | 35 | 78 | 1,546 | 35 | 41 | 39,2 |
| 40 | 71 | 1,458 | 40 | 90 | 1,696 | 40 | 42 | 41,9 |
| 45 | 93 | 1,734 | 45 | 99 | 1,811 | 45 | 41 | 40,8 |
| 50 | 113 | 1,996 | 50 | 107 | 1,915 | 50 | 36 | 36,0 |
| 55 | 128 | 2,214 | 55 | 116 | 2,038 | 55 | 27 | 28,5 |
| 60 | 150 | 2,636 | 60 | 123 | 2,138 | 60 | 21 | 19,6 |
| 65 | 156 | 2,824 | 65 | 129 | 2,230 | 65 | 12 | 10,9 |
| 70 | 153 | 2,720 | 70 | 133 | 2,295 | 70 | 7 | 4,1 |
| 75 | 160 | 3,142 | 75 | 130 | 2,246 | 75 | 2 | 0,4 |
| 80 | 146 | 2,541 | 80 | 134 | 2,312 | 80 | 1 | 0,5 |
| 85 | 146 | 2,541 | 85 | 143 | 2,478 | 85 | 1 | 4,4 |
| 90 | 140 | 2,419 | 90 | 144 | 2,498 | 90 | 3 | 11,4 |
| 95 | 131 | 2,262 | 95 | 146 | 2,541 | 95 | 6 | 20,1 |
| 100 | 113 | 1,996 | 100 | 145 | 2,519 | 100 | 11 | 29,0 |
2.2.2 To calculate a phase shift, we use equation (1), mentioned in the problems formulation, which can be represented as
where is the largest value of voltage. But we have to be sure that this value actually corresponds to the maximum of function (1), not just another boundary point. According to measurements, (see the graph) for each ruler the most suitable value for is .
The following equation
has multiple roots and it is not easy to find actual values of the phase shift, even if it’s possible to calculate certain value for , roots of the equation mentioned above are shown in the figure below
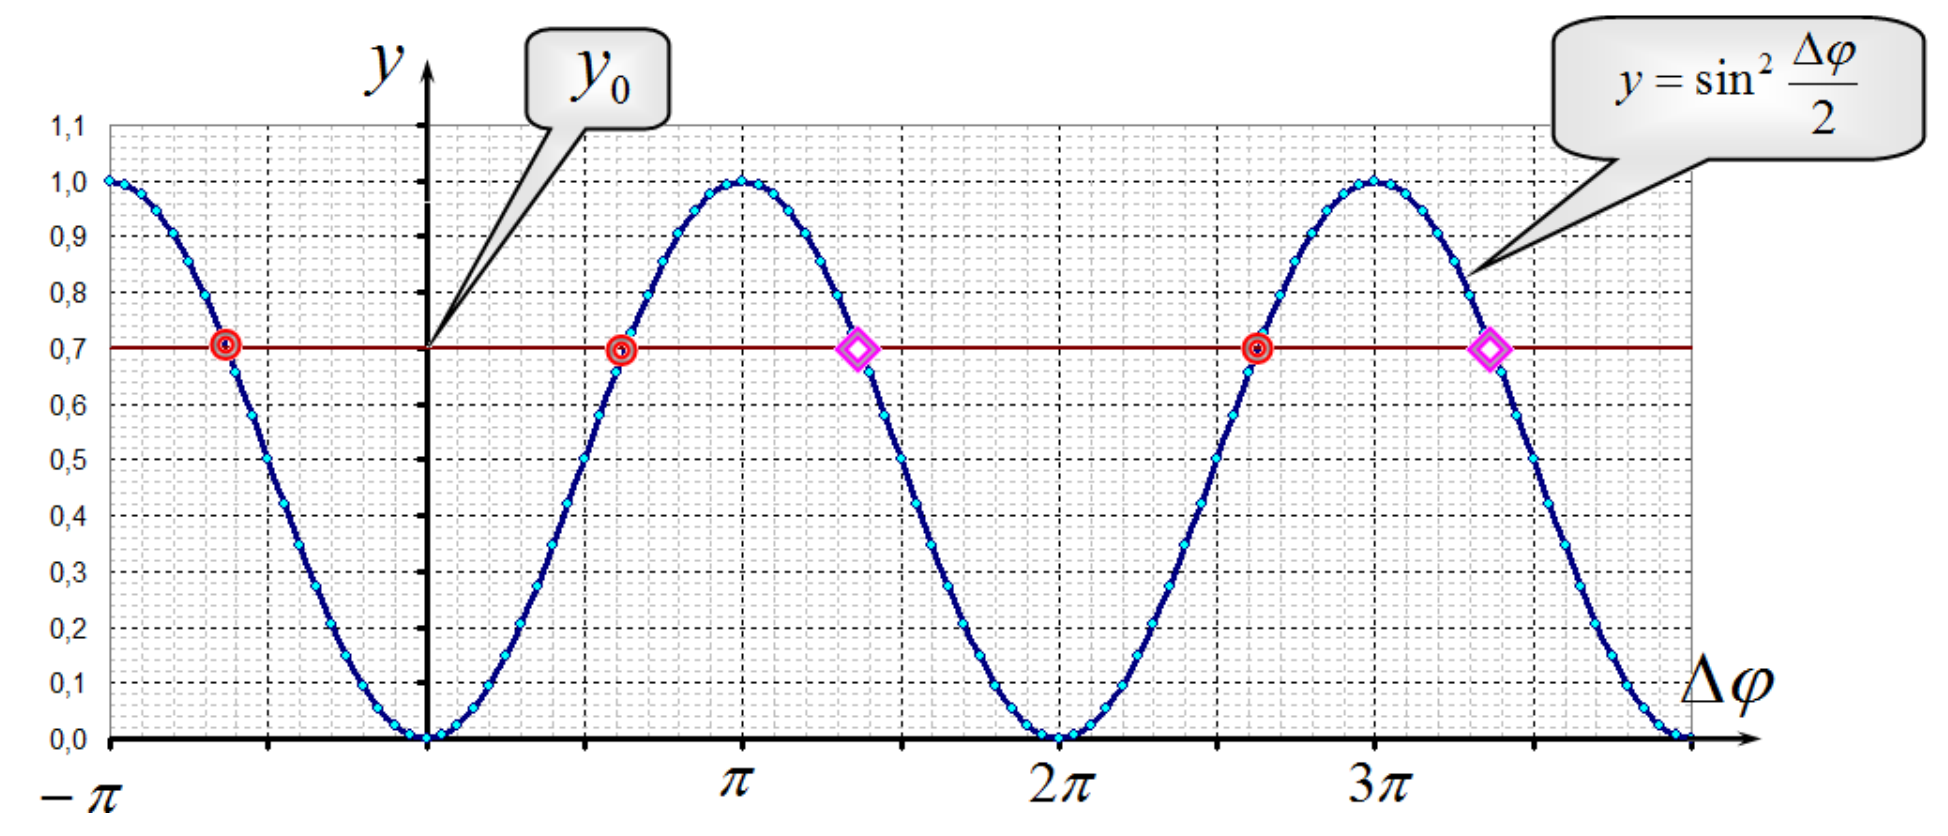
Formally we can represent the roots in different forms, for example,
Choosing a correct root should depend on a function obtained experimentally.
Values for the phase shifts calculated by the equation
are shown in table 3
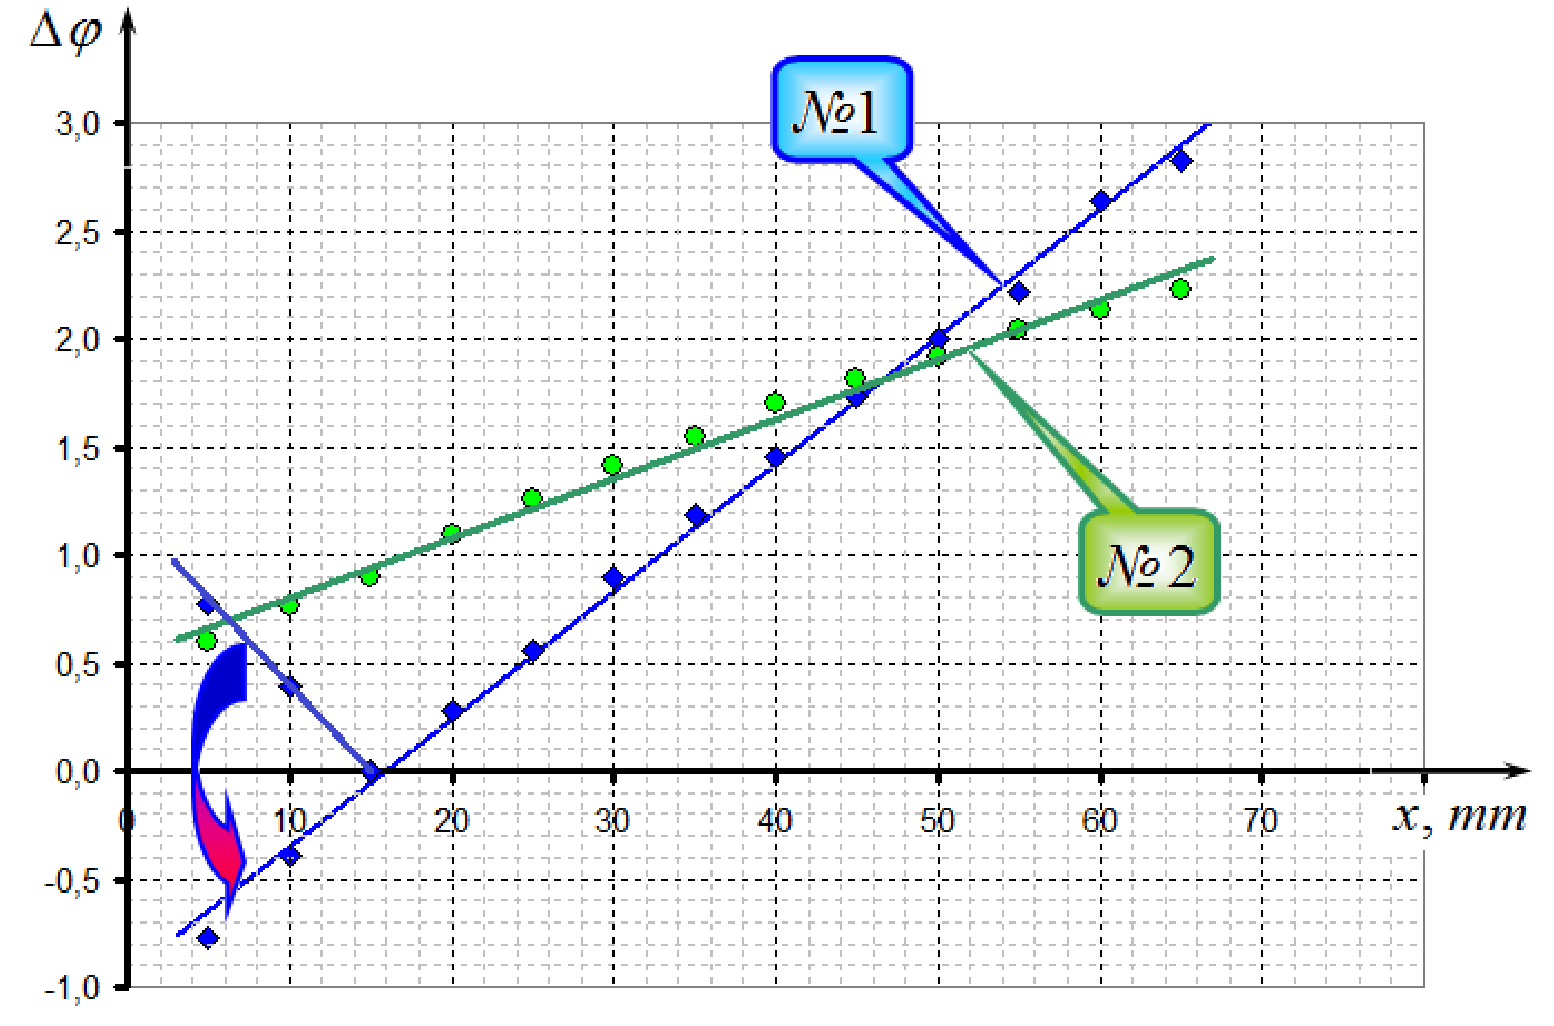
It is clear that the function has to be monotonous, that is why the signs of roots for the first two points must be changed, which is a mathematically correct operation (just reflecting the graph). Note that the phase shifts are calculated with uncertainty of .
2.2.3 Obtained functions are close to linear, using MLS we get
Graphs of those functions are shown below.
2.2.4 If two rulers are stacked together, then phase shifts simply add, and, theoretically, the intensity as function of phase shifts can be written as
Here is the largest value of voltage at the light transition through both rulers and can be obtained from experimental data.
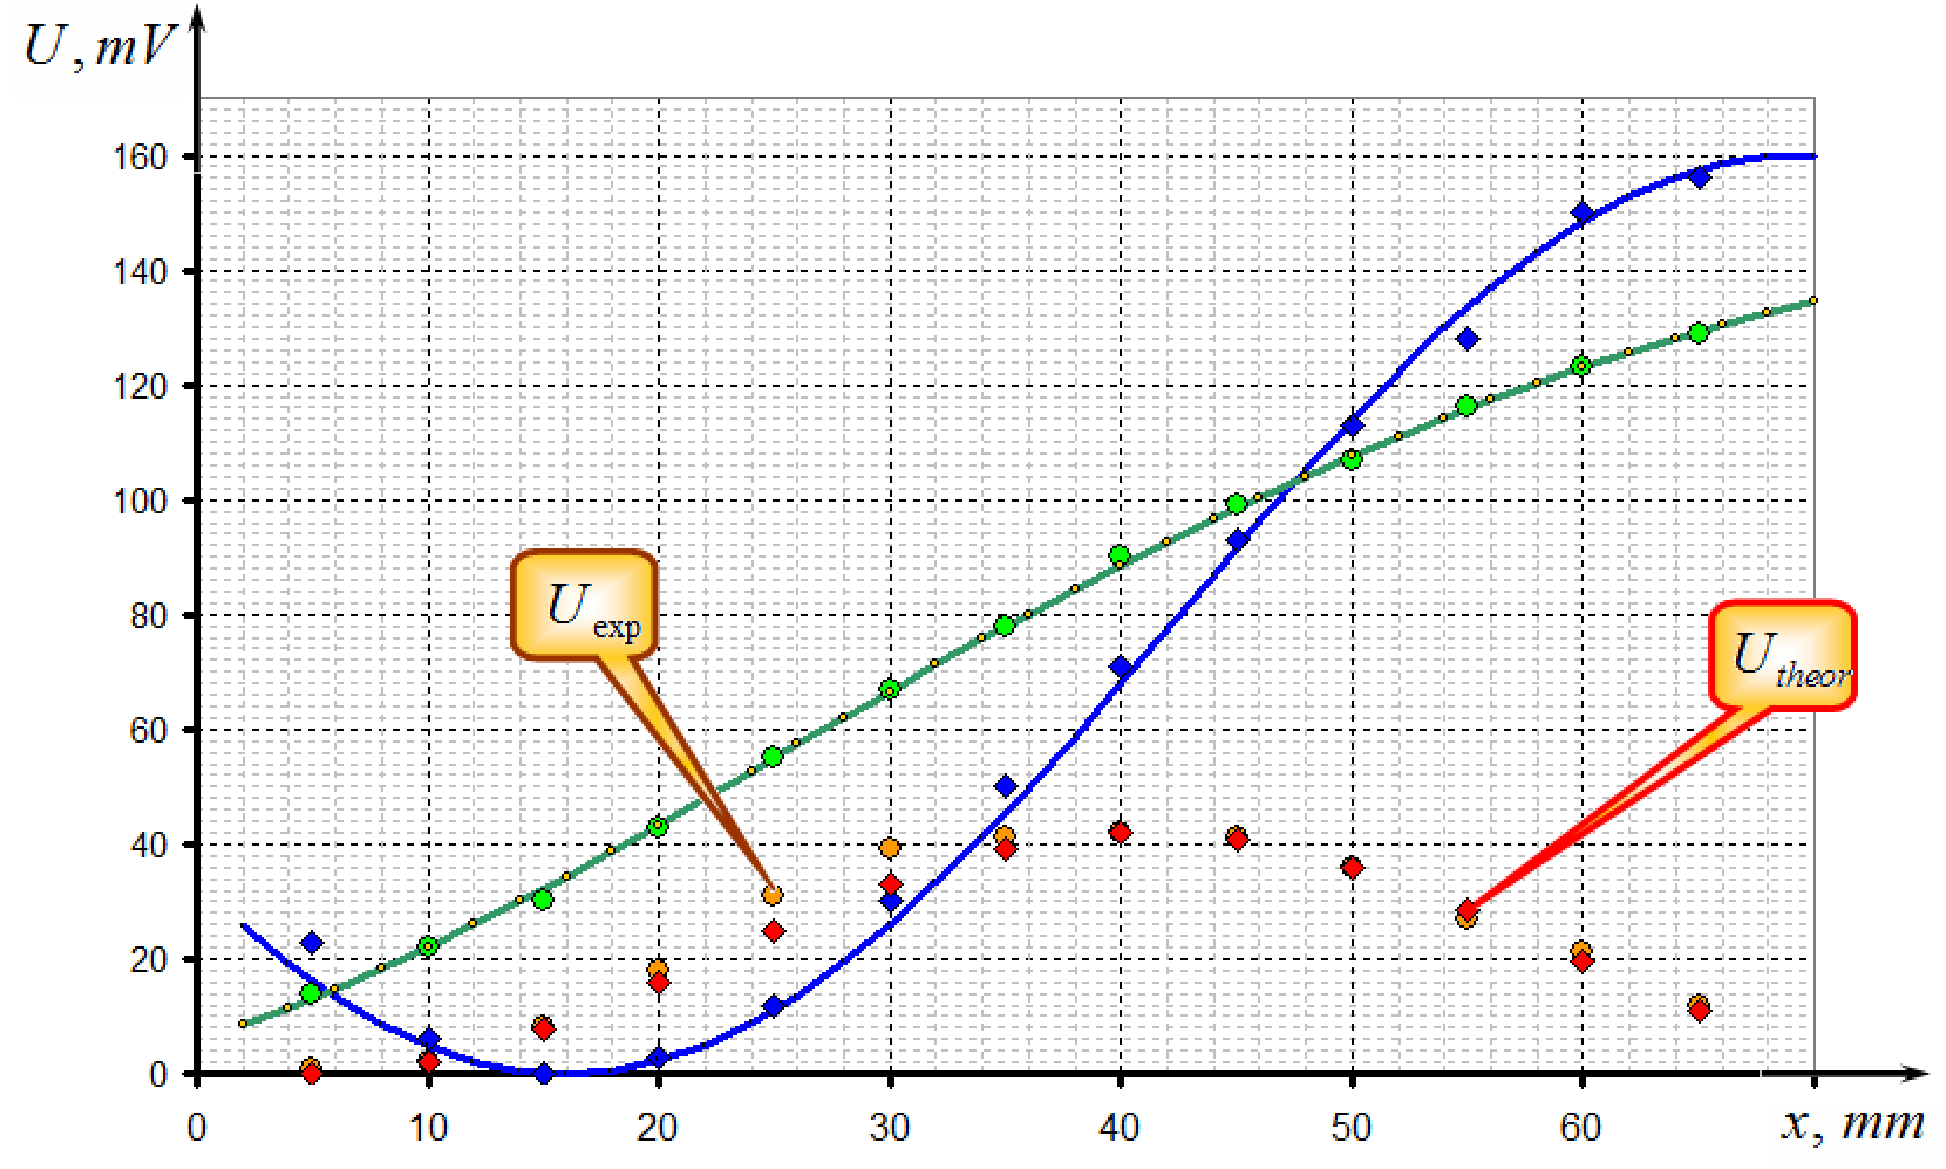
Results of the calculations are shown in table 3 and in the graph above. Consistency of theoretical calculations and experimental data can clearly be seen.
Оригинал в Архива: 2014_IPhO_Experimenta_Competition.pdf · официални решения: 2014_IPhO_Solution_to_Experimental_Competition.pdf