IZhO 2011, Експеримент — Задача 1. Deformation, Hysteresis, and Bistability
VII International Zhautykov Olimpiad/Experimental Competition — EXPERIMENTAL COMPETITION, 17 January, 2011 · 17 януари 2011 г.
Please read the instructions first:
The Experimental competition consists of one problem. This part of the competition lasts 3 hours.
Please only use the pen that is provided to you.
You can use your own non-programmable calculator for numerical calculations. If you don’t have one, please ask for it from Olympiad organizers.
You are provided with Writing sheet and additional papers. You can use the additional paper for drafts of your solutions but these papers will not be checked. Your final solutions which will be evaluated should be on the Writing sheets. Please use as little text as possible. You should mostly use equations, numbers, figures and plots.
Use only the front side of Writing sheets. Write only inside the bordered area.
Fill the boxes at the top of each sheet of paper with your country (Country), your student code (Student Code), the question number (Question Number), the progressive number of each sheet (Page Number), and the total number of Writing sheets (Total Number of Pages). If you use some blank Writing sheets for notes that you do not wish to be evaluated, put a large X across the entire sheet and do not include it in your numbering.
At the end of the exam, arrange all sheets for each problem in the following order:
- Used Writing sheets in order;
- The sheets you do not wish to be evaluated
- Unused sheets and the printed question.
Place the papers inside the envelope and leave everything on your desk. You are not allowed to take any paper or equipment out of the room
Условие
Instruments and equipment: rubber cord, wooden stand with the column, wooden ruler, 6 weights by 100 g each, measuring tape, thread, and pins.
Part 1. Stretching (4.5 points) (4,5 т.)
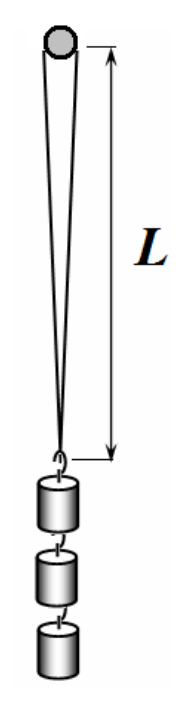
1.1 Fix the rubber cord to one side of the wooden column with the pins provided (Fig. 1). Measure the dependence of the cord length on the gravity force of hanging weights. Carry out your measurements in two different ways:
loading process, i.e. increasing step-by-step the number of weights from 0 to 6;
unloading process, i.e. decreasing step-by-step the number of weights from 6 to 0.
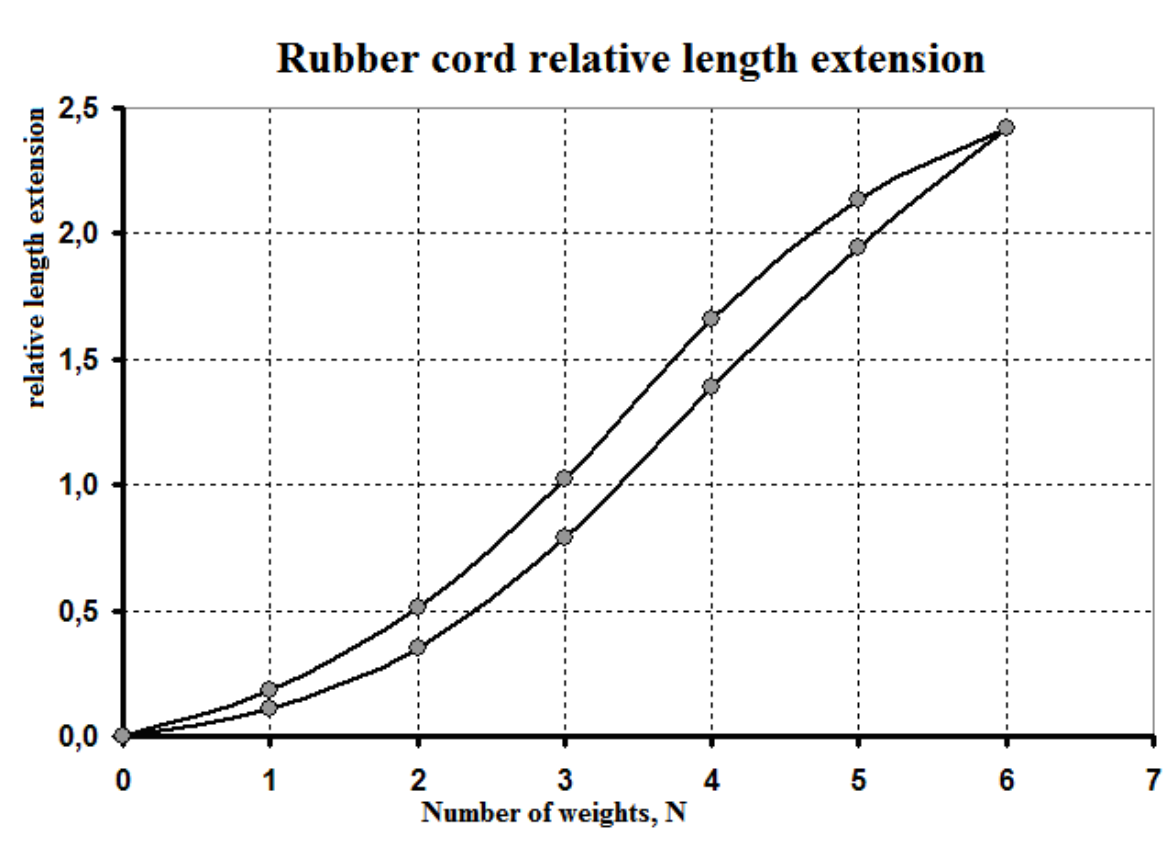
1.2 Plot in the same graph the relative elongations of the rubber cord as a function of the gravity force of hanging weights at loading and unloading processes.
Part 2. Equilibrium (7.5 points) (7,5 т.)
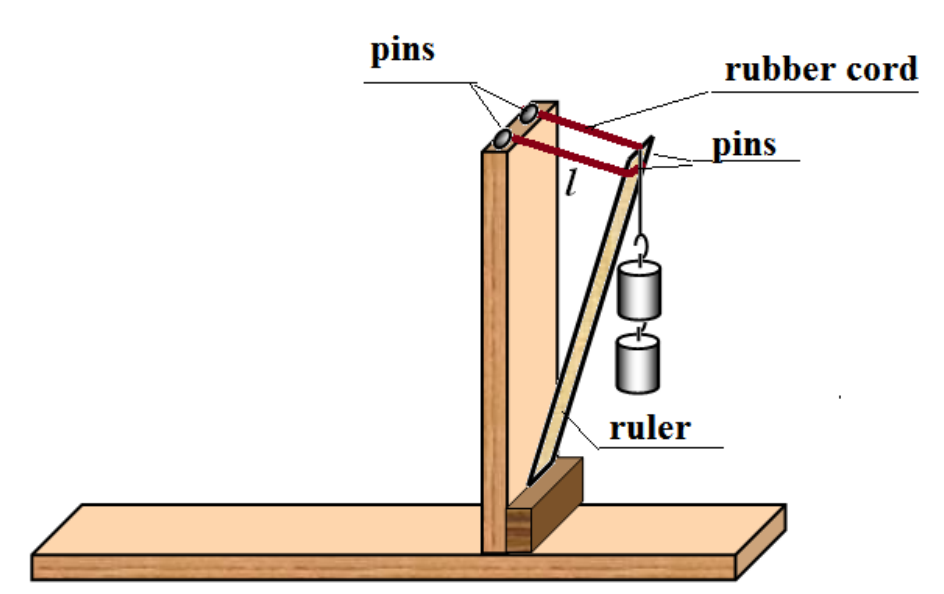
Place the ruler near the vertical wall of the column as shown in Fig. 2. Attach the rubber cord to the top of the ruler with the pins provided. Attach the other end of the cord to the column with the pins. The cord length in the unstrained state should be about 8 cm. The distance from the lower edge of the ruler to the top of the vertical column of the stand (see Fig. 2) is equal to the ruler length. Tie a thread to the top of the ruler so that the weights could be hanged on.
Attention! You will have to measure the length of the cord with different number of hanging weights.
Attaching the rubber cord, keep both sides to have the same length. For the sake of security wrap the rubber cord around the pins several times. Tie a knot at the end of the thread, attach it to the ruler upper side with the pins, and then put it over the upper edge of the ruler.
All measurements should be carried out very carefully: if you change the number of weights, hold the ruler by hand, then slowly move it downward or move upward until it comes into equilibrium, try to avoid oscillation of the weights. You can gently move the lower edge of the ruler horizontally along the column to find a more stable position of the ruler with the weights.
Theoretical description
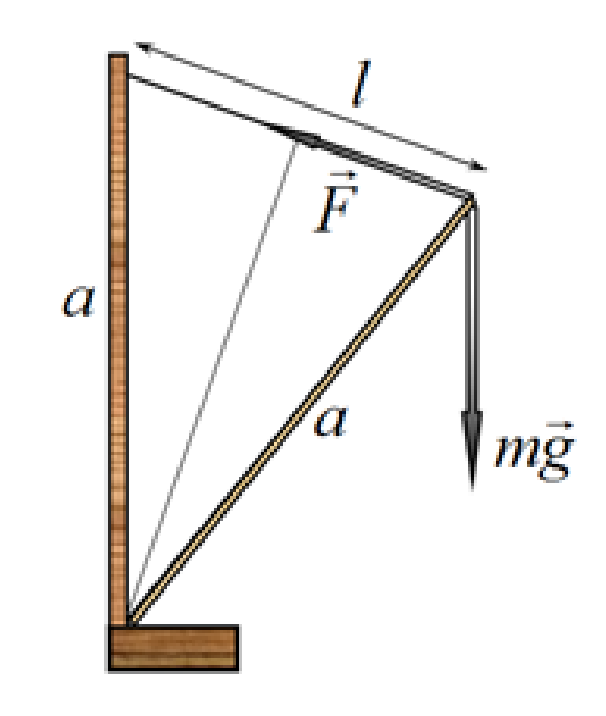
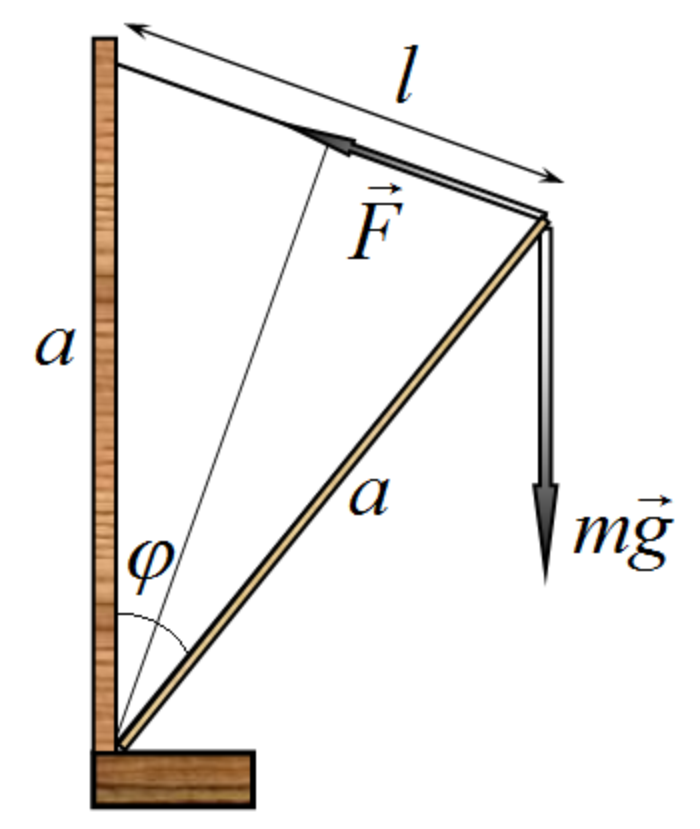
2.1 Show that the condition of equilibrium of the ruler fixed as described above has the form:
where is the length of the cord, denotes the elastic force of the cord at its length , stands for the length of the ruler, is the gravity force of hanging weights.
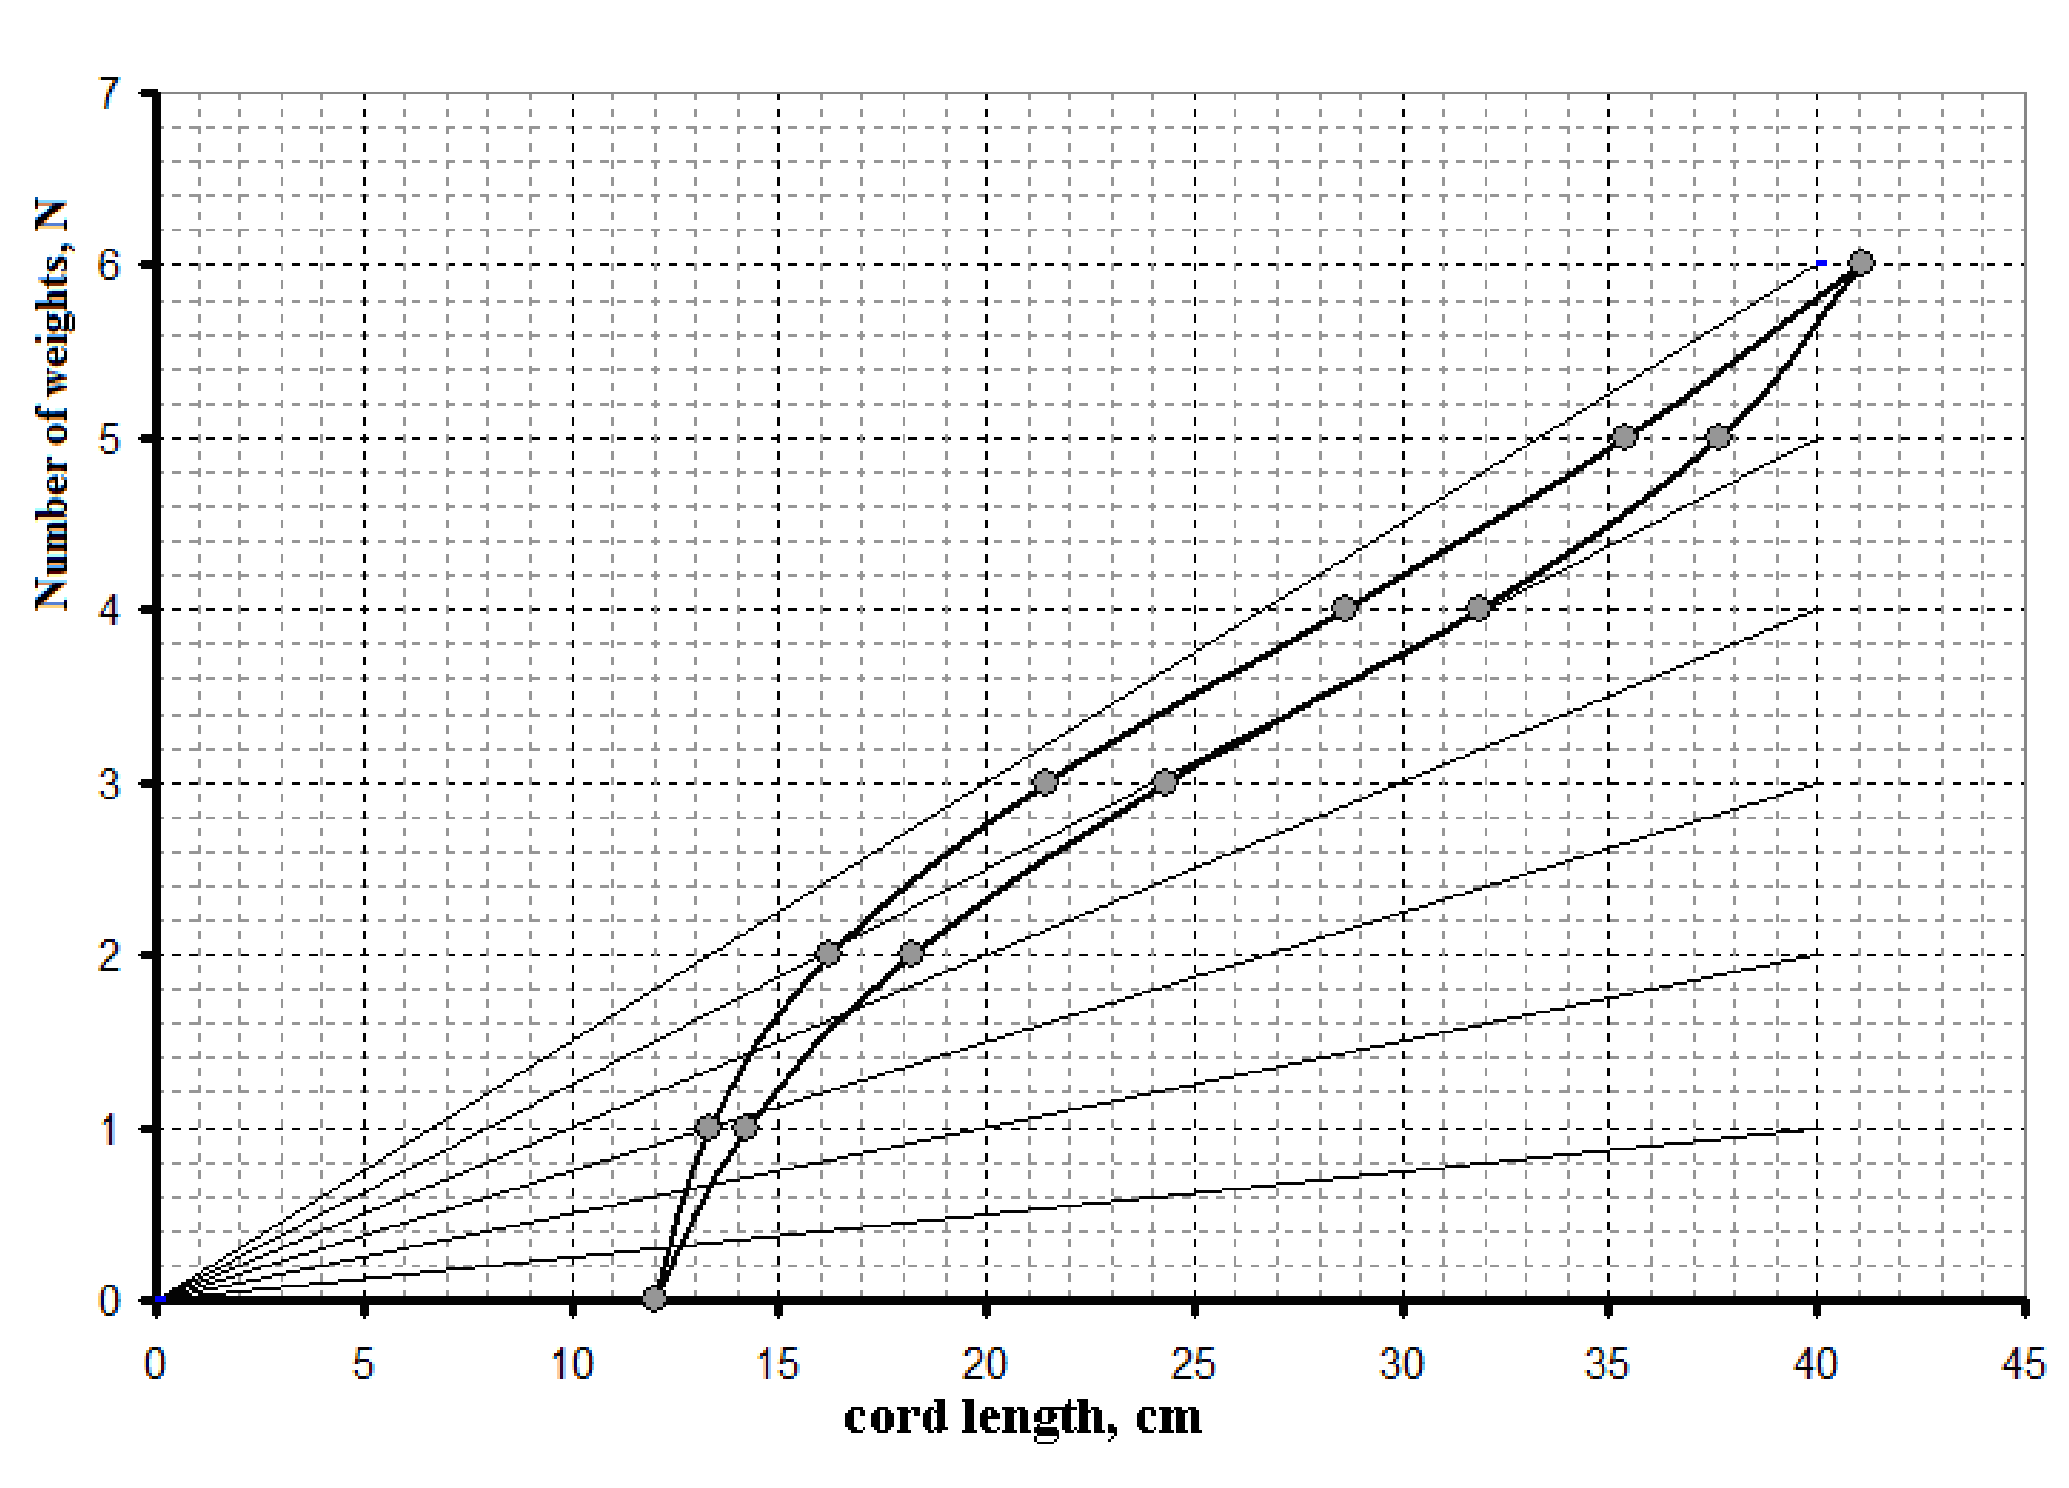
2.2 Using the data obtained in the first part of this experimental problem, plot in the same graph the dependences of the elastic force as a function of the length of the rubber cord at loading and unloading processes. Please, do not forget that the initial length of the cord in this part of the experiment is different from that of the previous Part 1! In the same graph, plot 6 graphs for each of the six possible number of weights.
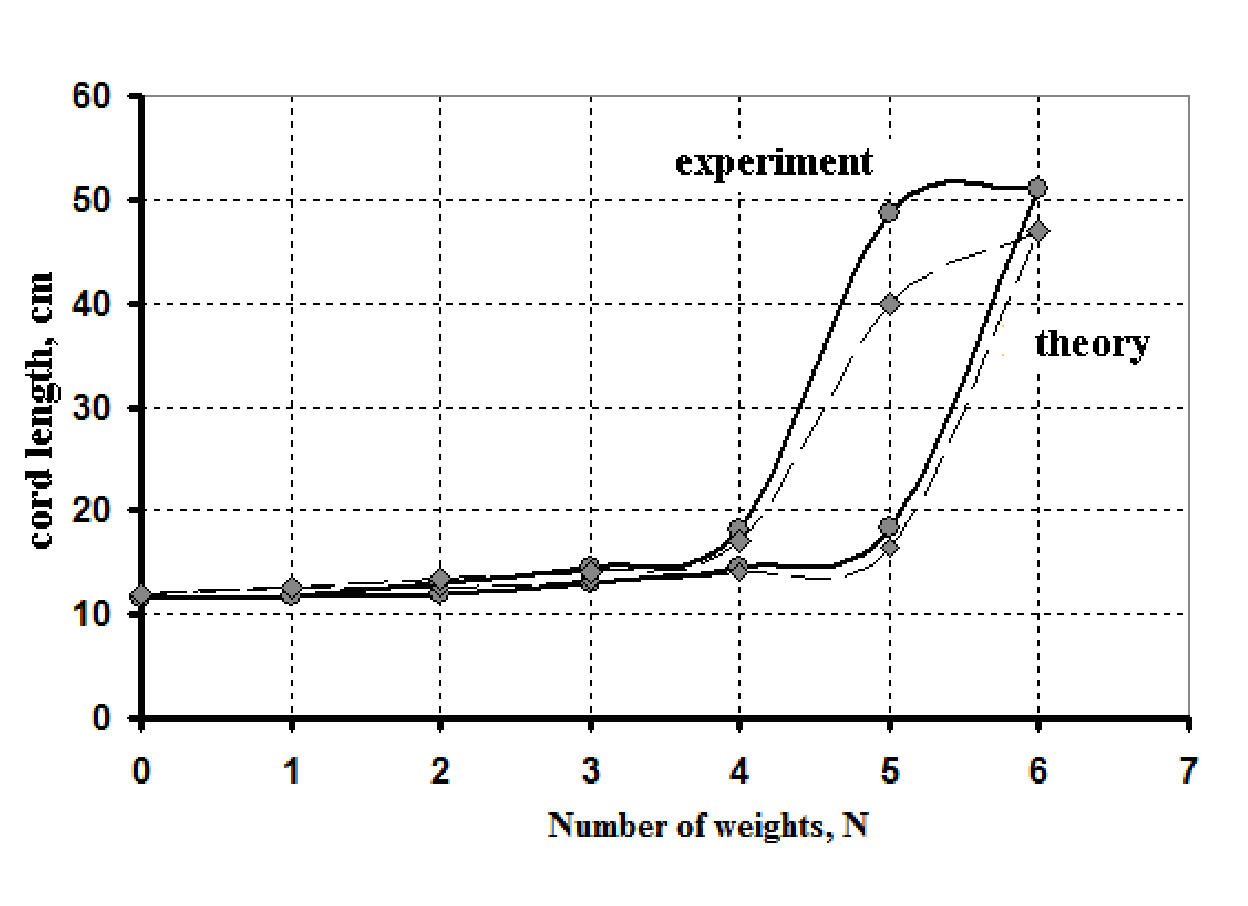
2.3 Using these plots find values of the cord length corresponding to equilibrium positions at various number of weights in two cases: for the loading and for the unloading processes. Plot in the same graph the cord lengths in the equilibrium position against the gravity force of hanging weights for the loading (consecutive increase in the number of weights) and unloading processes (consecutive decrease in the number of weights).
Experiment
2.4 Conduct measurements of the dependence of the cord length in the equilibrium as a function of the gravity force of hanging weights. Measurements are to be made in two ways, i.e. for loading and unloading processes.
2.5 In the same plot you drawn in Section 2.3, plot the obtained experimental curves.
Part 3. Bistability (3 points) (3 т.)
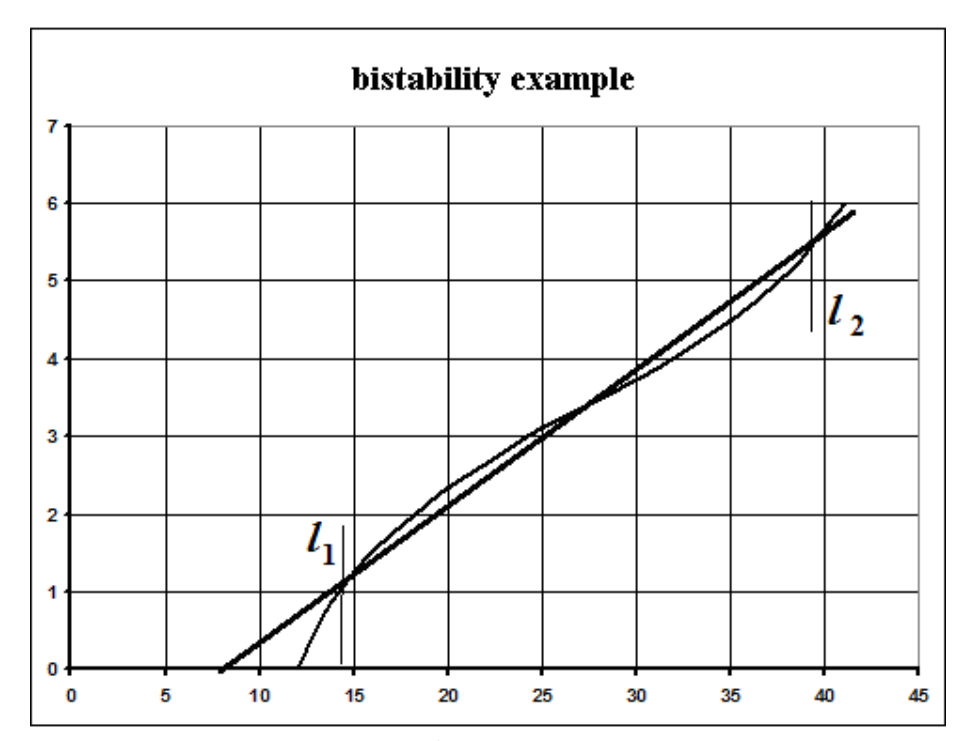
If the lower edge of the ruler is shifted away from the vertical column (see Fig. 3), then at a certain length of the rubber cord and some number of weights it is possible to find two stable equilibrium positions of the ruler (bistability): the first one closer to the vertical, the second one closer to the horizon. In this Part you have to determine the conditions under which the bistability occurs.
We can show (but you do not need to do that!) that for the small displacement of the lower edge of the ruler, the equilibrium condition (1) is approximately described by the following formula:
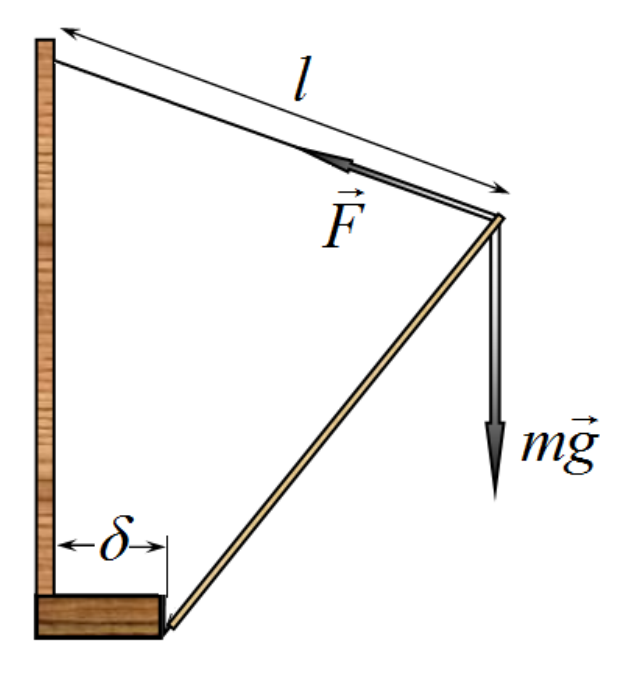
3.1 Plot schematically in the figure taken from section 2.3 such a function that it represents the existence of two stable equilibrium positions and mark them on the figure. In the function you can vary both parameters and at your will.
3.2. The length of the free part of the rubber cord should be the same as in Part 2. Find experimentally two stable equilibrium positions of the ruler at the same number of weights. Find and write down at which number of weights those two stable positions really exist. Measure and write down the two lengths of the rubber cord at which these two equilibrium positions are achieved.
To search for the two equilibrium positions: a) put the ruler almost vertically and allow it to go down slightly holding by hand, b) stretch the cord until the ruler is almost in horizontal position and allow it to rise slowly holding gently by hand. Repeat these procedures several times!
When you try to find the bistability you are allowed to change slightly the free length of the rubber cord. If this length is changed, please, measure it and write down its new value (in cm).
Отговори
- Part 3. Bistability (3 points), 3.2. Bistability at 5 or 6 weights (500 or 600 g); cord lengths 13 - 14 cm and 36 - 44 cm.
Решение
SOLUTIONS FOR EXPERIMENTAL COMPETITION
Part 1
The measurement results are shown in Table 1. The last column gives the calculated values of the strain . The plot of the rubber cord length relative extension against the weights is shown in Fig. 1; 1 weight = 100 g.
| Number of weights, N | L, cm | |
|---|---|---|
| 0 | 20,8 | 0,00 |
| 1 | 23,1 | 0,11 |
| 2 | 28,1 | 0,35 |
| 3 | 37,2 | 0,79 |
| 4 | 49,7 | 1,39 |
| 5 | 61,3 | 1,95 |
| 6 | 71,2 | 2,42 |
| 5 | 65,2 | 2,13 |
| 4 | 55,3 | 1,66 |
| 3 | 42,1 | 1,02 |
| 2 | 31,5 | 0,51 |
| 1 | 24,6 | 0,18 |
| 0 | 20,8 | 0,00 |
Table 1
Part 2
2.1 The equilibrium condition follows from equating the torques of the elastic and the gravity forces written as
where is the angle of deviation from the vertical. Taking into account that and , we obtain the condition (1).
2.2 When plotting these graphs it is necessary to renormalize the length of the rubber cord for each value of the stretching force: . The curves of the functions are straight lines passing through the origin. Required drawing is carried out in Fig. 2.
Equilibrium positions correspond to the intersection points of the graphs.
Table 2 represents the equilibrium positions found both with the help of Fig. 2 and obtained experimentally. Fig. 3 shows the corresponding curves, a fairly good agreement is achieved.
| F, N | L, exp. | L, theory |
|---|---|---|
| 0 | 11,6 | 12,0 |
| 1 | 11,7 | 12,5 |
| 2 | 12,0 | 12,7 |
| 3 | 13,1 | 13,2 |
| 4 | 14,6 | 14,0 |
| 5 | 18,4 | 16,5 |
| 6 | 51,0 | 47,0 |
| 5 | 48,7 | 40,0 |
| 4 | 18,2 | 17,0 |
| 3 | 14,6 | 14,0 |
| 2 | 13,0 | 13,5 |
| 1 | 11,8 | 12,5 |
| 0 | 11,6 | 12,0 |
Table 2
Part 3. Bistability.
The bistability is possible when the straight line has three intersection points with the plot of the elastic force. A possible graph is shown in Fig. 4. Note that the intermediate position of equilibrium is unstable!
With the equipment provide the bistability is clearly observed at 5 or 6 weights (500 or 600 g).
The equilibrium positions correspond to the rubber cord lengths 13 - 14 cm and 36 - 44 cm.
Marking scheme
| Content | Points | |
|---|---|---|
| Часть 1. Растяжение. | 4,5 | |
| 1.1 | Measurements: | |
| - measurements made (12 points); | 1 | |
| - the hysteresis loop obtained; | 0,5 | |
| - measurement made with the accuracy less than 20% | 1,0 | |
| - measurement made with the accuracy less than 30% | (0,5) | |
| 1.2 | The plot of the unit elongation against the gravity of hanging weights: | |
| - calculation of the unit elongation for all experimental points; | ||
| - the graph plotted (the axes are named and ticked; the points are placed according to the table; the approximate curve is drawn) | 1 | |
| 1 | ||
| Part 2. Equilibrium | 7,5 | |
| 2.1 | The proof for the equilibrium position: | |
| - the torque of the gravity force; the torque of the elastic force; | 0,5 | |
| - geometrical relations and trigonometric transformations; | 0,5 | |
| 2.2 | The theoretical calculation of the cord length: | |
| - formula for calculation of the cord length from the unit elongation; | 0,5 | |
| - calculation for all values of the elastic force; | 0,5 | |
| - the graph of the elastic force against the cord length (the axes are named and ticked; the points are placed according to the table; the approximate curve is drawn); | 0,5 | |
| - 6 straight lines drawn; | 0,5 | |
| 2.3 | -the values are taken from the graph (12 points); | 0,5 |
| - the theoretical curve of the cord length against the gravity force (he axes are named and ticked; the points are placed according to the table; the approximate curve is drawn); | 0,5 | |
| 2.4 | Measurements: | |
| - measurements conducted (10 points); | 1 | |
| - the hysteresis loop is obtained (differences at 4 and 5 weights); | 0,5 | |
| - measurement conducted with the accuracy less than 20%; | 1,0 | |
| - measurement conducted with the accuracy less than 50%; | (0,5) | |
| 2.5 | The experimental graph drawn: | |
| - the points are placed according to the table; | 0,5 | |
| - the approximate curve is drawn. | 0,5 | |
| Part 3. Bistability | 3 | |
| 3.1 | The qualitative explanation of the bistability: | |
| - the approximate curve of the gravity force against the cord length; | 0,5 | |
| - the shifted straight line is drawn to have three intersection points; | 0,5 | |
| - the stable equilibrium positions are determined; | 0,5 | |
| 3.2 | the stable equilibrium positions are found experimentally: | |
| - at the weight 500 g (or 600 g is possible); | 1 | |
| - the cord lengths at equilibrium positions are obtained in the intervals stated above | 0,5 |
Теми и трудност
Трудност: неоценена.
Механика · Еластичност · Статично равновесие
Предпоставки: Гимназиална подготовка
Оригинал в Архива: IZhO-2011-Exp_eng.pdf · официални решения: IZhO-2011-Exp_eng_sol.pdf