IZhO 2012, Експеримент — Задача 1. Electric currents in volume
VIII International Zhautykov Olimpiad/Experimental Competition — EXPERIMENTAL COMPETITION, 18 January, 2012 · 18 януари 2012 г. · 15 т.
Please read the instructions first:
The Experimental competition consists of one problem. This part of the competition lasts 3 hours.
Please only use the pen that is provided to you.
You can use your own non-programmable calculator for numerical calculations. If you don’t have one, please ask for it from Olympiad organizers.
You are provided with Writing sheet and additional papers. You can use the additional paper for drafts of your solutions but these papers will not be checked. Your final solutions which will be evaluated should be on the Writing sheets. Please use as little text as possible. You should mostly use equations, numbers, figures and plots.
Use only the front side of Writing sheets**.** Write only inside the bordered area.
Fill the boxes at the top of each sheet of paper with your country (Country**),** your student code (Student Code), the question number (Question Number**)**, the progressive number of each sheet **(**Page Number), and the total number of Writing sheets (Total Number of Pages). If you use some blank Writing sheets for notes that you do not wish to be evaluated, put a large X across the entire sheet and do not include it in your numbering.
At the end of the exam, arrange all sheets for each problem in the following order:
- Used Writing sheets in order;
- The sheets you do not wish to be evaluated
- Unused sheets and the printed question.
Place the papers inside the envelope and leave everything on your desk. You are not allowed to take any paper or equipment out of the room
Условие
Instruments and equipment: Measuring glass (vessel) of 250 ml, two steel spokes, multimeter, power supply (4.5 V battery), resistor with a resistance of several kΩ, two-pole switch, plastic tube for a cocktail, connecting wires, clean water, plastic cup, rubber, ruler, and adhesive tape.
You should be familiar with the formula for calculating the resistance of a thin cylindrical conductor,
where is the specific resistance of the conducting material, is its length, is its cross-sectional area.
However, when an electric current flows in a bulk system, trajectories of charged particles may be different, so the resistance of the medium depends on the nature of the distribution of electric currents.
In this experiment you have to measure the electric resistance of the water layer when the current flows between the spokes submerged in water.
From time to time clean the spokes with rubber.
After each series of experiments, change water in the vessel.
Do not apply strong currents through the water because this leads to appearance of a large number of ions that can "spoil" the results of your experiments.
Straighten the spokes. In all the experiments try to maintain the spokes in parallel to each other
Part 1. [0.5 points]
1.1 Measure the resistance of the given resistor by using the multimeter. Record the result of your measurement. [0,2 т.]
To measure the resistance of the water between the spokes, use an electric circuit shown in the figure on the right. Here, is the given resistor, is the resistance of the water between the spokes to be measured.
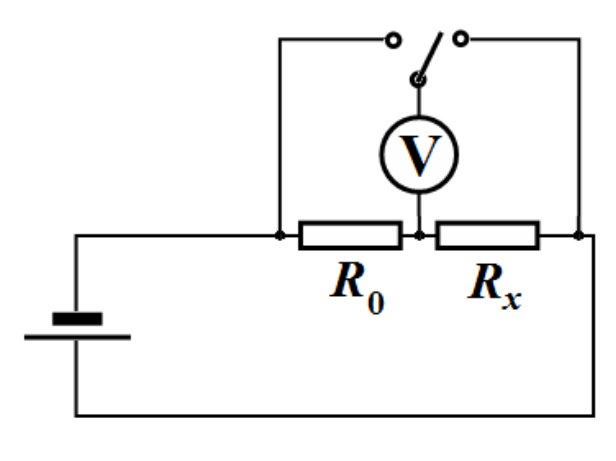
1.2 For this circuit write down the formula which will be used by you to calculate the water resistance between the spokes. [0,3 т.]
In the following, please use only the circuit above to measure the resistance !
In any case do not measure water resistance directly by the multimeter. Use multimeter only as a voltmeter.
Direct measurement of the resistance with a multimeter leads to a rapid discharge of its battery, and in addition, the voltage of the battery is rather high (9 V) to change the electrical properties of water.
Error analysis is not required in this Competition!
Part 2. [5 points]
Put the two spokes provided along the vessel walls keeping them in parallel at a maximum distance from each other. Bend the upper ends of the spokes over the edges of the vessel. Additionally fix them with strips of adhesive tape.
To measure the height of the water level use the scale engraved on the vessel. Determine in millimeters the division value of the scale engraved on the vessel wall.
2.1 Measure dependence of the water resistance between the spokes as a function of the height of water poured into the vessel. Plot the obtained dependence in a graph. [2,5 т.]
2.2 Draw schematic streamlines of electric currents in this case (make two draws: one in the plane of the spokes and the other in the plane perpendicular to the spokes). [0,5 т.]
Streamlines of electric current are trajectories of charged particles.
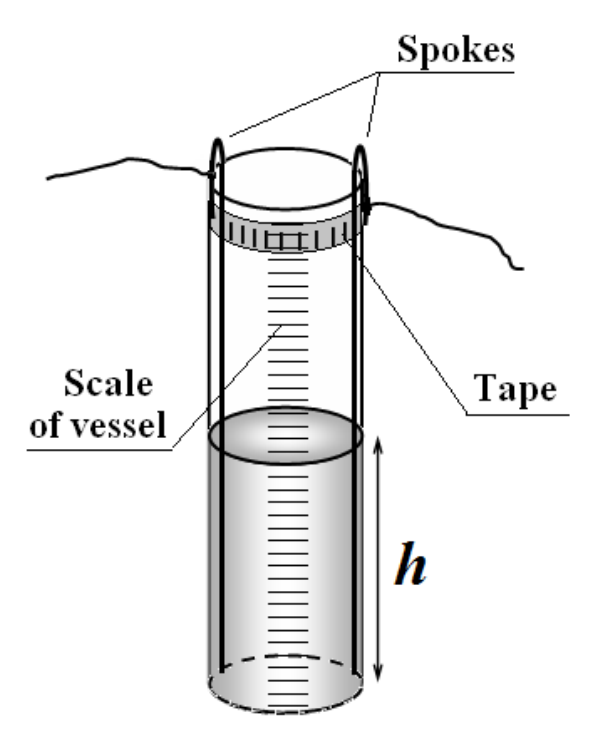
2.3 On the basis of physical considerations about the nature of this current flow, make an assumption about the form of the obtained experimental dependence , and write it as a formula. [0,8 т.]
2.4 Using the linearization method, check the validity of the made assumption by plotting a graph in such coordinates that it becomes a straight line . Determine the numerical values of the parameters of the linearized dependence, as well as unknown values of parameters in the function . [1,2 т.]
Part 3. [3.5 points]
Fix one of the spokes close to the wall inside the vessel. Pour 200 ml of water into the vessel. Move the second spoke along the wall, changing the distance between the spokes. The depth of immersion of the second spoke should be maximal. Spokes should be positioned vertically and in parallel to each other.
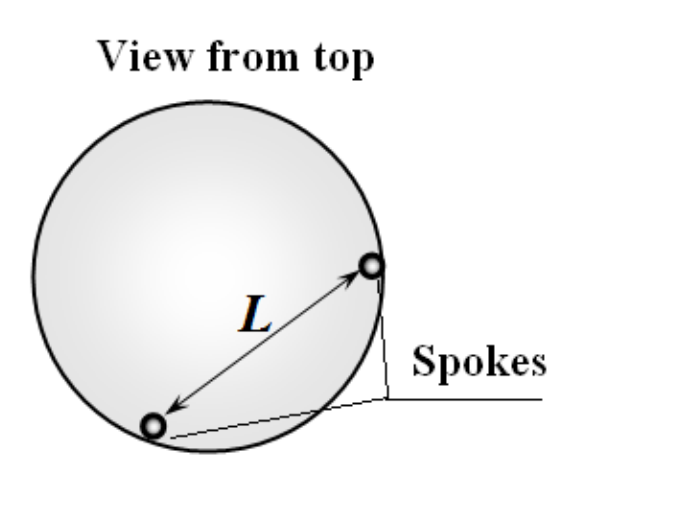
3.1 Measure the water resistance between the spokes as a function of the distance between them. Plot the obtained dependence. [1,5 т.]
3.2 On the basis of physical considerations about the nature of this current flow, make an assumption about the form of the obtained experimental dependence , and write it as a formula. [1 т.]
3.3 Using the linearization method, check the validity of the made assumption by plotting a graph in such coordinates that it becomes a straight line . Determine the numerical values of the parameters of the linearized dependence, as well as unknown values of parameters in the function . [1 т.]
Part 4. [4 points]
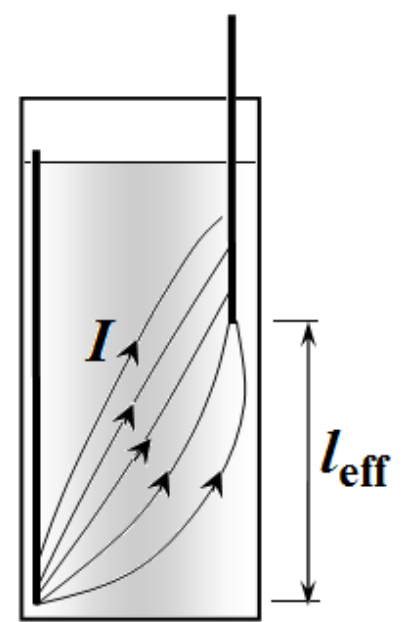
Put one of the spokes into the given plastic tube so that its lower end of a length of about 1 cm remains uncovered by the tube. Fill in the vessel with water about to top end. The upper edge of the tube should be placed above the water level, and fixed to the spoke by the tape. Put the second uncovered spoke into the water keeping its lower end at different heights. Keep the spokes in parallel at a maximum distance from each other.
4.1 Measure the water resistance between the spokes as a function of the height of the end of the second spoke. Plot the obtained dependence in a graph. [2,4 т.]
4.2 Draw a schematic streamlines of electric current in this case (in the plane of the spokes). [0,3 т.]
4.3 On the basis of physical considerations on the nature of current flow, make an assumption about the form of the obtained experimental dependence , and write it as a formula. [0,4 т.]
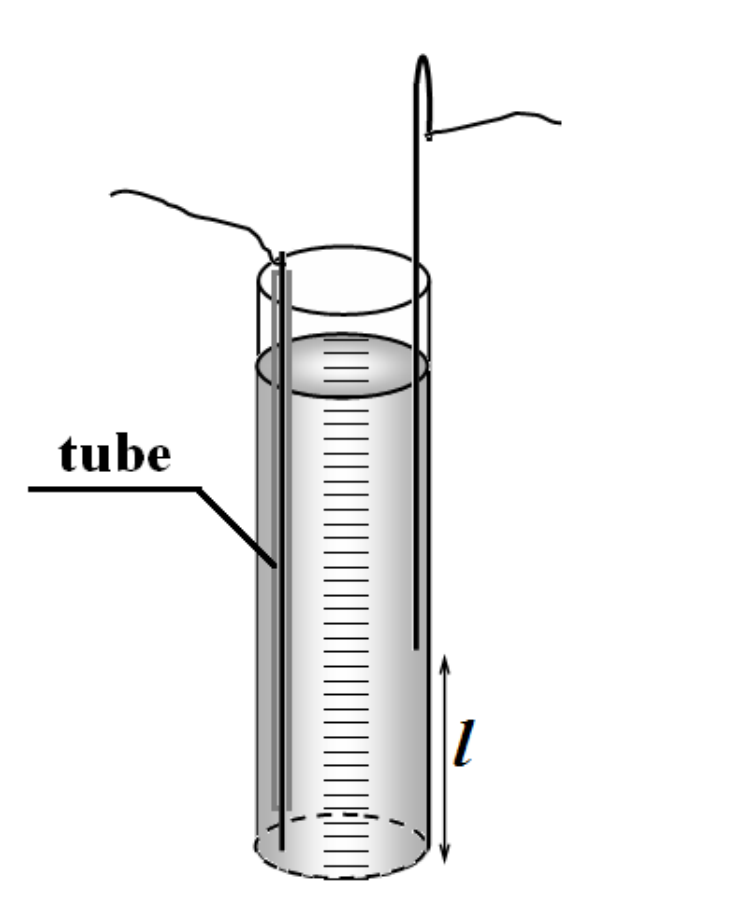
4.4 In the plot, specify the range of values of in which the assumed formula for is confirmed experimentally. [0,1 т.]
4.5 Determine the numerical values of the parameters in the assumed formula for . [0,8 т.]
Part 5. [2 points]
5.1 On the basis of the above obtained experimental data (please choose which one to use) estimate the specific resistance of the water. [2 т.]
Отговори
5.1 83 Ω·m
Official solution: ρ ≈ 83 Ω·m; the grading scheme quotes the reference value (80 Ω·m) and accepts 60–100 for full marks.
Решение
SOLUTIONS FOR THE EXPERIMENTAL COMPETITION
Electric currents in volume
PART 1
1.1 The resistance of the resistor provided is equal .
1.2 Since the resistors are connected in series the same current flows through each of them, then the following relation holds
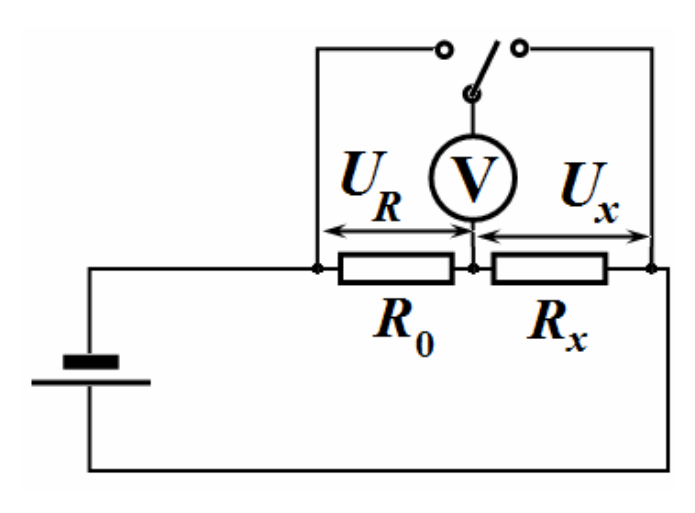
from which it follows that
Thus, to measure an unknown resistance it is enough to measure the voltage drops on the unknown resistance and the resistor provided.
If the source voltage was stabilized, it would be sufficient to measure the voltage drop on just one of them.
PART 2
2.1 The results of measurement of the voltage drops against the height of the water poured into the vessel are presented in Table 1. This table also shows the calculated resistance of the water between the electrodes (spokes).
Note that the height was measured by the scale of the measuring glass.
Table 1. Dependence of the resistivity on the height of the water level.
| , div. | , div | , V | , V | , kΩ | , kΩ |
|---|---|---|---|---|---|
| 30 | 3,33 | 3,82 | 1,08 | 7,07 | 0,14 |
| 40 | 2,50 | 3,60 | 1,30 | 5,54 | 0,18 |
| 50 | 2,00 | 3,36 | 1,54 | 4,36 | 0,23 |
| 60 | 1,67 | 3,17 | 1,73 | 3,66 | 0,27 |
| 70 | 1,43 | 3,01 | 1,89 | 3,19 | 0,31 |
| 80 | 1,25 | 2,84 | 2,06 | 2,76 | 0,36 |
| 90 | 1,11 | 2,69 | 2,21 | 2,43 | 0,41 |
| 100 | 1,00 | 2,59 | 2,31 | 2,24 | 0,45 |
| 110 | 0,91 | 2,48 | 2,42 | 2,05 | 0,49 |
| 120 | 0,83 | 2,38 | 2,52 | 1,89 | 0,53 |
| 130 | 0,77 | 2,30 | 2,60 | 1,77 | 0,57 |
| 140 | 0,71 | 2,22 | 2,68 | 1,66 | 0,60 |
| 150 | 0,67 | 2,16 | 2,74 | 1,58 | 0,63 |
| 160 | 0,63 | 2,08 | 2,82 | 1,48 | 0,68 |
| 170 | 0,59 | 2,03 | 2,87 | 1,41 | 0,71 |
| 180 | 0,56 | 1,96 | 2,94 | 1,33 | 0,75 |
| 190 | 0,53 | 1,93 | 2,97 | 1,30 | 0,77 |
| 200 | 0,50 | 1,86 | 3,04 | 1,22 | 0,82 |
| 210 | 0,48 | 1,80 | 3,10 | 1,16 | 0,86 |
| 220 | 0,45 | 1,76 | 3,14 | 1,12 | 0,89 |
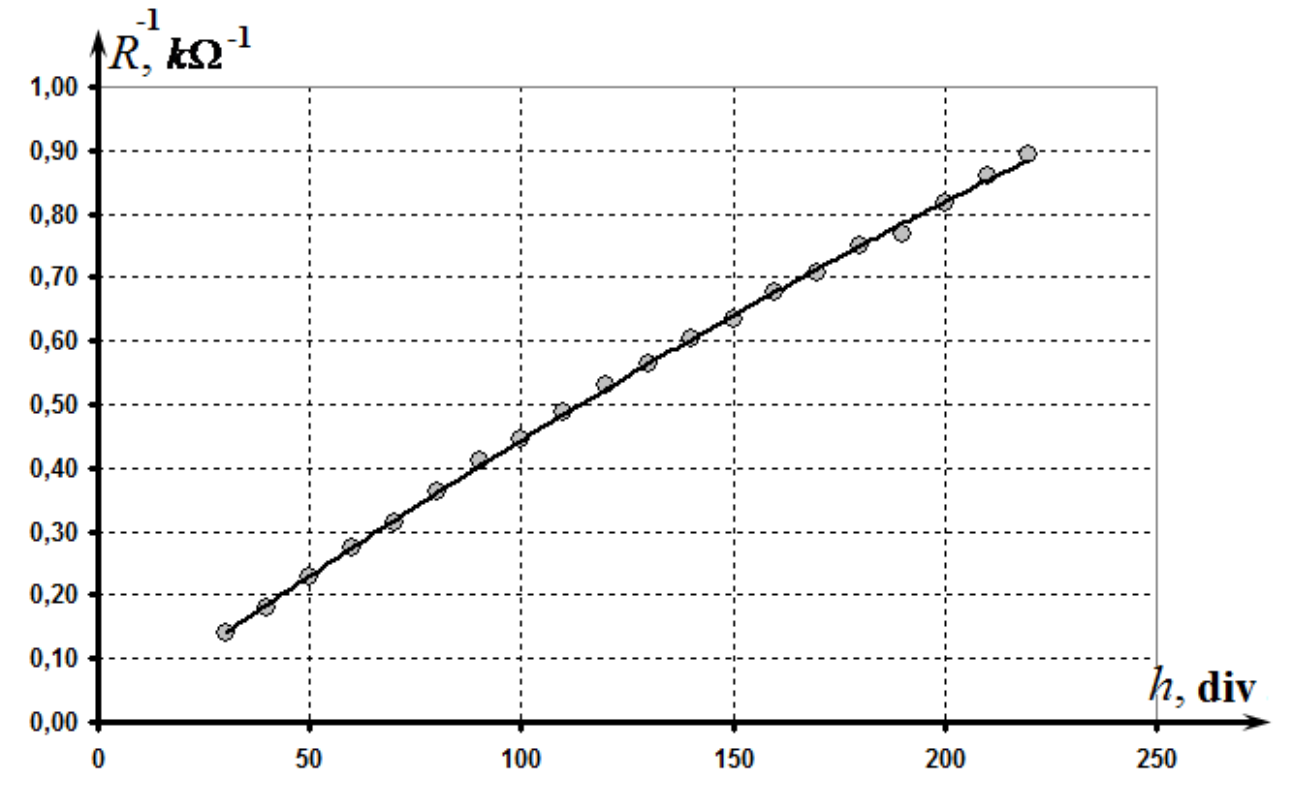
The graph of the obtained dependence is shown in the figure below.
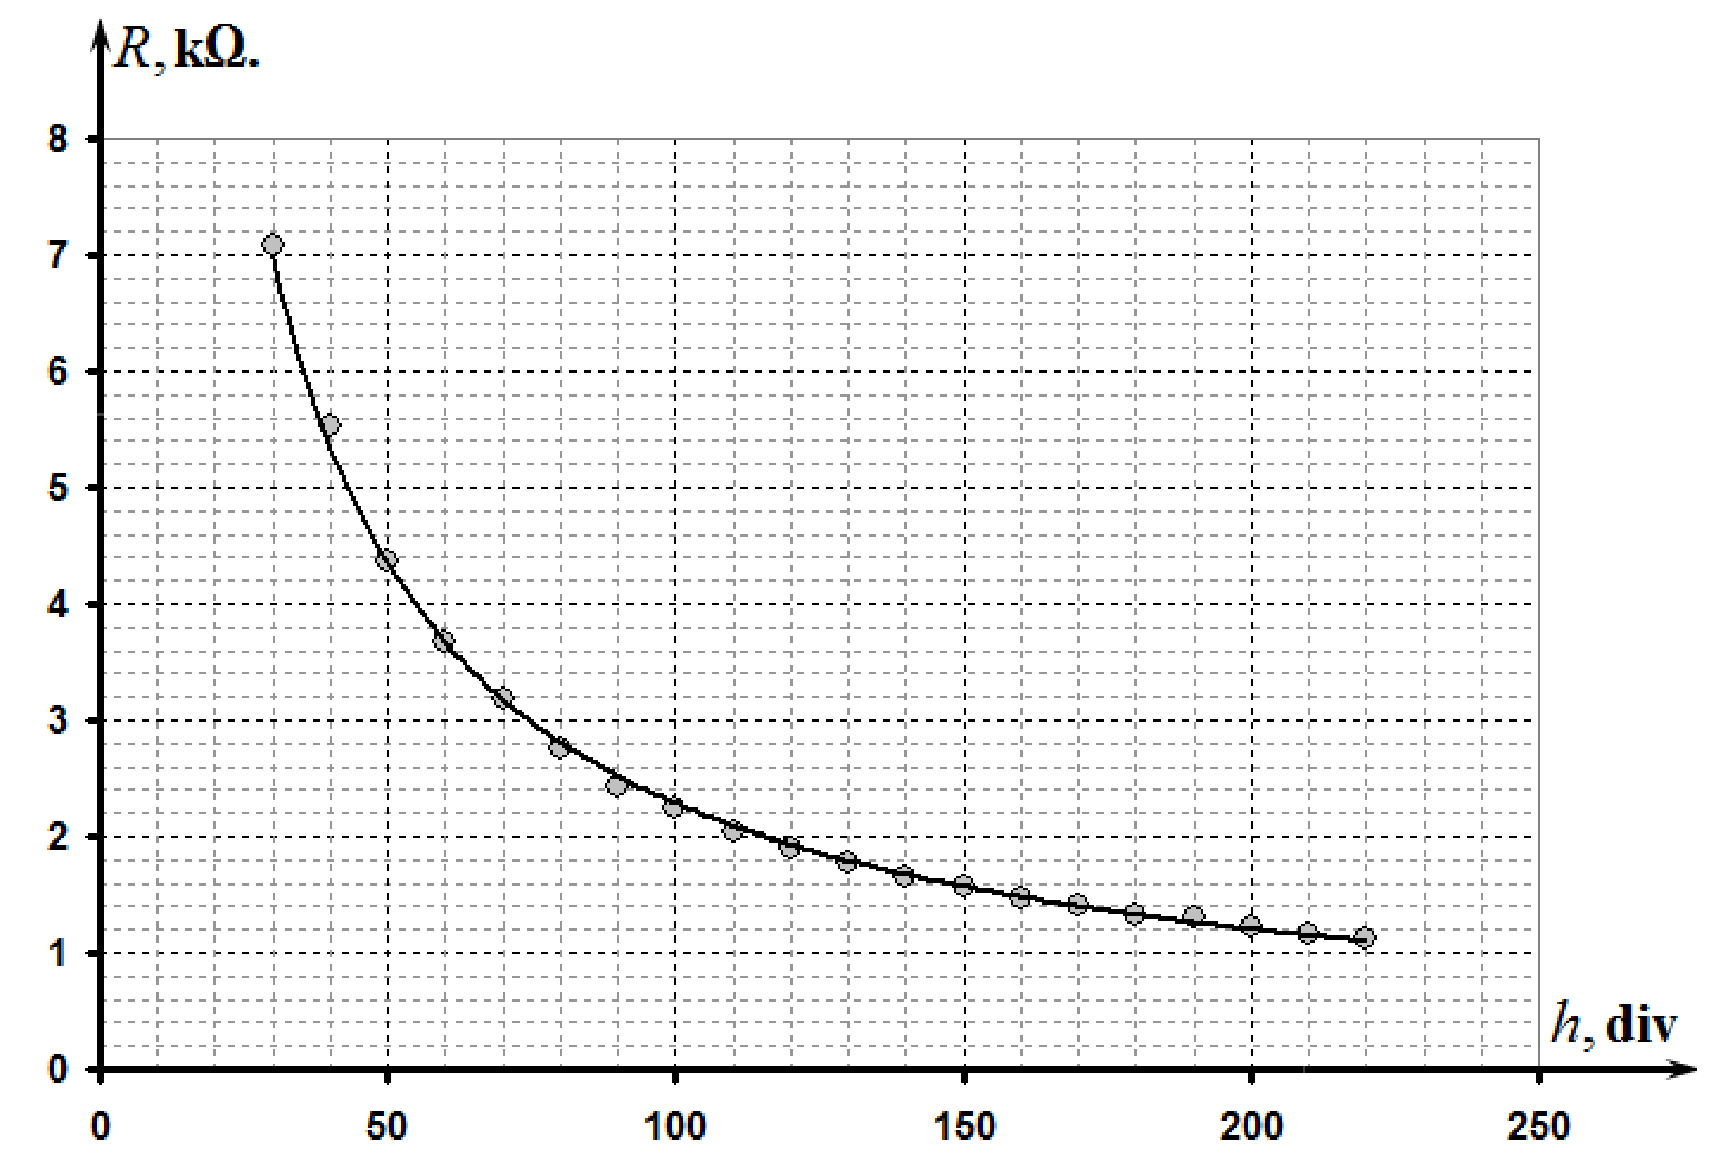
Simple measurement can easily show that the volume corresponds to the height .Therefore, the height of the water poured is calculated by the formula , i.e.the the division value of the scale is .
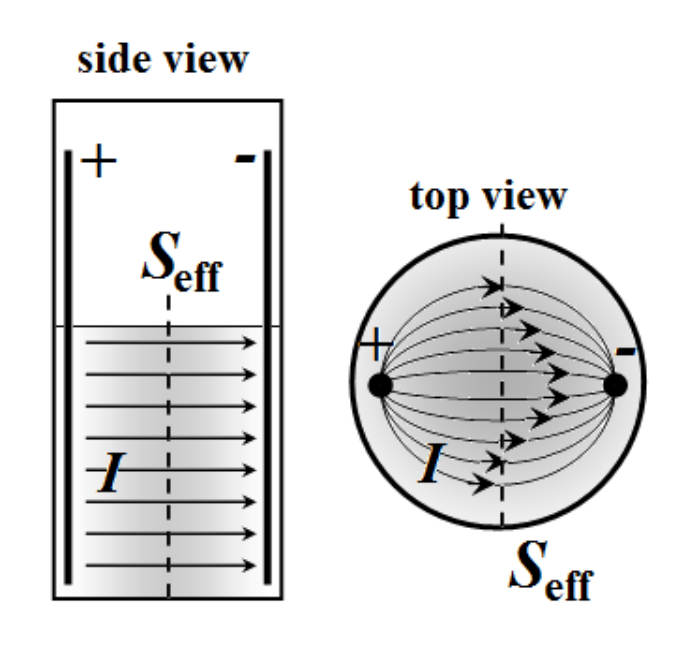
2.2 The current distribution is schematically shown in the figure on the right.
The current flows between the lateral surfaces of the spokes, thus the height of water level determines an effective cross-sectional area.
2.3 It is therefore reasonable to assume that the resistance of water between the spokes is inversely proportional to the height of water level
where is a constant meaning the water resistance of the unit of height. Then, the measured resistance should be described by the formula
where is a constant denoting the additional resistance (of contacts, of an oxide layer on the surface of the spokes, etc.).
2.4 To check the validity of formula (3) it is sufficient to plot the dependence of the resistance on the inversed height of the water column . That is, the linear dependence should be observed for the following values:
A graph of this function is shown in the figure below.
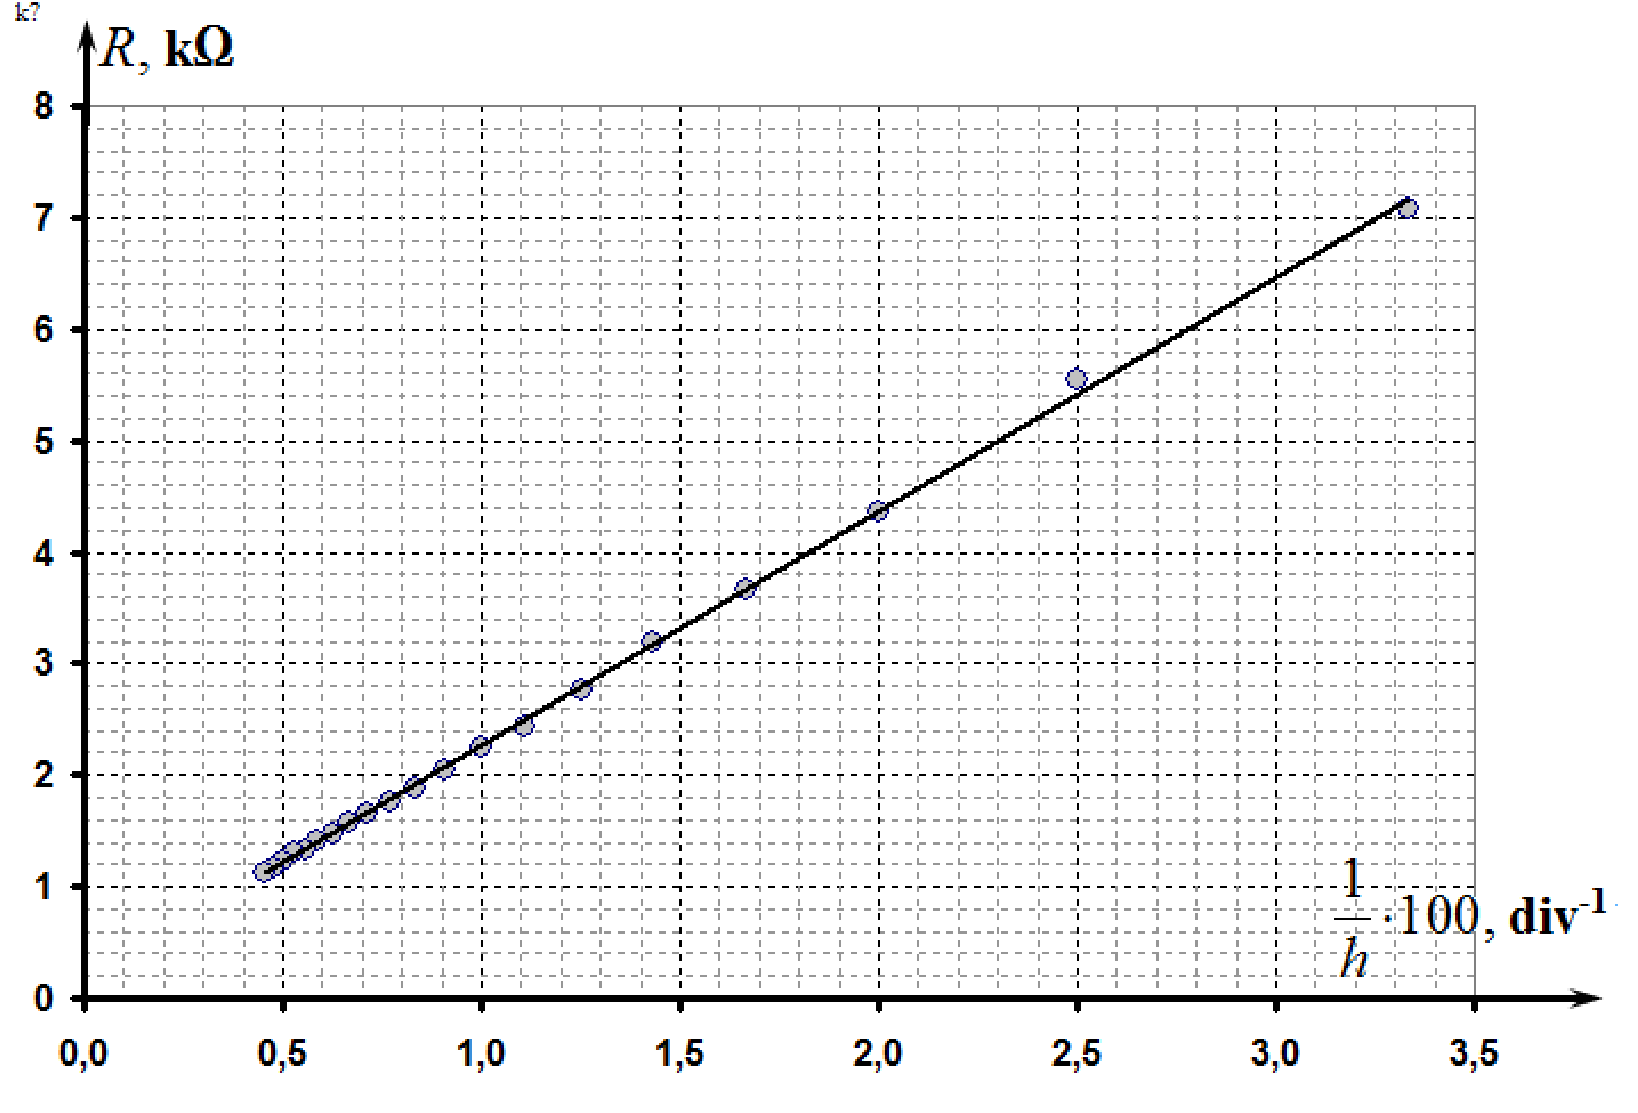
The parameters of this linear dependence, calculated by the mean square method
To determine the parameters in relation (3) it is necessary to recalculate (5) from divisions of the scale to millimeters. Thus, we get
Note. Although it is possible to use the linearization of the type , but this leads to worse results, since it ignores the additional resistance of the circuit.
PART 3
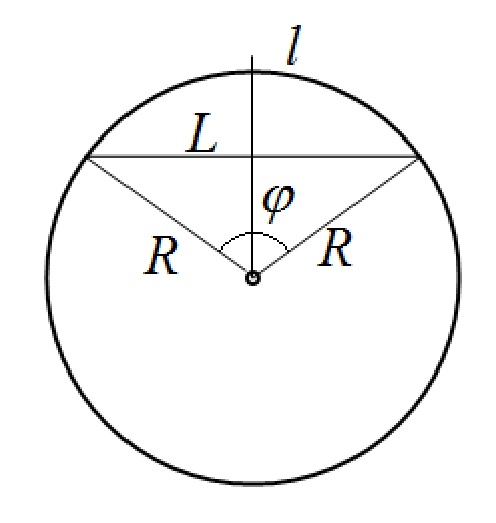
3.1 In order to measure the distance between the spokes it is easier to measure the length of the arc between the spokes using the marks made on a strip of the adhesive tape. Then the distance between the spokes can be calculated using the geometric formula
where is the diameter of the measuring glass.
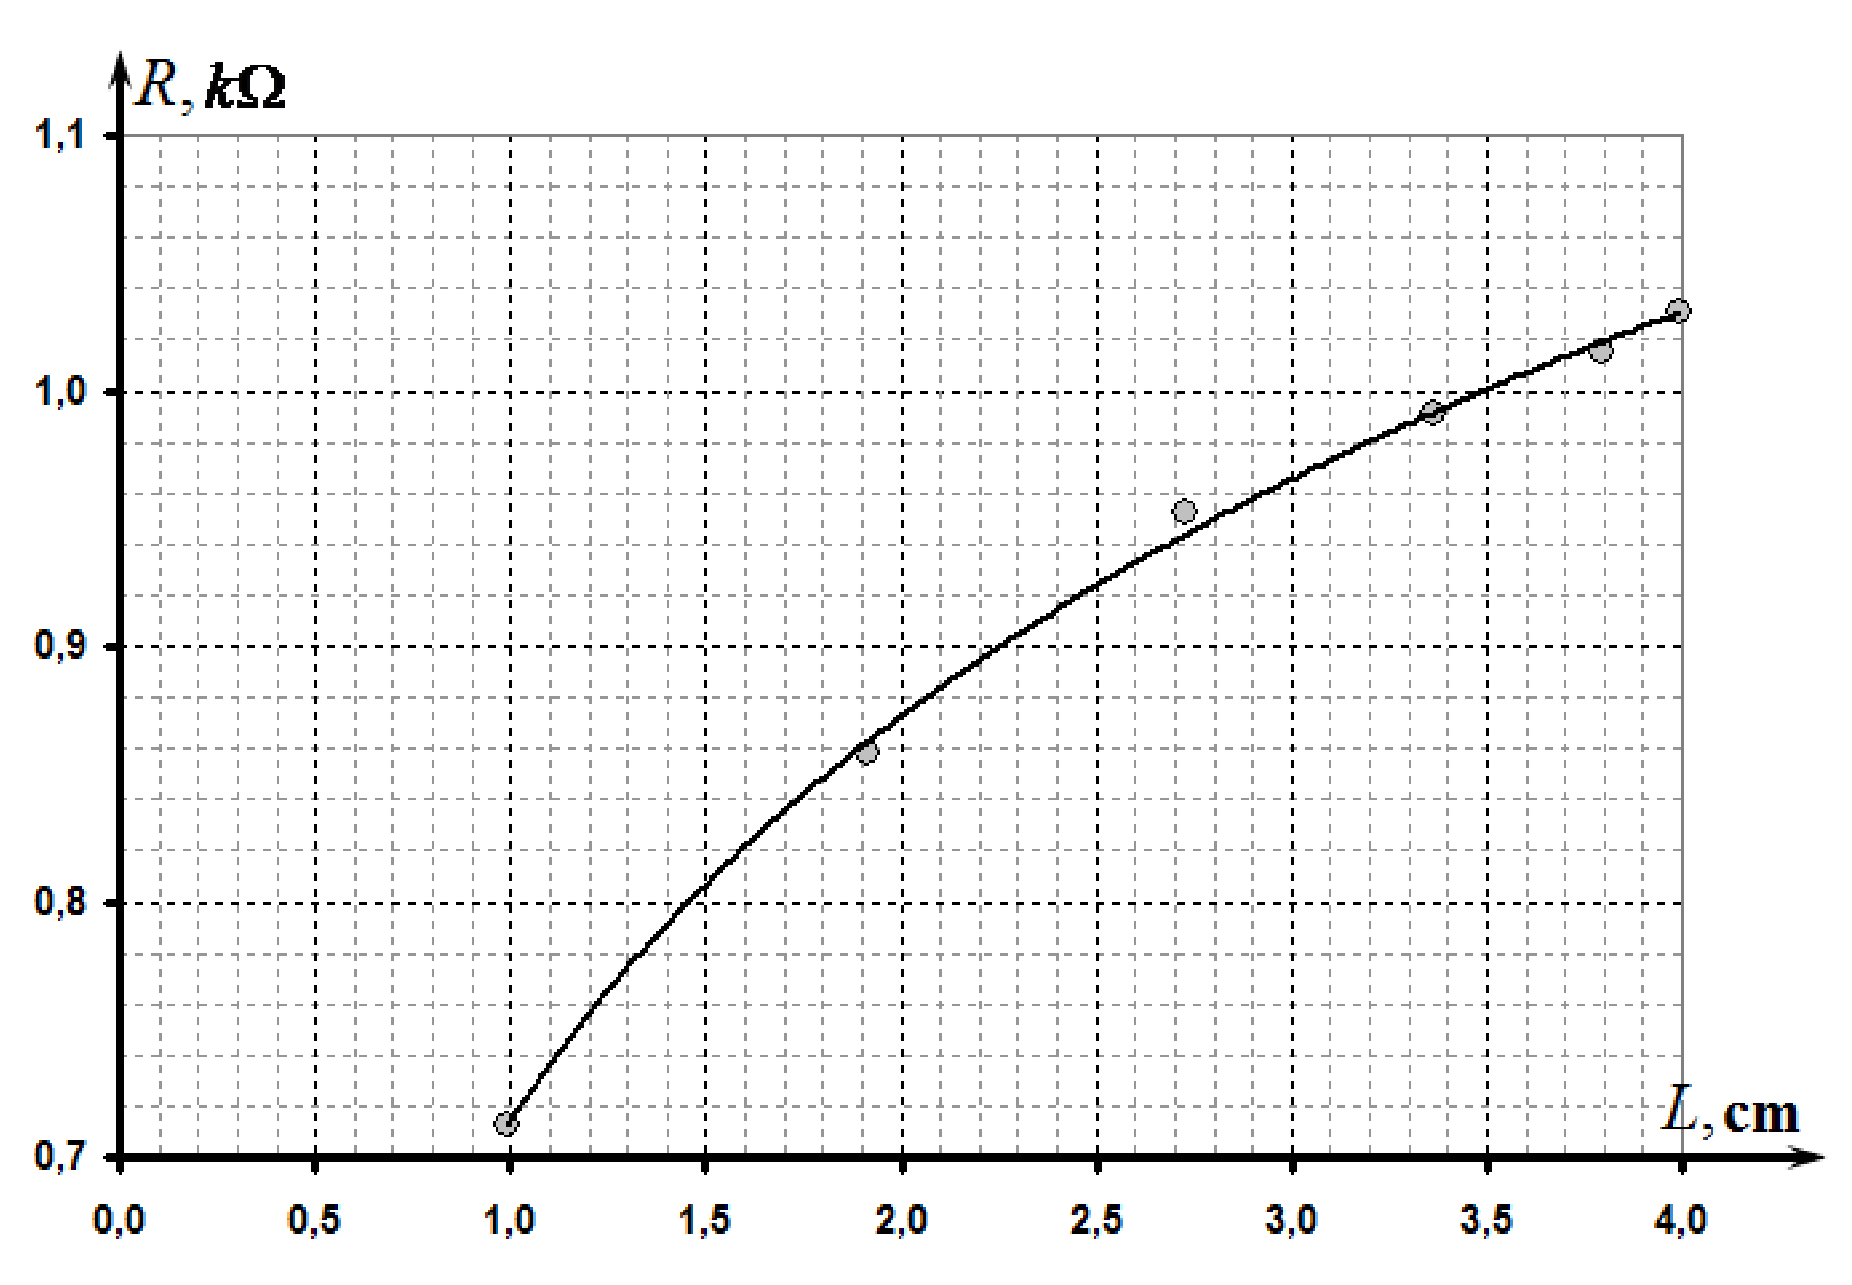
The measurement results of the water resistance on the distance between the spokes are shown in Table 2.
Table 2.
| , cm | , cm | , V | , V | , kΩ | |
|---|---|---|---|---|---|
| 1 | 0,990 | 1,29 | 3,62 | 0,713 | -0,010 |
| 2 | 1,918 | 1,45 | 3,38 | 0,858 | 0,651 |
| 3 | 2,727 | 1,59 | 3,34 | 0,952 | 1,003 |
| 4 | 3,366 | 1,62 | 3,27 | 0,991 | 1,214 |
| 5 | 3,796 | 1,64 | 3,23 | 1,015 | 1,334 |
| 6 | 3,990 | 1,65 | 3,2 | 1,031 | 1,384 |
The graph of the obtained dependence is presented in the figure below.
3.2 It is theoretically possible to show that the resistance of the medium between two long parallel electrodes in an infinite medium is given by
where is the length of the electrodes (spokes), is their radius.
We can assume that in this case the water resistance between the electrodes depends linearly on the logarithm of the distance between them, that is,
3.3 To check the feasibility of (9) it is necessary to plot the dependence of the resistance on the logarithm of the distance . That is the linear dependence should be observed for the following values:
This graph is shown in the figure below which confirms assumption (9).
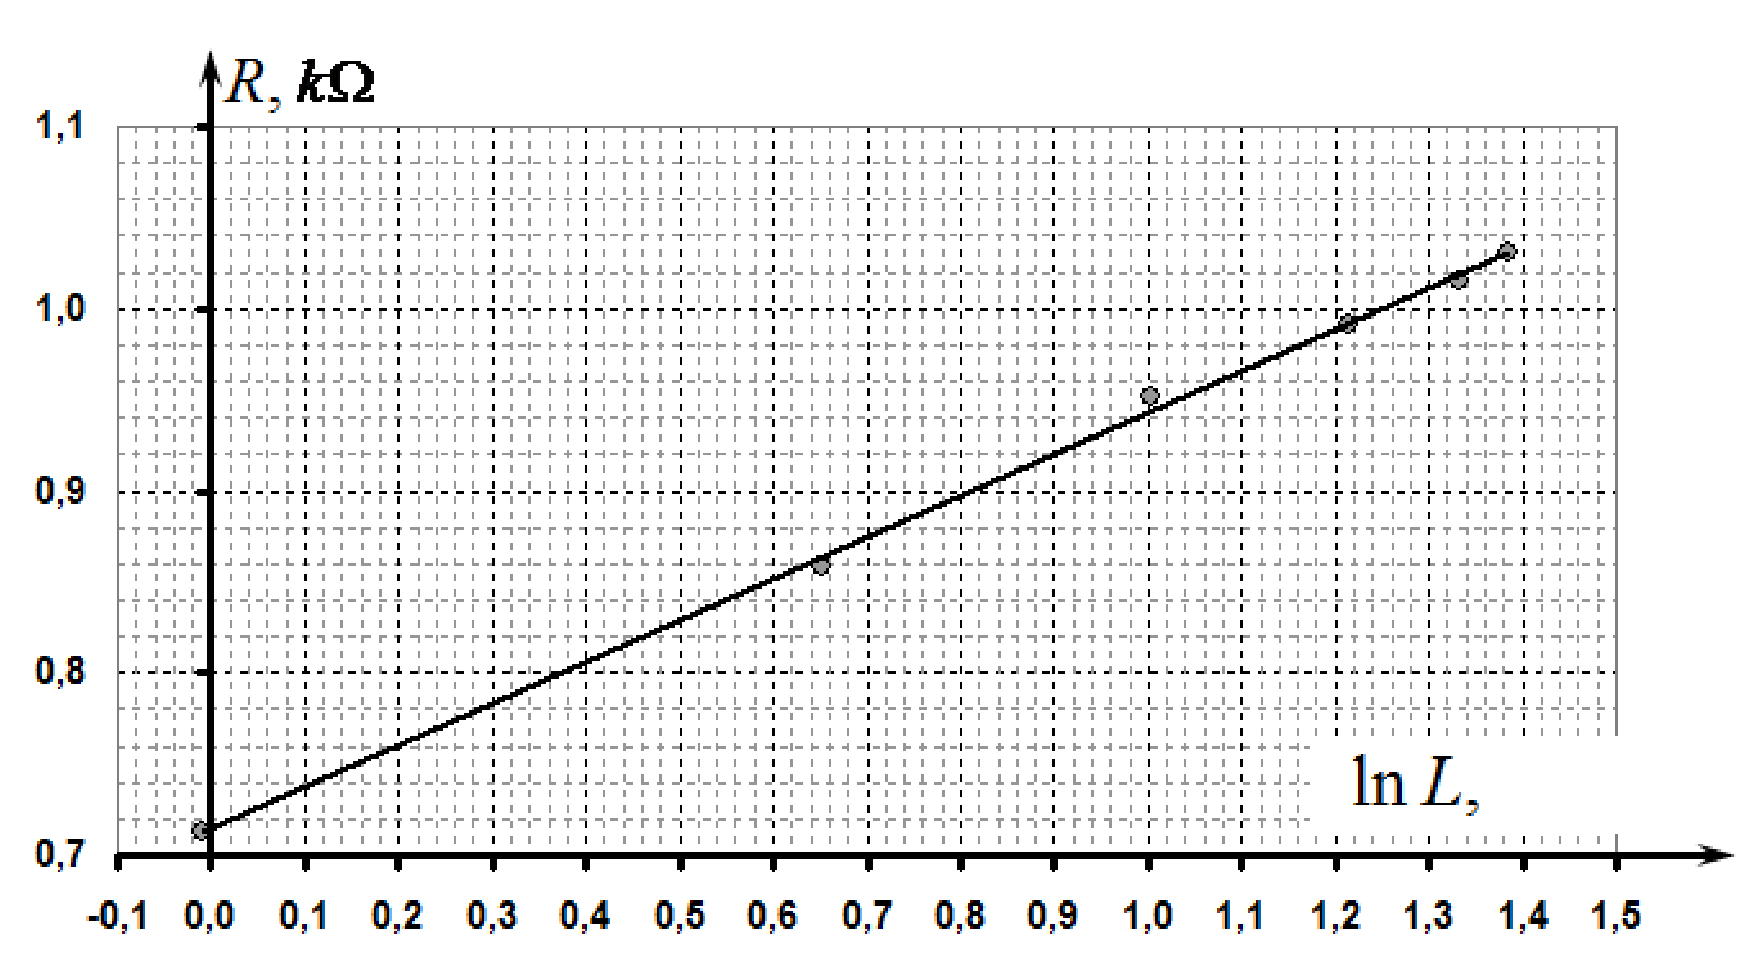
The parameters of this linear dependence, calculated by the least square method, are found as follows
It is obvious that the value of the parameter depends on the unit of distance . In this case, values in (11) correspond to the parameters in (9).
PART 4
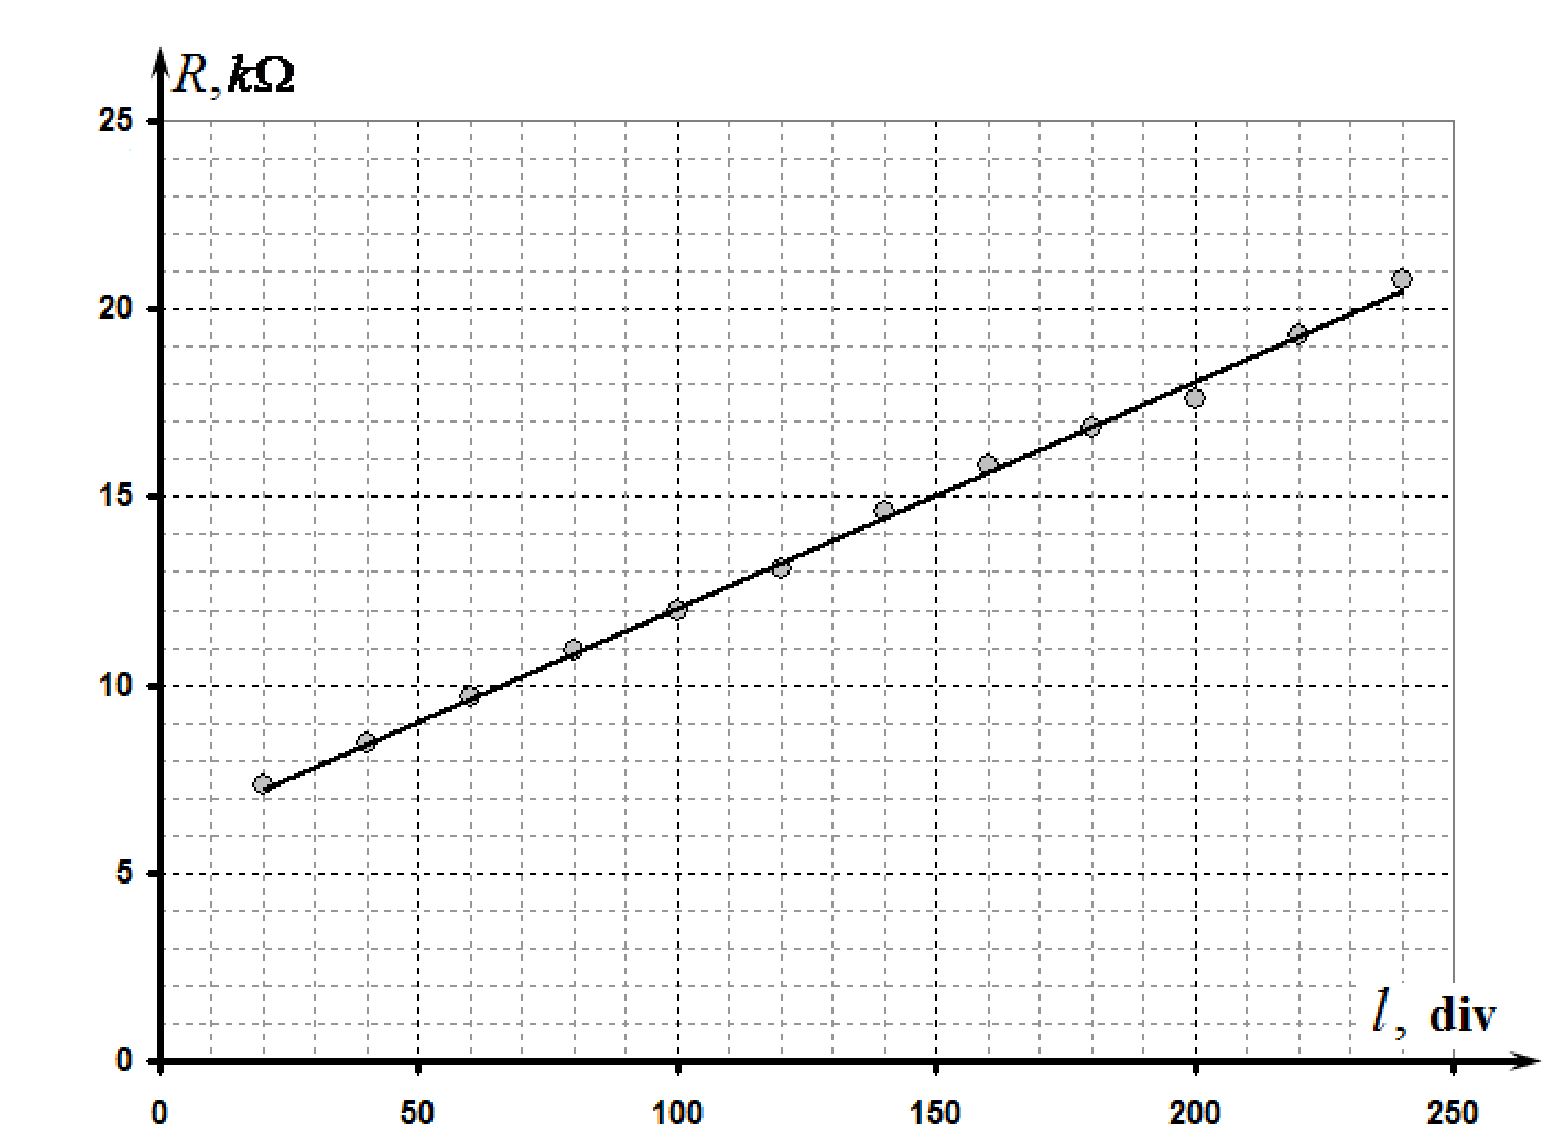
4.1 The results of the resistance measurements depending on the height of the second spoke in water are shown in Table 3. In this case, to measure the height one has to make use of the scale of the measuring glass, so as the units are milliliters.
Table 3
| ,ml | , V | , V | R, kΩ |
|---|---|---|---|
| 20 | 3,85 | 1,05 | 7,3 |
| 40 | 3,96 | 0,94 | 8,4 |
| 60 | 4,06 | 0,84 | 9,7 |
| 80 | 4,14 | 0,76 | 10,9 |
| 100 | 4,20 | 0,70 | 12,0 |
| 120 | 4,25 | 0,65 | 13,1 |
| 140 | 4,31 | 0,59 | 14,6 |
| 160 | 4,35 | 0,55 | 15,8 |
| 180 | 4,38 | 0,52 | 16,8 |
| 200 | 4,40 | 0,50 | 17,6 |
| 220 | 4,44 | 0,46 | 19,3 |
| 240 | 4,47 | 0,43 | 20,8 |
The graph of this dependence is shown in the figure below.
4.2 Approximate distribution of currents in this case is shown in the figure on the right.
4.3 In this case the distance between the spokes plays the role of the effective length of a conductor, so the water resistance between the spokes in this case is approximately linearly dependent on l, which is confirmed by the experimental data. Additional resistance may be due to a limitation of currents near the tips of the spokes.
Thus, this dependence is described by
4.4 According to the obtained experimental data, the linear dependence holds at all distances l. Deviations from linearity are possible at small and large values of l. However, in the range of values the dependence is definitely linear.
The parameters in (12), calculated by the least square method, are found as
If the height h is measured in millimeters, then the value of the coefficient a is
Part 5
5.1 In order to estimate the specific water resistivity it is preferable to use data from Part 4.The linearity of the dependence obtained indicates that in the middle the stream lines are approximately parallel to the vessel walls. It is also possible to assume that in this region the current flows through the entire cross section of the vessel. Consequently, we can use the formula for the resistance presented in this problem.
The obtained value of the slope (14) is the resistance of one millimeter of the water column, which makes it possible to evaluate its specific electrical resistivity
On substituting numerical values we get
Grading scheme for Experimental Competition
If the resistance measurements were carried out in an ohmmeter mode of the multimeter, all the points for the measurement results are reduced by two times!
In the table below italics indicates grading for alternative solutions.
| N | Content | Total | Points |
|---|---|---|---|
| 1.1 | Resistance | 0,2 | 0,2 |
| 1.2 | Formula (1) | 0,3 | 0,3 |
| 2.1 | Measurements of the experimental data and plotting the graph (reasonable values have been obtained for the resistance in the range from 1 to 10 kΩ. Otherwise no points are given) | 2,5 | |
| Measurements made in the range that include more than 180 divisions of the scale (max-min); | 0,75 | ||
| in the range that includes more than 150 divisions; | (0,5) | ||
| in the range that includes more than 100 divisions; | (0,25) | ||
| less than 100 divisions; | (0) | ||
| Number of experimental points: 10 and more; | 0,75 | ||
| 7-9; | (0,5) | ||
| 5-6; | (0,25) | ||
| less than 5 | (0) | ||
| Resistance values are correctly calculated for each measured point | 0,25 | ||
| Monotonically decreasing dependence is obtained; the resistance changes at least 5 times; | 0,25 | ||
| resistance varies less than 5 times; | (0) | ||
| Plot is made | |||
| - size of plot is not less than 1/4 of sheet; | 0,1 | ||
| - axes are denoted by units, digits are indicated; | 0,1 | ||
| - all table data points are correctly drawn in a plot; | 0,2 | ||
| - smooth line passing through the points is shown; | 0,1 | ||
| 2.2 | Streamlines are shown in the figures | 0,5 | |
| In the plane of the spokes: straight lines are perpendicular to the spokes (slight distortion might appear near the bottom and the top of the vessel); | 0,25 | ||
| In the perpendicular plane: convex symmetric lines between the electrodes filling most of the cross-section; | 0,25 | ||
| 2.3 | Form of dependence | 0,8 | |
| - Inverse proportionality; (otherwise no points are given) | 0,6 | ||
| - There is a constant component for the resistance; | 0,2 | ||
| 2.4 | Linearization and determination of parameters | 1,2 | |
| Type of relationship: | |||
| - Dependence ; | 0,2 | ||
| - Dependence , or in a double logarithmic scale; | (0,1) | ||
| - Other; | (0) | ||
| Plotting the graph of the linearized dependence | |||
| - All points are plotted; | 0,2 | ||
| - Smoothing line through the points is shown | 0,2 | ||
| - Correct evaluation of the parameters of the linearized dependence kΩ·div step, or kΩ·mm - if the deviation is of 30% to 75% - the grade is twice less; - if there is a large deviation, no points are given) | |||
| - By using Least Square Method; | 0,4 | ||
| - By using plot (or by using all points); | (0,2) | ||
| - By using two points; | (0,1) | ||
| Calculation of the height measured in units of length (mm or cm) | |||
| - Measuring and calculation of the division value of the scale (correct) | 0,1 | ||
| - Calculation of the slope | 0,1 | ||
| (if all the previous calculations in units of length) | (0,1) | ||
| 3.1 | Measurements and plotting of the experimental data (reasonable values for the resistances in the range of 0.5 to 2 kΩ, otherwise no points are given) | 1,5 | |
| Measurement of the distance between the spokes: | |||
| - An arc of a circle with calculations; | 0,2 | ||
| - Direct measurement by a ruler; | (0,1) | ||
| - Measured in the range of 1 to 4 cm - (Otherwise no points are given); | 0,3 | ||
| - Number of points − 6 or more; | 0,3 | ||
| - Number of points − 4 - 5; | (0,2) | ||
| - Less than 4 | |||
| An increasing convex relationship is obtained | 0,2 | ||
| Plot is made | |||
| - size of a plot is not less than 1/4 of sheet; | 0,1 | ||
| - units of axes are stated, digits are indicated; | 0,1 | ||
| - all table data points are correctly drawn in a plot; | 0,2 | ||
| - smooth line passing through the points is shown; | 0,1 | ||
| 3.2 | Form of dependence | 1 | |
| Logarithmic dependence | 0,7 | ||
| There is constant contribution in the dependence; | 0,3 | ||
| Some other reasonable convex increasing dependence | (0,3) | ||
| 3.3 | Linearization and determination of parameters | 1 | |
| - Dependence ; | 0,4 | ||
| - Other reasonable linearization in accordance with the formula 3.2 | (0,2) | ||
| Plotting the graph of the linearized dependence | |||
| - All points are plotted; | 0,1 | ||
| - Smoothing line is shown; | 0,1 | ||
| Parameters: (slope is in the range kΩ; - if the deviation of 30% to 75% the grading points are twice less; - if there is a large deviation, no points are given) | |||
| - By using Least Square Method; | 0,4 | ||
| - By using plot (or by using all points); | (0,2) | ||
| - By using two points; | (0,1) | ||
| 4.1 | Measurements of the experimental data and plotting the graph (reasonable values have been obtained for the resistance in the range of 5 to 30 kΩ. Otherwise no points are given) | 2,4 | |
| Measurements are made in the range of more than 180 divisions of the scale (max-min); | 0,75 | ||
| in the range of more than 150 divisions; | (0,5) | ||
| in the range of more than 100 divisions; | (0,25) | ||
| less than 100 divisions; | (0) | ||
| Number of experimental points: 10 and more; | 0,75 | ||
| 7-9; | (0,5) | ||
| 5-6; | (0,25) | ||
| less than 5 | (0) | ||
| Resistance values are correctly calculated for each measured point | 0,2 | ||
| Monotonically increasing dependence is obtained; there is linear part in the plot | 0,3 | ||
| No linear part in the plot | (0,1) | ||
| Plot is made | |||
| - units of axes are stated, digits are indicated; | 0,1 | ||
| - all table data points are correctly drawn in a plot; | 0,2 | ||
| - smooth line passing through the points is shown; | 0,1 | ||
| 4.2 | Sketch of streamlines | 0,3 | |
| Lines - start from the open end of the spoke; | 0,1 | ||
| - go straight up; | 0,1 | ||
| - are distributed along the length of second spoke; | 0,1 | ||
| 4.3 | Form of the dependence | 0,4 | |
| - there is term proportional to l; | 0,2 | ||
| - there is a constant component; | 0,2 | ||
| (other than linear types of dependence are not accepted); | |||
| 4.4 | Linearity interval | 0,1 | |
| - interval is shown (deviations near the ends of interval measurement are allowed) | 0,1 | ||
| 4.5 | Parameters | 0.8 | |
| - Correct evaluation of the linearized dependence: the slope (() kΩ/div or () ) kΩ/mm -if deviations are from 30% to 75% the grade points are twice less; - if there is a large deviation, no points are given) | |||
| - By using Least Square Method; | 0,6 | ||
| - By using plot (or by using all points); | (0,4) | ||
| - By using two points; | (0,2) | ||
| - Constant component of the resistance: | |||
| - In the range 4 - 10 kΩ | 0,2 | ||
| - In the range of 2 - 4 kΩ or 10-12 kΩ; | (0,1) | ||
| - Otherwise no grade points; | |||
| 5.1 | The calculation of the specific resistivity of water | 2 | |
| - Dependence from Part 4 is taken; | 0,3 | ||
| - Other reasonable dependence (with a correct formula for the resistance); | (0,1) | ||
| Equation (7) is used to calculate the resistance by using: | |||
| - The slope of the graph; | 0,4 | ||
| - (using 1 - 2 points for calculation); | (0,2) | ||
| The calculation of the specific resistance (80 Ω·m): | |||
| - Values in the range 60-100 Ω·; | 1,3 | ||
| - Values in the range 40-120 Ω·; | (1,0) | ||
| - Values in the range 20 - 150 Ω·; | (0,5) | ||
| - Otherwise zero grade points. |
Оригинал в Архива: IZhO 2012 Exp_eng_final.doc · официални решения: IZhO 2012 Exp_eng_sol_f.doc