IZhO 2024, Експеримент — Задача 1. Superposition of oscillations
XX International Zhautykov Olimpiad/Experimental Competition · 10 януари 2024 г. · 20 т.
Please read the instructions first:
EXPERIMENTAL COMPETITION
January 10, 2024
The Experimental competition consists of one problem. This part of the competition lasts 3 hours.
Please only use the pen that is provided to you.
You can use your own non-programmable calculator for numerical calculations. If you don’t have one, please ask for it from Olympiad organizers.
You are provided with Writing sheet and additional papers. You can use the additional paper for drafts of your solutions but these papers will not be checked. Your final solutions which will be evaluated should be on the Writing sheets. Please use as little text as possible. You should mostly use equations, numbers, figures and plots.
Use only the front side of Writing sheets. Write only inside the bordered area.
Fill the boxes at the top of each sheet of paper with your country (Country), your student code (Student Code), the question number (Question Number), the progressive number of each sheet (Page Number), and the total number of Writing sheets (Total Number of Pages). If you use some blank Writing sheets for notes that you do not wish to be evaluated, put a large X across the entire sheet and do not include it in your numbering.
At the end of the exam, arrange all sheets for each problem in the following order:
- Used Writing sheets in order.
- The sheets you do not wish to be evaluated.
- Unused sheets.
- The printed problems.
Place the papers inside the envelope and leave everything on your desk. You are not allowed to take any paper or equipment out of the room.
Условие
Devices and equipment: tripod, complex pendulum, ruler of 30 cm, electronic stopwatch.
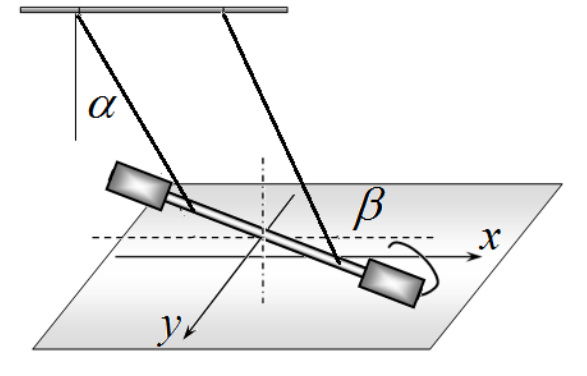
The oscillatory system is a torsion pendulum, which consists of a metal screw-threaded rod 1, suspended on two threads 2 and 3 of equal length, the threads are tied to a horizontal rod 4, fixed in the tripod leg. On the movable rod 1 there are two elongated screw nuts 5 and 6, which can be freely moved along the rod.
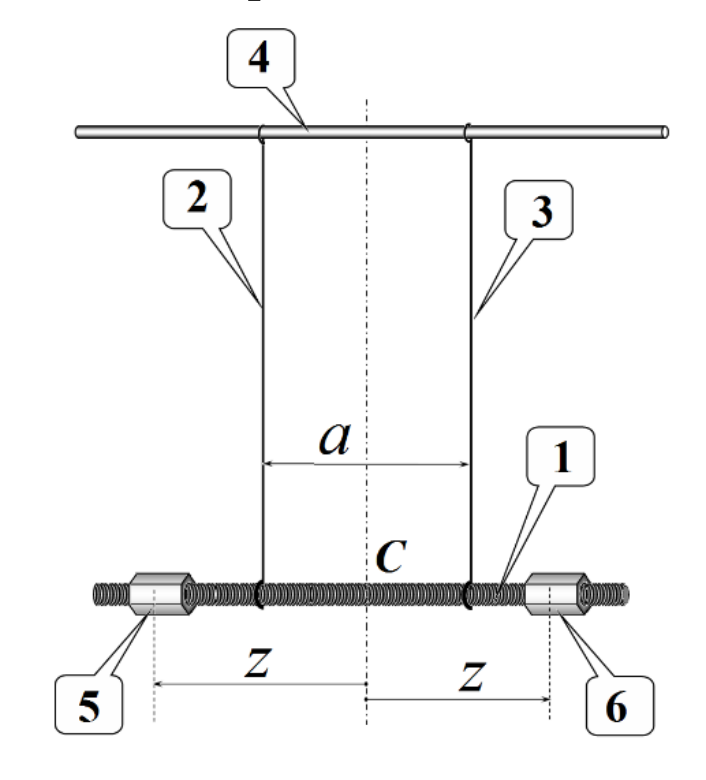
In all experiments, the lengths of the threads must remain unchanged, and they themselves must be strictly vertical in a state of equilibrium and located symmetrically relative to the center of the rod . We denote the distance between the threads as .
The screw nuts should also be positioned symmetrically relative to the center of the rod. The position of the nuts is determined by the distance from the rod center to the middle of the nut. For precise positioning of the nuts, it is recommended to use a rod thread with a pitch of 1.0 mm. For convenience, one of the faces of the nut is sealed with a strip of paper on which its middle is clearly marked, so that when the nut is turned one turn, it moves along the rod by a distance of 1.0 mm.
In this experiment you need to study two types of the rod oscillations:
- longitudinal oscillations (1 in the figure below), in which the rod and threads always move in the same vertical plane;
- torsional oscillations (2 in the figure below), in which the rod rotates around a fixed vertical axis passing through the rod center.
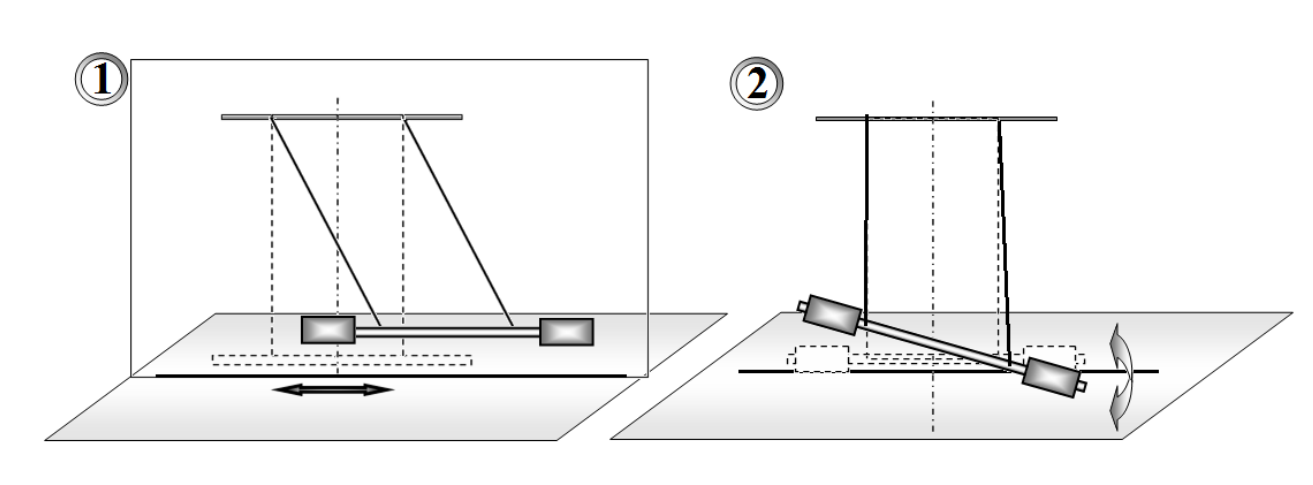
If the rod is deflected in a vertical plane and released, it then performs longitudinal oscillations. If the rod is rotated at a certain angle around the vertical axis and released, it then performs torsional oscillations.
In addition, this experiment is aimed at studying the superposition of longitudinal and torsional oscillations, which can be excited by displacing the rod along its axis and rotating it at a certain angle relative to the vertical axis. We call such oscillations mixed.
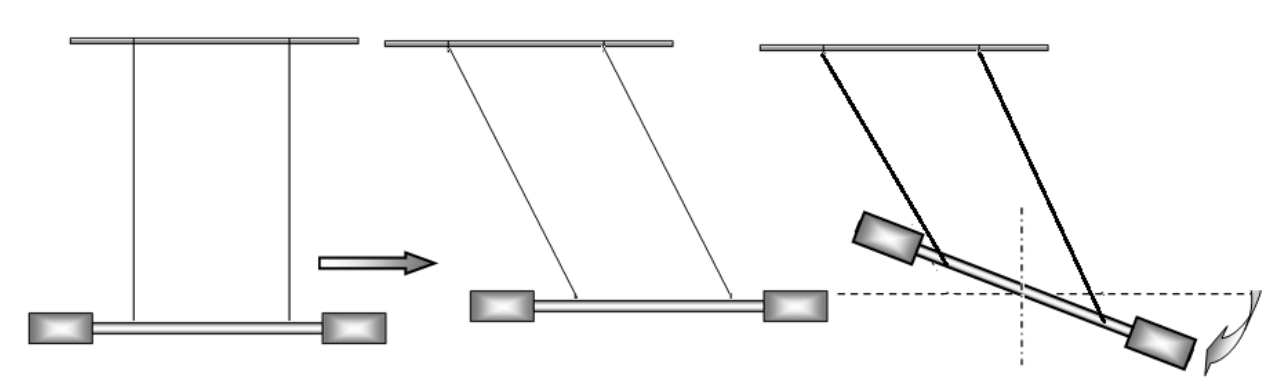
For convenience, secure the pendulum in a tripod so that the rod moves in close proximity to the table surface. Place a sheet of paper on the table, on which you have to draw a straight line corresponding to the rod equilibrium position. During longitudinal oscillations, the rod must move along this straight line; during torsional oscillations, the center of the rod must be located on the same vertical.
During the experiments, the angles of deviation of the threads from the vertical during longitudinal oscillations and the angles of rod rotation during torsional oscillations should lie in the range of 20°-30°.
Successful completion of this experiment requires high precision measurements, so be extremely careful and accurate! Release the rod without any additional push!
Part 1. Observation of the effect and its theoretical description
Place the threads at a distance of cm, their lengths should approximately be cm, and the screw nuts should be placed at the ends of the movable rod. Excite mixed oscillations of the rod and carefully observe the movement of one of its ends. Since, with the selected system parameters, the frequencies of longitudinal and torsional oscillations are close, the shape of the trajectory of the rod end changes slowly and regularly, periodically returning to the initial one. Let us call the process of sequential restoration of the original shape of the trajectory a cycle, the corresponding time as the cycle time , and the number of complete longitudinal oscillations corresponding to it as .
1.1 Draw several successive characteristic shapes of the rod end trajectories in one cycle. [1 т.]
We introduce a coordinate system on the horizontal plane: the axis is directed along the rod in the position of its equilibrium, the axis is perpendicular to it, and the origin is placed under the center of the rod in the position of its equilibrium.
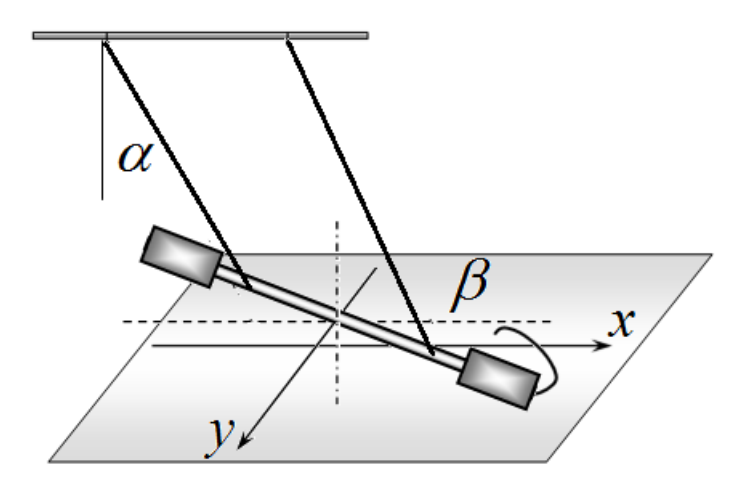
We also denote the angle of deflection of the threads during longitudinal oscillations as , the angle of rod rotation during torsional oscillations as , the period of longitudinal oscillations as , the period of torsional oscillations as , the length of the threads as , and the length of the rod as .
1.2 Write down the exact dependences of the coordinates of the rod end and on time , and then obtain the corresponding approximate expressions for the conditions of this experiment. [0,8 т.]
1.3 Within the framework of the proposed model, obtain a formula for the cycle period , expressing it through the periods of longitudinal and torsional oscillations. [1,3 т.]
1.4 Write down the formula for the number of longitudinal oscillations in the cycle , expressing it in terms of periods and . [0,4 т.]
Part 2. Longitudinal oscillations
2.1 Measure the period of longitudinal oscillations with the possible minimal error. Calculate the instrumental, random and total errors of the measured value of the period . [2 т.]
Part 3. Torsional oscillations
The period of torsional oscillations can be described by the formula:
where signifies the distance from the rod center to the centers of the nuts, and stands for a function that depends on only.
3.1 Measure the dependence of the period of torsional oscillations on the distance between the threads , plot a graph of the resulting dependence. Take measurements when the nuts are at the rod ends with cm. [2,5 т.]
3.2 Based on experimental data, prove the validity of formula (1) and determine the exponent . An error estimate is not required here. [1,5 т.]
It can be shown that the function in formula (1) has the following form
where refer to some constant values independent of the parameters and .
3.3 Fix the suspension threads at a distance of cm. Measure the period of torsional oscillations as a function of the position of the nuts . Plot a graph of the resulting relationship. It is unnecessary to take measurements when the nuts are closer to the center of the rod than the threads. [2,5 т.]
3.4 Prove the applicability of formula (2) to describe your experimental data. [1 т.]
3.5 Calculate the values of the coefficients and estimate their errors. Please note that values must be measured in centimeters. [1 т.]
Part 4. Mixed oscillations
Place the threads at a distance of cm. Investigate the mixed oscillations described in Part 1 for different positions of the nuts with cm.
4.1 Measure the dependence of the number of longitudinal oscillations in the cycle on the position of the nuts . You may not be able to do this for all values! [4 т.]
4.2 Based on the results of parts 2 and 3, calculate the periods of torsional oscillations for all values of at which the measurements have carried out in section 4.1. [0,5 т.]
4.3 Present the measurement results in such a graphical form that they confirm the validity of the formula for the value obtained in part 1. [1,5 т.]
Отговори
1.3
1.4
2.1 1.321 s
Sample result of the official solution: s; the marking scheme accepts a period in the range of 1.3 – 1.5 s.
3.2 -1
3.5 A = (254 ± 4) cm², B = 0.93 ± 0.03
Sample values of the official solution, obtained by the least squares method.
Решение
SOLUTION TO THE EXPERIMENTAL COMPETITION
Superposition of oscillations
The longitudinal and torsional oscillations of the pendulum described in the experiment in the approximation of small angles are its own oscillations (modes), so they can be considered independently of each other.
In the small angle approximation, the periods of these oscillations are given by the formulas
where is the total mass of the pendulum, refers to the rod mass, stands for the nut mass, and designates the moment of inertia of the rod with the nuts.
Formulas (1) and (2) are actually used in the work, but their derivation is not required and is not graded.
Part 1. Observation of the effect and its theoretical description
1.1 The rod end moves along trajectories corresponding to the addition of perpendicular oscillations with close frequencies. They can also be thought of as the addition of oscillations with equal frequencies, but with a slowly varying phase difference between them. Images of these most typical trajectories are shown in the figure below.

1.2 It follows from geometry that the horizontal coordinates of the rod end are described by the formulas:
In the approximation of small angles we have
Since the angles change according to a harmonic law with frequencies and , respectively, the equation for the trajectory of the rod end has the form
which for close frequencies can be conveniently rewritten in the form
In the expression for close frequencies, the value can be considered as a slowly varying phase difference between oscillations with close frequencies.
1.3 It is obvious that the shape of the trajectory returns to the initial one if the phase difference changes by . Thus, the cycle period obeys the condition
which provides
1.4 The number of oscillations of longitudinal oscillation in the cycle can be written in the form
Part 2. Longitudinal oscillations
2.1 To increase the measurement accuracy, it is necessary to measure the times of a sufficiently large number of oscillations; in our experiments, we measure the time of 20 periods of oscillations . To estimate the random error, these measurements are carried out 10 times, and their results are shown in Table 1.
Table 1. Measuring the period of longitudinal oscillations.
| , s | |
|---|---|
| 1 | 26,39 |
| 2 | 26,32 |
| 3 | 26,51 |
| 4 | 26,40 |
| 5 | 26,46 |
| 6 | 26,41 |
| 7 | 26,34 |
| 8 | 26,22 |
| 9 | 26,55 |
| 10 | 26,53 |
The average time of 20 oscillations is
s,
and the instrument error is equal to half the value of the stopwatch division
s.
The random error is calculated using the formula
The total time measurement error is
s.
Thus, the period of longitudinal oscillations is equal to
Part 3. Torsional oscillations
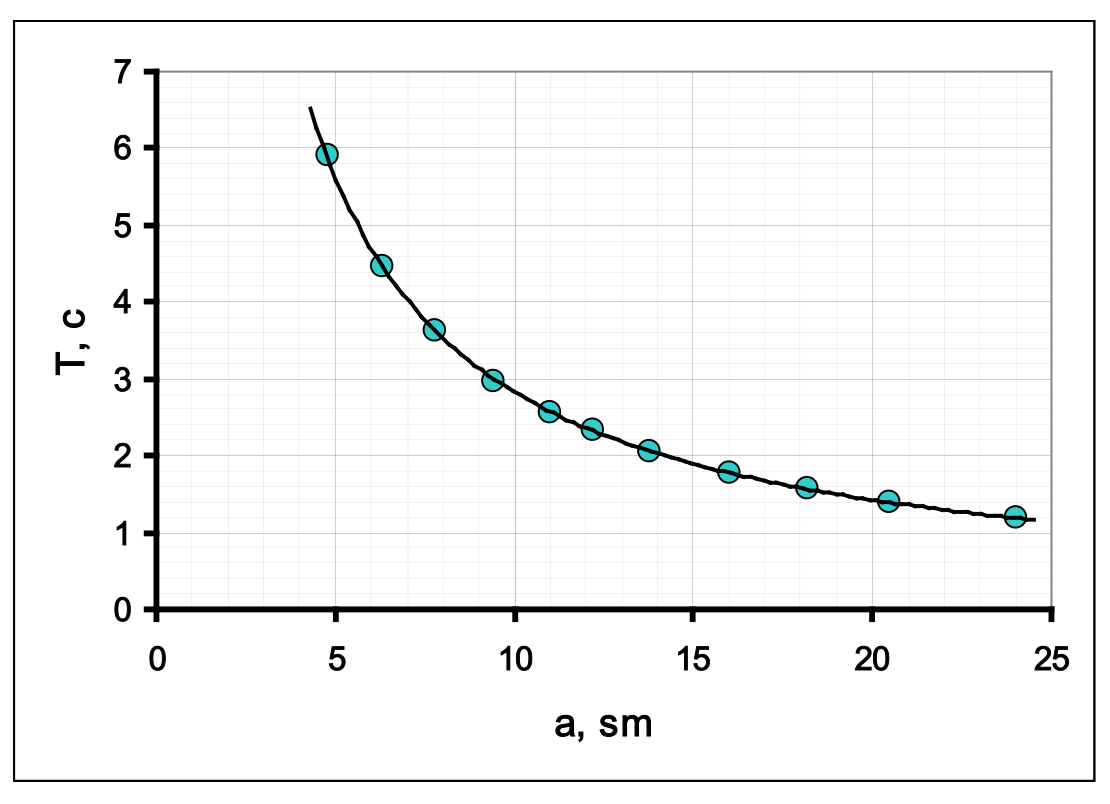
3.1 Table 2 shows the values of the measurement results of the periods of torsional oscillations at various values of the distance between the threads. The same table shows the results of calculations for determining the exponent .
Table 2. Dependence of the period of torsional oscillations as a function of the distance between the threads.
| , cm | ,s | , s | ||
|---|---|---|---|---|
| 4,8 | 59,11 | 5,911 | 1,5686 | 1,7768 |
| 6,3 | 44,62 | 4,462 | 1,8405 | 1,4956 |
| 7,8 | 36,31 | 3,631 | 2,0541 | 1,2895 |
| 9,4 | 29,66 | 2,966 | 2,2407 | 1,0872 |
| 11,0 | 25,60 | 2,560 | 2,3979 | 0,9400 |
| 12,2 | 23,32 | 2,332 | 2,5014 | 0,8467 |
| 13,8 | 20,46 | 2,046 | 2,6247 | 0,7159 |
| 16,0 | 17,66 | 1,766 | 2,7726 | 0,5687 |
| 18,2 | 15,82 | 1,582 | 2,9014 | 0,4587 |
| 20,5 | 13,87 | 1,387 | 3,0204 | 0,3271 |
| 24,0 | 11,98 | 1,198 | 3,1781 | 0,1807 |
The corresponding dependence graph looks like
3.2 The optimal and most common way to determine the exponent is to plot a graph on a double logarithmic scale. It follows from formula (1) given in the problem statement that
therefore, the slope of the graph is equal to the exponent. This graph is shown in the figure below.
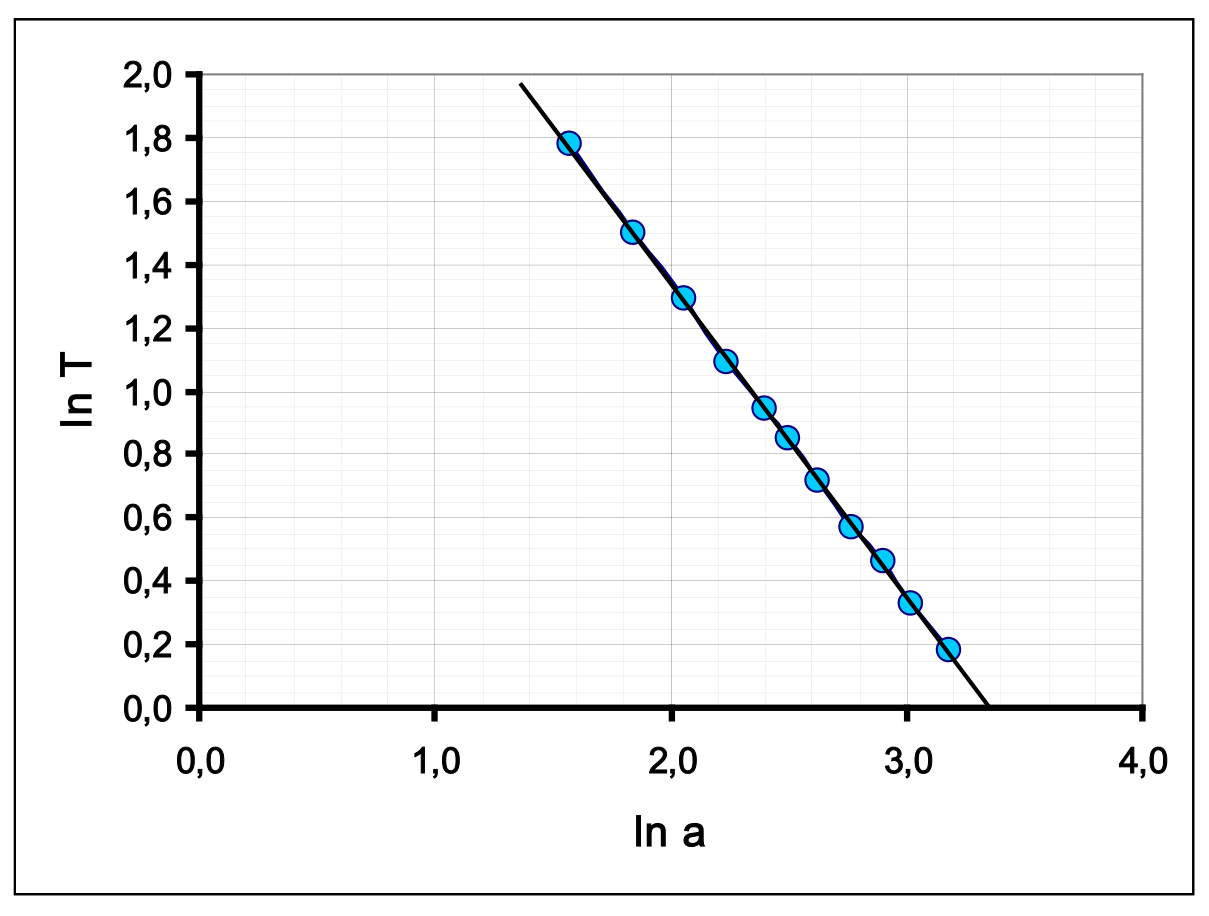
The resulting relationship is linear with a slope coefficient very close to (-1). An alternative way is to construct dependencies , or . However, in these methods it is necessary to prove that the constructed graphs are straight lines passing through the origin of coordinates.
All these methods reasonably indicate that the desired exponent is equal to (-1), i.e. the period of torsional oscillations is inversely proportional to the distance between the threads.
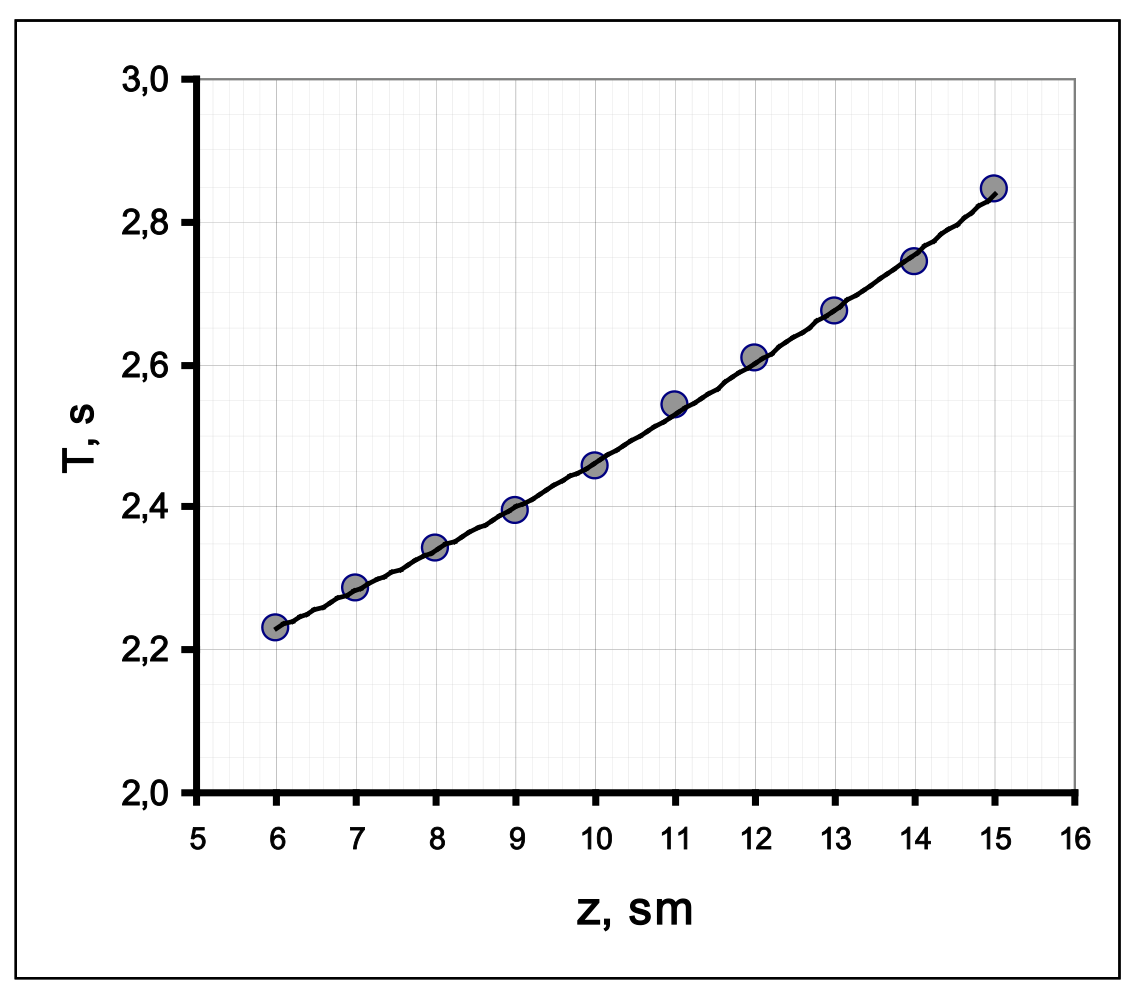
3.3 The results of measurements of the dependence of the period of torsional oscillations on the position of the nuts are given in Table 3. The same table shows the calculation results necessary to construct a linearized graph.
Table 3. Measurements of the period of torsional oscillations.
| , cm | , s | , s | |||
|---|---|---|---|---|---|
| 6 | 44,58 | 2,229 | 36 | 4,968 | 284,9 |
| 7 | 45,75 | 2,288 | 49 | 5,233 | 300,0 |
| 8 | 46,83 | 2,342 | 64 | 5,483 | 314,3 |
| 9 | 47,87 | 2,394 | 81 | 5,729 | 328,5 |
| 10 | 49,17 | 2,459 | 100 | 6,044 | 346,5 |
| 11 | 50,84 | 2,542 | 121 | 6,462 | 370,5 |
| 12 | 52,15 | 2,608 | 144 | 6,799 | 389,8 |
| 13 | 53,47 | 2,674 | 169 | 7,148 | 409,8 |
| 14 | 54,85 | 2,743 | 196 | 7,521 | 431,2 |
| 15 | 56,91 | 2,846 | 225 | 8,097 | 464,2 |
The graph of this relationship is shown in the figure below. It can be seen that the resulting dependence is nonlinear.
3.4 It follows from formulas (1)-(2) given in the problem statement and the result of the previous part that the period of torsional oscillations is described by the formula
whose linearization is obvious and has the form
The value depends linearly on , and the graph of the linearized dependence is shown in the figure below.
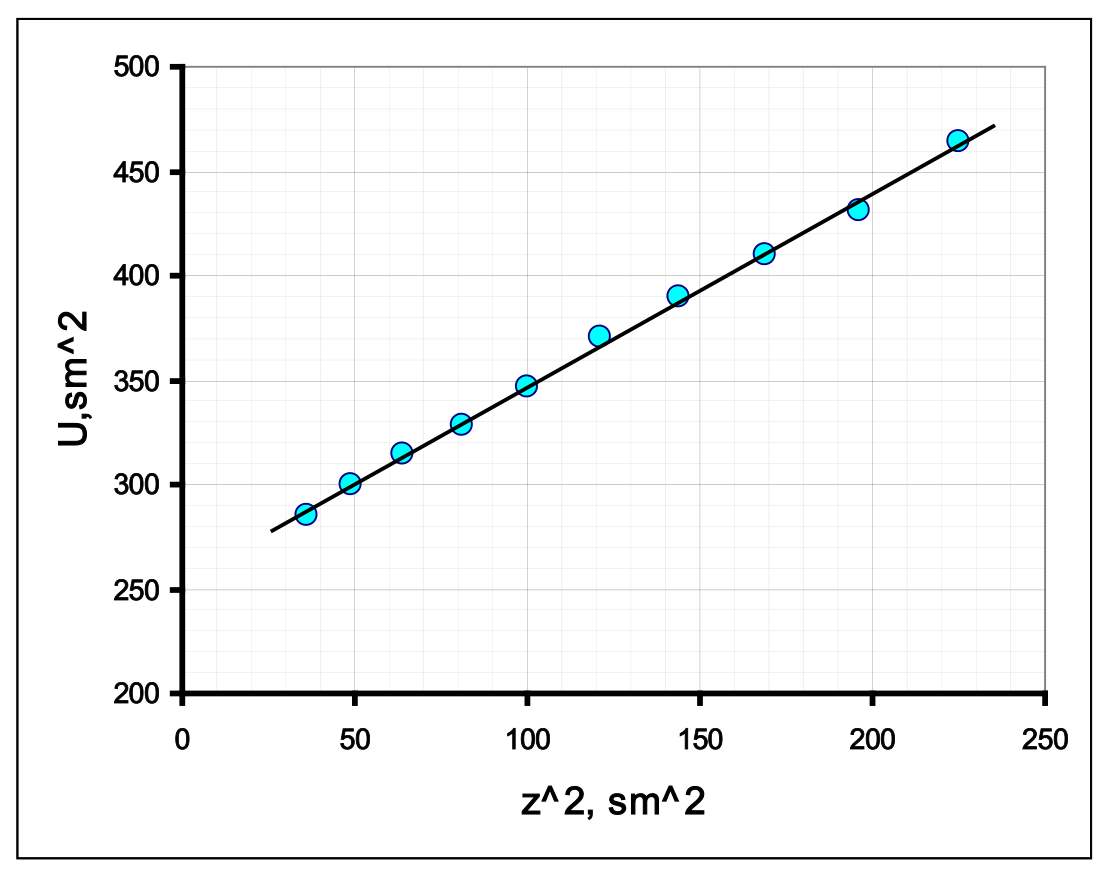
3.5 The coefficients of this dependence, calculated using the least squares method, are equal to
Part 4. Mixed oscillations
4.1, 4.2 Table 4 shows the results of measurements and calculations necessary to verify the theoretical formula (9).
Table 4. Study of mixed oscillations.
| , cm | , s | (теор.) | (эксп) | ||
|---|---|---|---|---|---|
| 10,5 | 1,247 | 1,059 | 17 | ||
| 11,0 | 1,264 | 1,045 | 22 | 24 | 0,042 |
| 11,5 | 1,282 | 1,030 | 33 | 35 | 0,029 |
| 12,0 | 1,301 | 1,015 | 65 | ||
| 12,5 | 1,319 | 1,002 | 660 | ||
| 13,0 | 1,339 | 0,987 | 74 | 60 | 0,017 |
| 13,5 | 1,359 | 0,972 | 36 | 33 | 0,030 |
| 14,0 | 1,379 | 0,958 | 24 | 21 | 0,048 |
| 14,5 | 1,400 | 0,944 | 18 | 16 | 0,063 |
| 15,0 | 1,421 | 0,930 | 14 | 13 | 0,077 |
In this table stands for values of torsional oscillation periods calculated using formula (12), and refers to the calculated and measured values of the number of periods in the cycle.
4.3 To check formula (9), a graph is drawn of the dependence of the quantity reciprocal to the number of oscillations on the value , which is theoretically described by the formula . A graph of this dependence, constructed from the experimental data, is shown in the figure below.
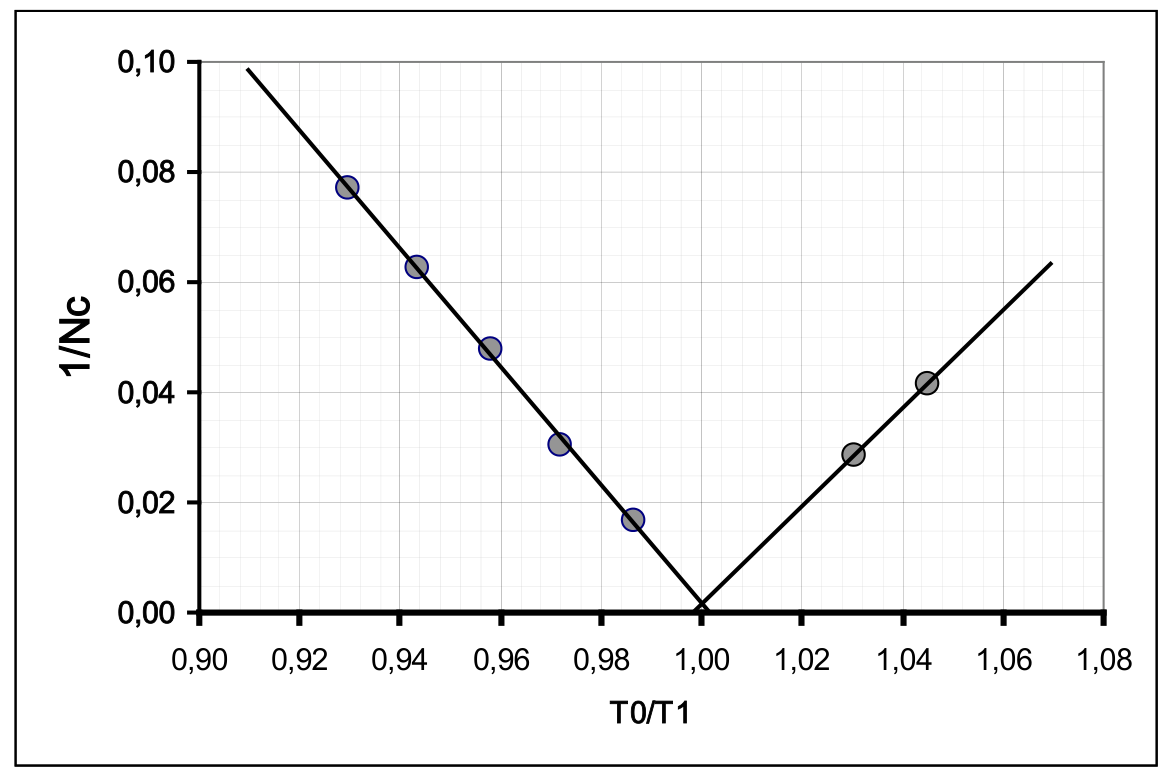
This graph, as well as a comparison of the calculated and measured values, corroborates the theoretical conclusions.
| Content | Points | Total | |
|---|---|---|---|
| Part 1. Observation of the effect and its theoretical description | |||
| 1.1 | The addition of vibrations is obtained (there is at least one plausible picture) | 0,2 | 1,0 |
| 4 drawings: two close to the segment, two ovals indicating the direction of motion | 4x0,2=0,8 | ||
| 1.2 | Expressions for coordinates on a plane through deflection angles | 2x0,2=0,4 | 0,8 |
| Explicit time dependencies | 2x0,1=0,2 | ||
| Small angle approximation | 0,2 | ||
| 1.3 | The main idea is the change in phase difference, formula (7); (if the beat period) | 0,5 (0,2) | 1,3 |
| Formula (8) for the cycle time | 0,5 | ||
| The module is placed in formula (8) | 0,3 | ||
| 1.4 | . | 0,4 | 0,4 |
| Part 2. Longitudinal oscillations | |||
| Graded if the numerical value of the oscillation period is estimated | |||
| 2.1 | The obtained period value is in the range of 1.3 – 1.5 s | 0,4 | 2,0 |
| Measurement error less than 1% (graded if the error is estimated) | 0,1 | ||
| At least 5 measurements of time N oscillations were carried out (3, less) | 0,3 (0,1;0) | ||
| Number of oscillations N not less than 10 (5; less) | 0,2 (0,1;0) | ||
| Averaging over all measurements are carried out | 0,1 | ||
| Random error calculated (averaging of deviation modules, standard deviation - acceptable) | 0,2 | ||
| Instrument error (half or division value) | 0,2 | ||
| The total error is calculated (the value is acceptable) | 0,2 | ||
| Correct rounding (error – 1-2 digits, result – up to the error digit) | 0,2 | ||
| The dimension of the result is indicated | 0,1 | ||
| Part 3. Torsional oscillations | |||
| Graded if the measurement results are graded! | |||
| 3.1 | If the nuts are not located at the ends of the rod, the grades are divided by factor 2. | 2,5 | |
| For each measurement 0.15 (in total no more than 1.5; falling within the 20% range if the time of less than 10 oscillations is measured, 0.1 per measurement) | 0,15x10=1,5 | ||
| The lower limit of the range is no more than 5.0 cm | 0,2 | ||
| The upper limit of the range is not less than 15.0 cm | 0,2 | ||
| A nonlinear dependence close to hyperbolic is obtained | 0,1 | ||
| Plotting a graph (the axes are labeled and digitized, all points are plotted in accordance with the table, a smoothing curve is drawn) | 0,1+0,2+0,2= =0,5 | ||
| 3.2 | Graded if the degree is -1, the measurement results are graded | 1,5 | |
| The obtained value is q=-1 | 0,5 | ||
| Linearization is carried out on a double logarithmic scale (calculations are provided) (reciprocals, with proof of passing through zero); | 0,5 (0,2+0,2) | ||
| A graph of the linearized dependence is plotted (the axes are labeled and digitized, all points are plotted in accordance with the table, a smoothing line is drawn) | 0,1+0,2+0,2= =0,5 | ||
| 3.3 | If the distance between the threads is different from 10 cm, the grades are divided by factor 2 | 2,5 | |
| For each measurement 0.15 (in total no more than 1.5; falling within the 20% range if the time of less than 10 oscillations is measured, 0.1 per measurement) | 0,15x10=1,5 | ||
| The lower limit of the range is no more than 6.5 cm | 0,2 | ||
| The upper limit of the range is not less than 14.0 cm | 0,2 | ||
| A nonlinear downward convexity dependence is obtained | 0,1 | ||
| A graph of the linearized dependence is plotted (the axes are labeled and digitized, all points are plotted in accordance with the table, a smoothing line is drawn) | 0,1+0,2+0,2= =0,5 | ||
| 3.4 | Linearization is carried out (the squares of periods and distances are calculated) | 0,3 | 1,0 |
| A graph of linearized dependence is plotted (the axes are labeled and digitized, all points are plotted in accordance with the table, a smoothing line is drawn) | 0,1+0,2+0,2= =0,5 | ||
| Straight line is obtained | 0,2 | ||
| 3.5 | Grades if 3.3 – 3.4 are graded | 1 | |
| Numerical values of the coefficients are obtained (in the range of 20%, the dimension -0.1 is not indicated) | 2x0,4=0,8 | ||
| Errors of coefficients are calculated | 2x0,1=0,2 | ||
| Calculation using LSM coefficient 1; graphically, averaging over all points – 0.8; at two points – 0.5; | |||
| Part 4. Mixed oscillations | |||
| Graded if measurement results are graded | |||
| 4.1 | For each measurement 0.2 (total no more than 2.0; within 30% range) | 0,2x10=2,0 | 4 |
| There are two dependency branches (at least 2 points on each) | 1,0 | ||
| The lower limit of the range is no more than 11 cm | 0,2 | ||
| The upper limit of the range is at least 15 cm | 0,2 | ||
| The number obtained N>50 | 0,3 | ||
| Sharp increase (steeper than linear) | 0,1 | ||
| There is an "unmeasured" area in the middle of the range | 0,2 | ||
| 4.2 | The periods are calculated (range – 20%) at 0.05 for each point, at least 3 decimal places) | 0,05x10=0,5 | 0,5 |
| 4.3 | Linearization is proposed (the reciprocal of the number of oscillations from the ratio of periods, the difference of periods); A theoretical calculation of the number of oscillations are carried out and a comparison with experimental results is made. | 0,5 0,2+0,1=0,3 | 1,5 |
| The linearized dependence is calculated | 0,2 | ||
| A graph of linearized dependence is plotted A graph of measurement results is plotted | 0,4 0,2 | ||
| A graph similar to the graph of the modulus number function is obtained | 0,3 | ||
| Correct position of the minimum on the graph | 0,1 | ||
| TOTAL | 20,0 |
Оригинал в Архива: IZhO-2024-Exp_eng.pdf · официални решения: IZhO-2024-Exp_multi_sol.pdf