RMPh 2021, Експеримент — Задача 1. Exercise 1: Visual search
Romanian Master of Physics 2021. Experimental Problem - Measurement of D0 lifetime · 2,6 т.
Условие
Introduction - Context overview
Standard Model
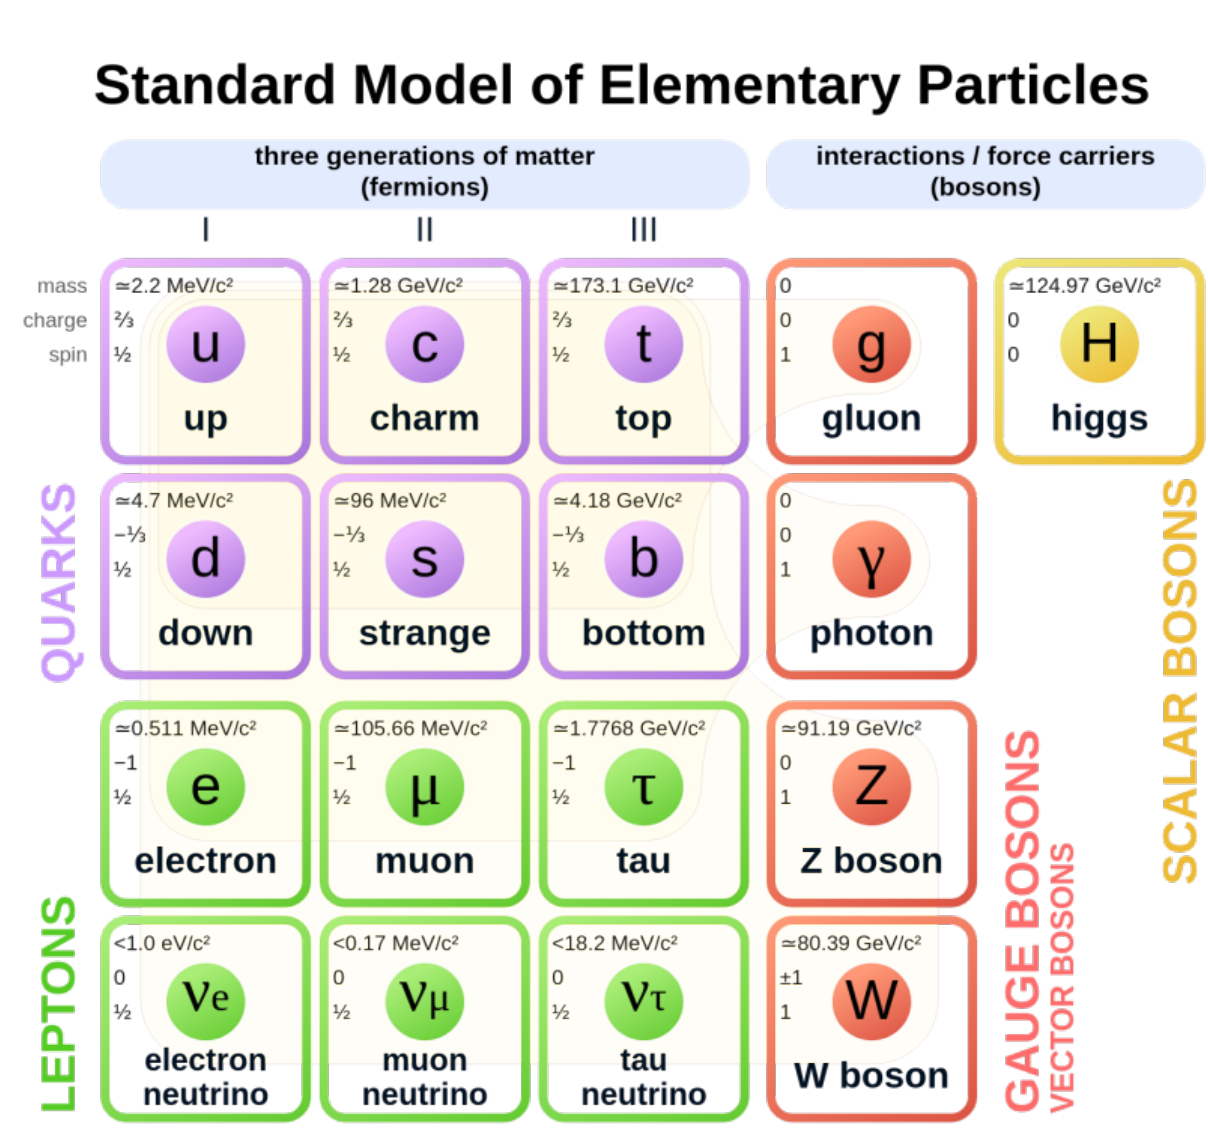
The Standard Model of particle physics is the current theory which explains best the composition of matter to the sizes of atoms and nuclei constituents and the forces between them. Briefly, the visible matter is made of quarks (u, d, c, s, t, b) and leptons (electron, muon, taon) and their antimatter versions, anti-quarks and anti-leptons which interact between them by four fundamental forces: electromagnetic, weak, strong and gravitational, mediated by carrier particles called bosons (photons, Z, W+, W-, gluon), see the table form Figure 1 below. The quarks do not live free in nature, they combine with each other in combinations of 2, 3 or more. Combinations of three quarks are called baryons, for instance proton - (u, u, d) and neutron (u, d, d) which are also long living particles. Some combinations of three or two particles (called mesons) produce unstable particles which decay very fast.
The unstable particles decay to less heavier particles, for instance the meson particle called D can decay to kaon (K) consisting of a strange quark and an anti-up quark, and a pion (pi) which consists of a down anti-quark and an up quark. The +, - and 0 refer to the electric charge of the particle, whether it is positively charged, negatively charged or neutral. These particles have a lifetime which is long enough that they can be measured in current experiments.
D (c anti-u) -> K (s anti-u) + pi(u anti-d).
The setup -LHCb detector
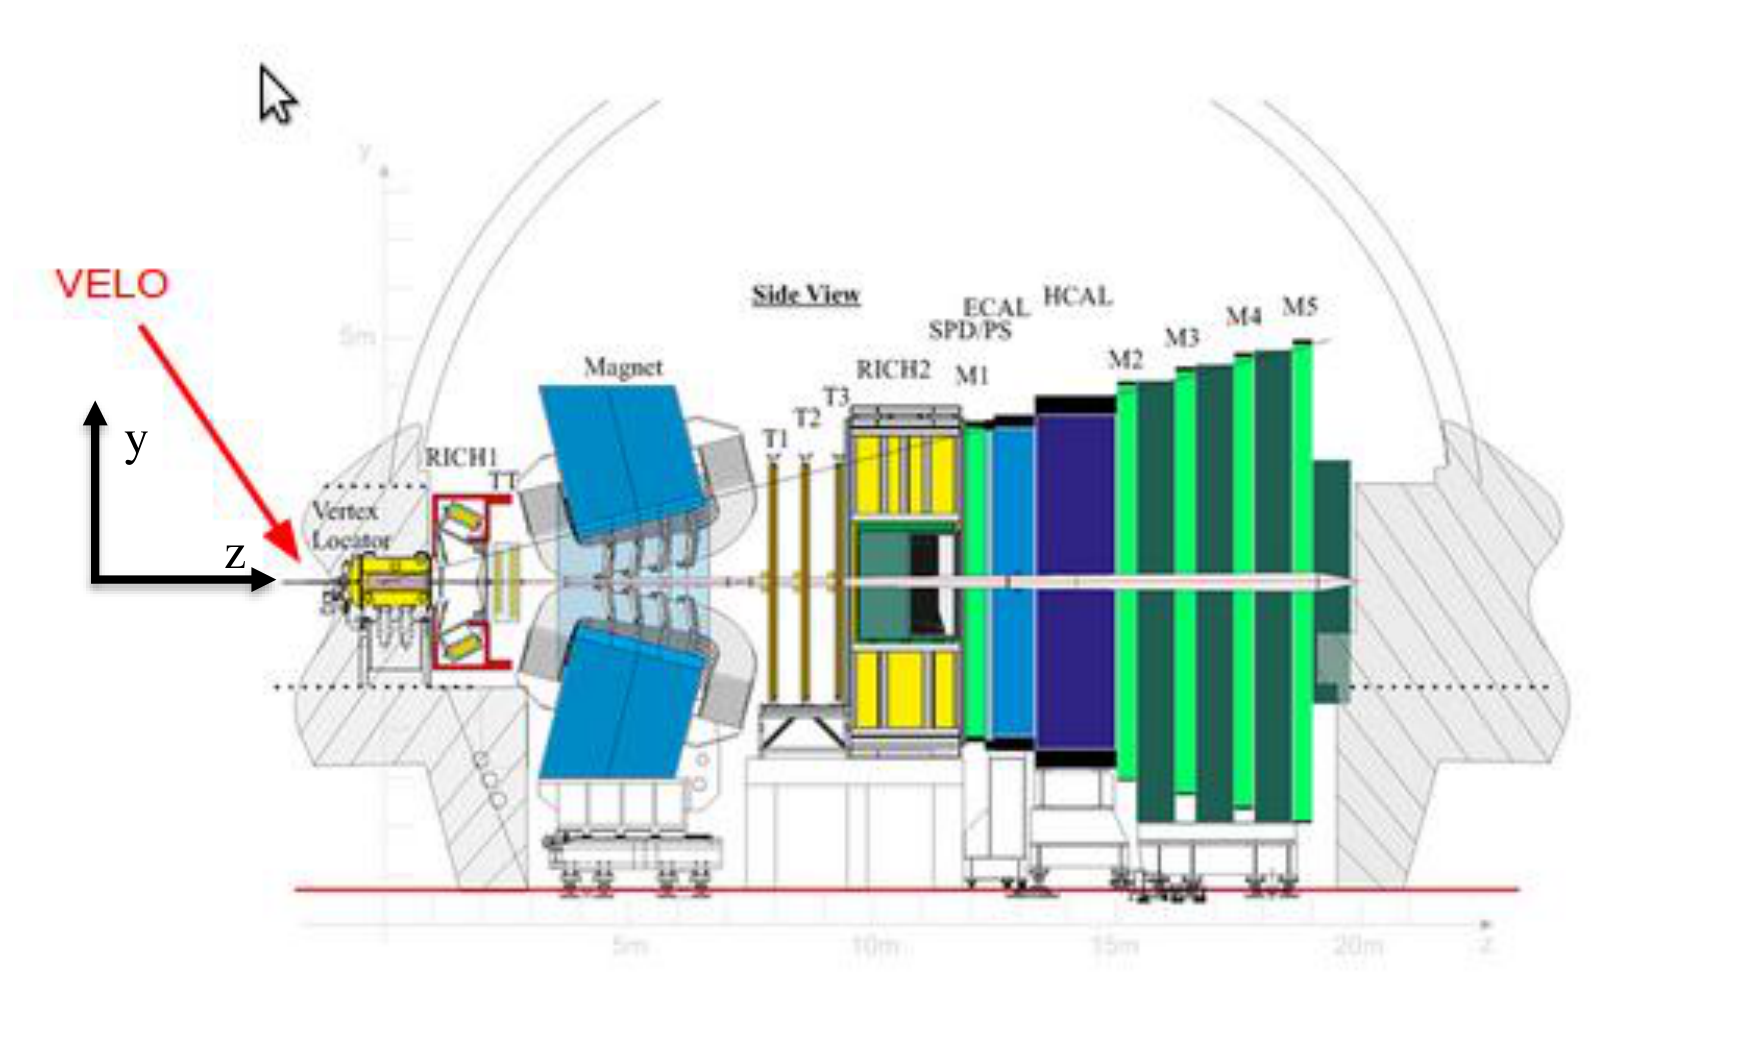
The Large Hadron Collider (LHC) is the largest research infrastructure dedicated for discovering the laws of the subatomic world. The LHCb detector, shown in Fig. 2., is one of the four large scale instruments which record the proton - proton collisions delivered by LHC. The LHCb has many layered subdetectors which contributes to reconstructing the trajectories of the particles coming out of the initial collisions. The place where the protons collide is called the primary vertex, while the places where unstable particles decay (like D0, or exotic particles) are called secondary (tertiary) vertices, or displaced vertices. The presence of the displaced vertices is a sign of an interesting event for physics. The LHCb is able to record the displaced vertices due to its detector called VELO, see Fig, 2, which is very close to the place where protons collide.
The data
The data sample used for this exercise consists of candidates for a type of charmed particle known as a D particle (and the anti-particle ) found in a sample of randomly collected LHC interactions during 2011 datataking. The particles are measured decaying in the following mode (and the conjugate mode ) and they have been preselected such that you can see clearly the signal. In the same dataset there are also other events which are not true D0 candidates but which could not be eliminated with imposed conditions. These candidates are called background in the context of this exercise.
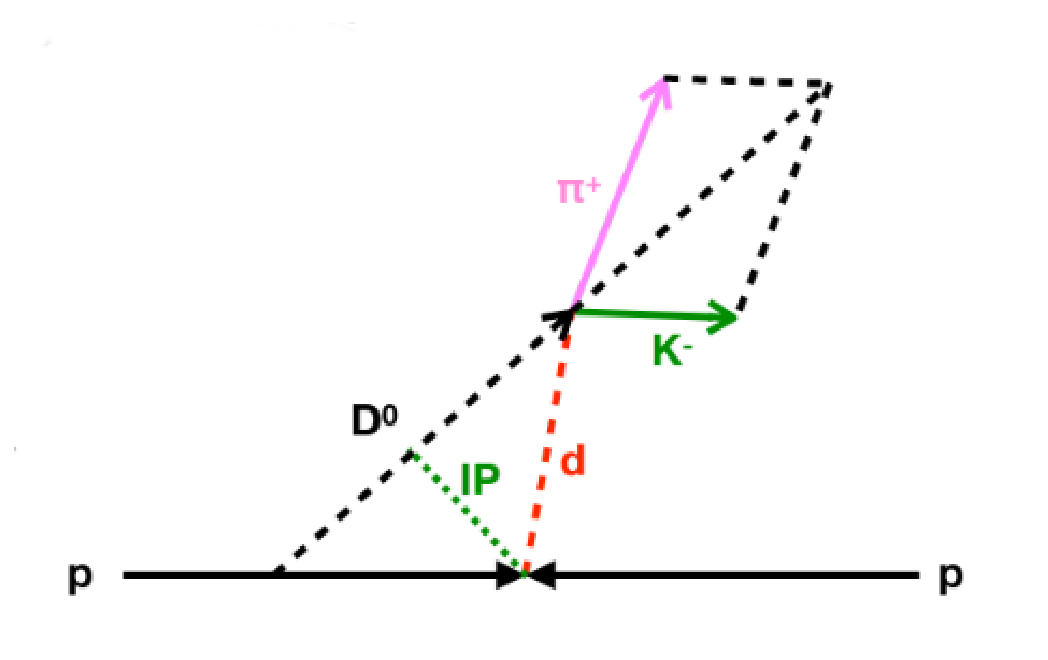
A distinctive feature of D particles is their measurably long lifetime (the object of this exercise). From a practical point of view, this means that they form a "secondary" vertex which is displaced from the "primary" proton-proton interaction. This is illustrated in Fig. 3. Even with these distinctive features, background events, most of which consists of random combinations of particles produced in the proton-proton collision, are still present.
The application
You will access the data through a graphical user interface (GUI) which is described below. For connectivity you should consult the technical guide available to you. The overall goal of the exercises is to determine the lifetime of the particle and the associated measurement uncertainties.
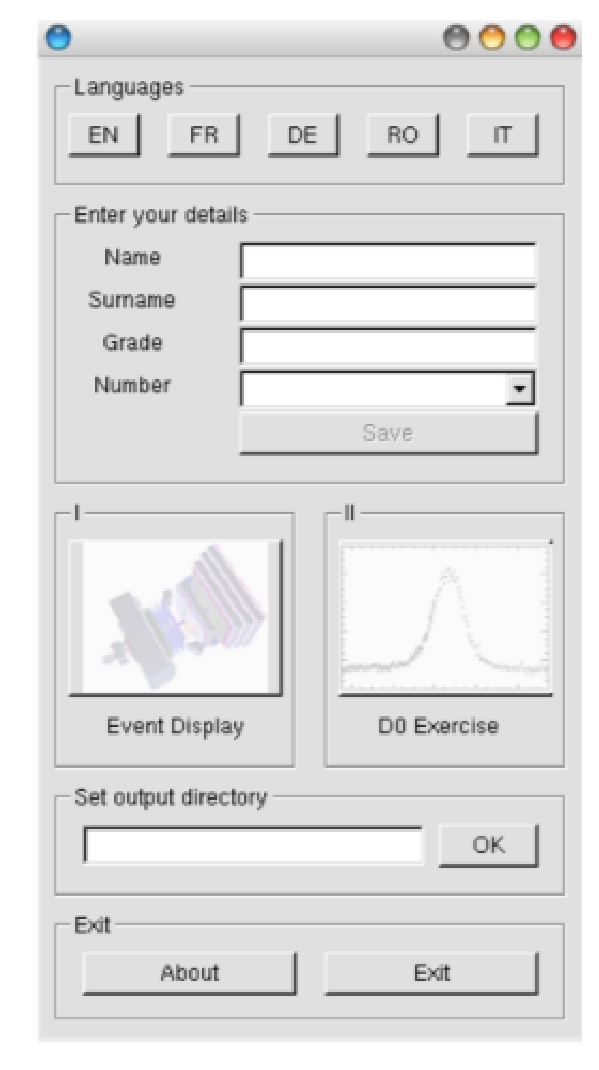
For the first exercise you will use the ‘Event Display’ part of the application, while for the exercises 2 and 3 you will use the ‘D0 Exercise’ part of the application.
Notes:
- You can run in parallel more than one instance of the application
- To activate the ‘D0 exercise’ button you should first select at least one event in the ‘Event display’ part.
- The final saving of your plots, tables, notes will be done outside the application according to the technical guide.
- If during the contest you lose the internet connections you will lose the plots from inside the application, but you still have the ones saved on your computer.
Exercise 1: Visual search
In this exercise you will use the first part of the application called ‘Event display’. You will have access to a visualization of the particle trajectories ("tracks") recorded by the LHCb experiment after a proton - proton collision. Each one will have access to 30 events, they are selected from the menu tab Combinations. Choose the combination with the number communicated to you.
The event display allows you to locate the displaced vertices belonging to D particles in the vertex detector of the LHCb experiment. The tracks are colour coded, and a legend at the bottom of the GUI tells you which colour corresponds to which kind of particle. In order to make identifying vertices easier, you can view an event in three different two-dimensional projections: y-z, y-x, and x-z, show for one event in Fig. 4. Different events will be clearer in different projections! Displaced vertices appear as a pair of intersecting tracks, far away from the other tracks in the event. When you click on a particle, you will see its information, including mass and momentum, in the Particle Info box.
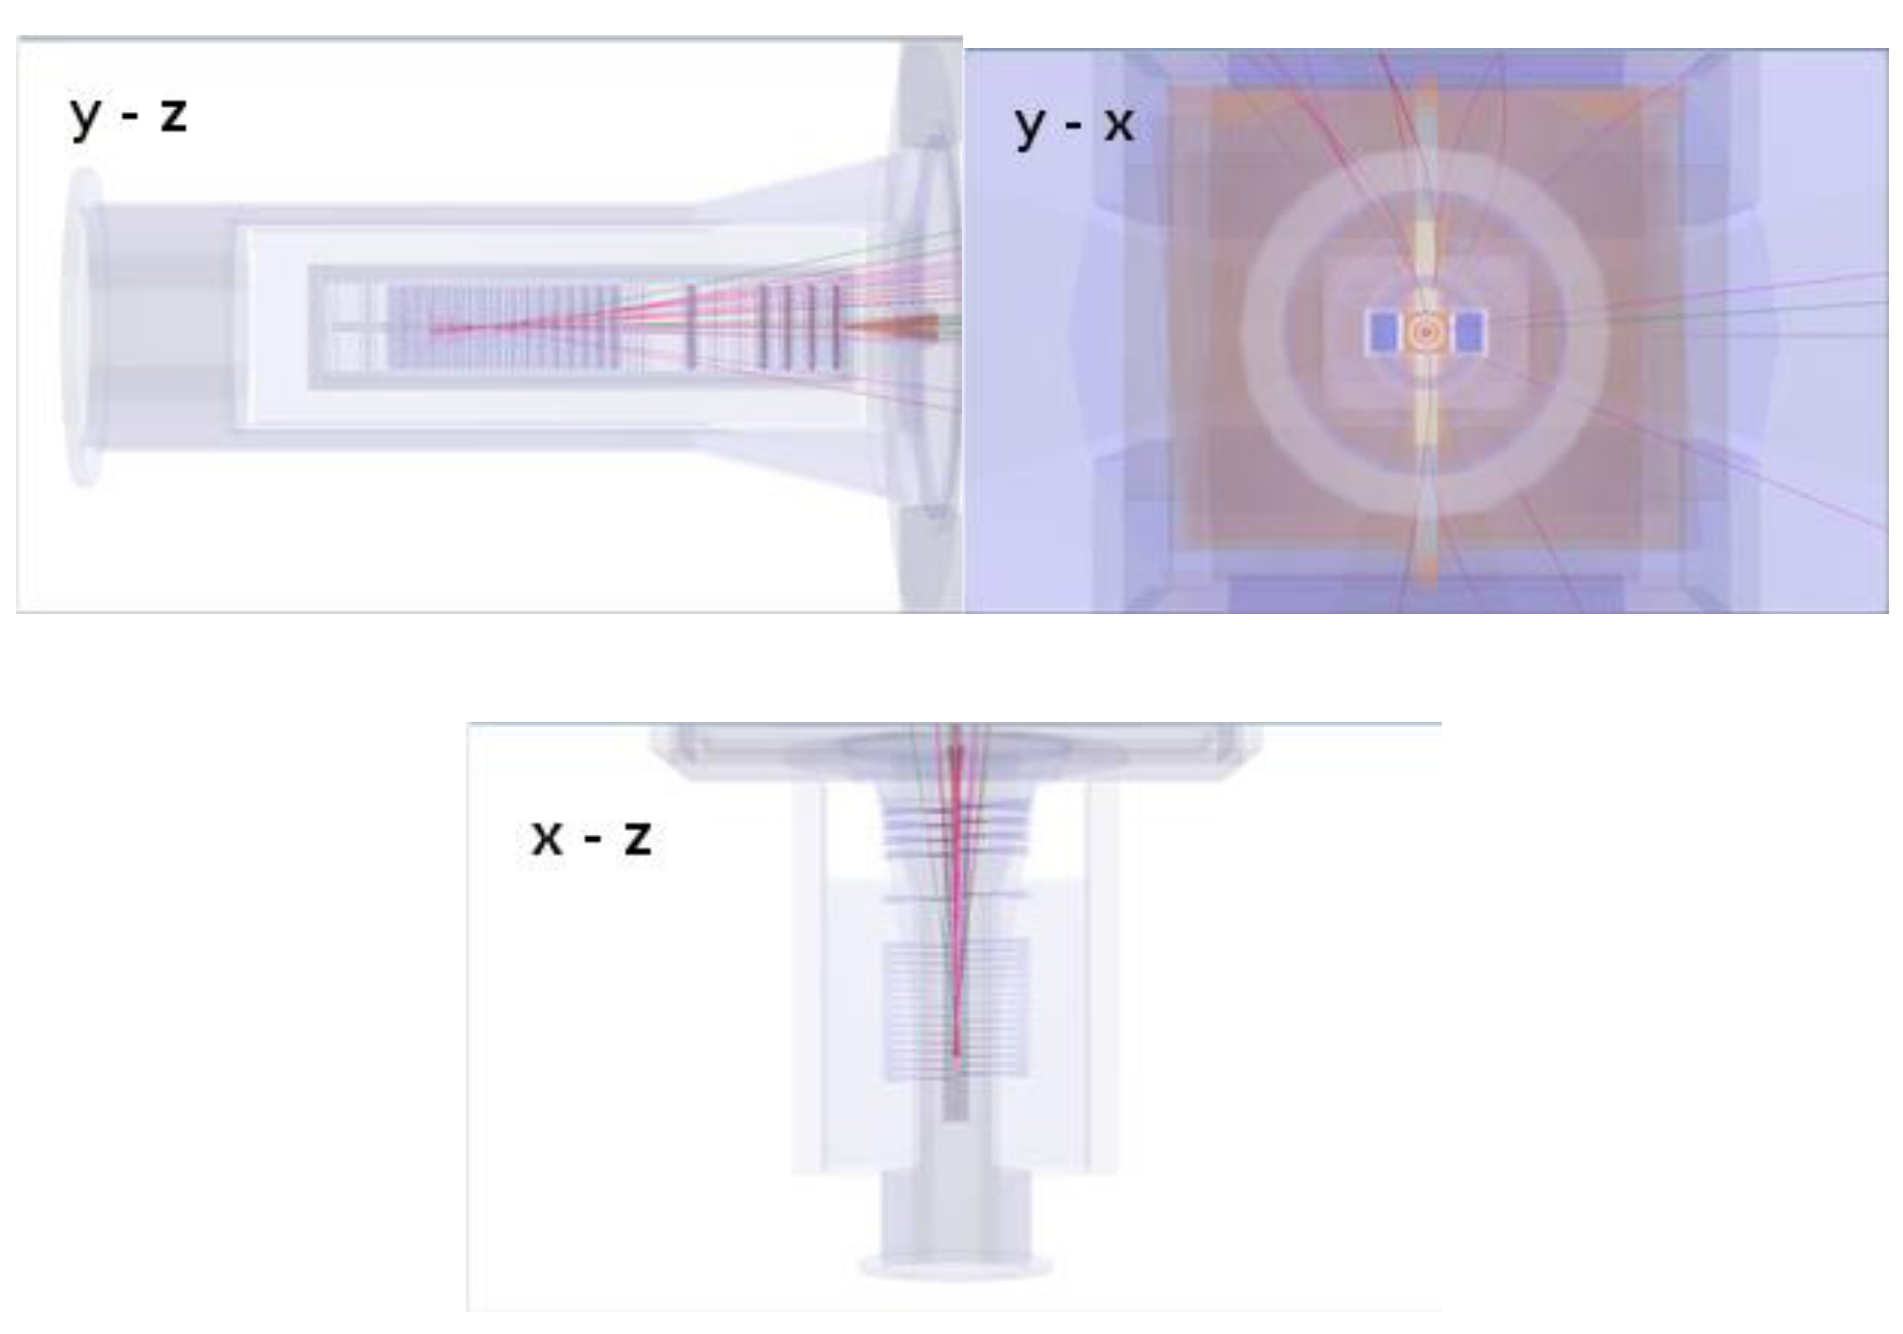
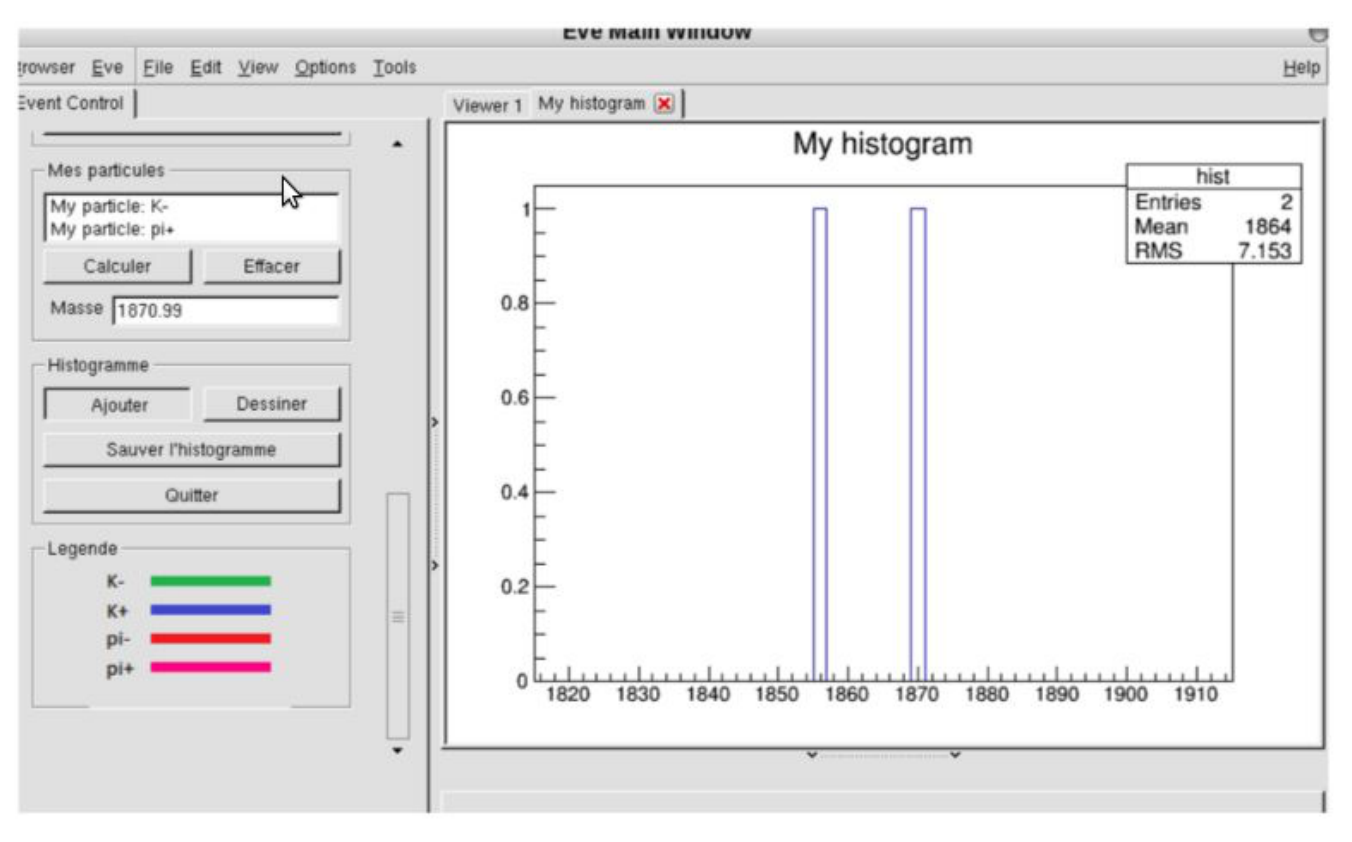
A D particle decays into a kaon and a pion, so you will need to find a displaced vertex where a kaon track intersects with a pion track. Once you find a track which you think is part of the displaced vertex, you can save it using the Save Particle button. Once you have saved two particles, you can compute their mass by clicking on the Calculate button. If you think this combination has a mass compatible with that of the D particle, click on Add to save it : by saving a combination for each event, you will build up a histogram of the masses of the displaced vertices in the different events.
As you are looking at real data the set contains both signal and background, and the detector has a finite resolution, so not all displaced vertices will have exactly the D mass (even the signal ones). They should, however, be within the range 1816-1914 MeV (this range is around 3% each way around the true D mass). If you try to save a combination which is too far away from the real D mass the application will warn you that you have not found the correct displaced vertex pair and won't let you save it.
Tasks
1.1 Look at the events you are given and for each event identify a or candidate. Record, on paper or electronically, the candidates and the mass obtained in each event. Add the combination to the total mass (in the application).
| Evt. no | # D0 mass | # anti - D0 mass |
|---|---|---|
| x.1 | ||
| x.2 | ||
| x.3 | ||
| ... | ||
| ... |
If you are not able to find the displaced vertex for an event, you can move on to the next event and come back later to the events you skipped. Once you have looked at all events, you can examine your mass histogram by clicking the Draw button. [2,1 т.]
1.2 With the data recorded, make similar histogram plots as in the previous task, distinctively for D0 and anti-D0 candidates. Compute the ratio between the number of the two types of candidates. [0,5 т.]
Решение
Grading scheme for Experimental Problem
Experimental Problem - Measurement of D0 lifetime
Exercise 1: Visual search
1.1 The table with the entries, maximum of points for all 30 events 2,1p
| Evt. no | # D0 mass | # anti - D0 mass |
|---|---|---|
| x.1 | ||
| x.2 | ||
| x.3 | ||
| ... | ||
| ... |
1.2 The histogram (an example below) and the ratio of #D0/# anti-D0 0,5 p
Оригинал в Архива: RMPh_2021_Q4.pdf · официални решения: exp_sol.pdf