GeCAA 2020, Анализ на данни — Задача 1. AGN
GeCAA-2020 — Data Analysis · 15 т.
Условие
It is believed that the accretion disk around supermassive black holes (BH) at galactic centres gives rise to UV thermal emission. This emission is associated with Active Galactic Nuclei (AGNs).
The optical spectra of bright AGNs show additional bright broad emission lines. Those emission lines arise from the dense gas in the Broad Line Region (BLR), which is ionized by the UV photons from the accretion disk. See the sketch to visualise this model.
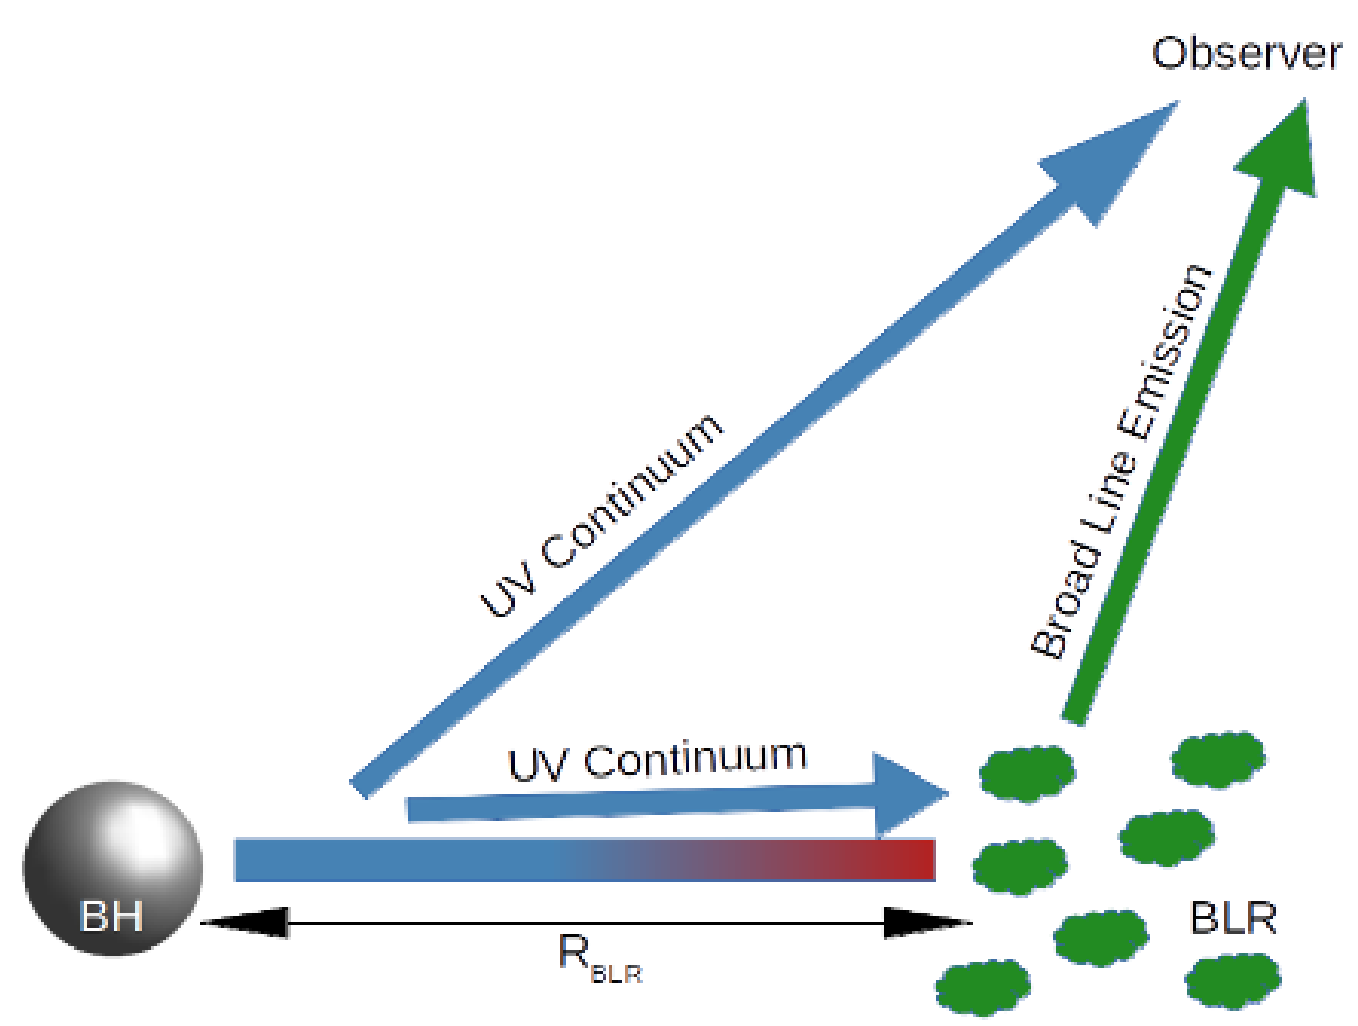
We can assume that the flux of broad emission lines varies in response to the variation of the UV continuum with a time delay. This time delay is proportional to the separation between the BH and the BLR.
Assume that the size of the accretion disk is negligible as compared to .
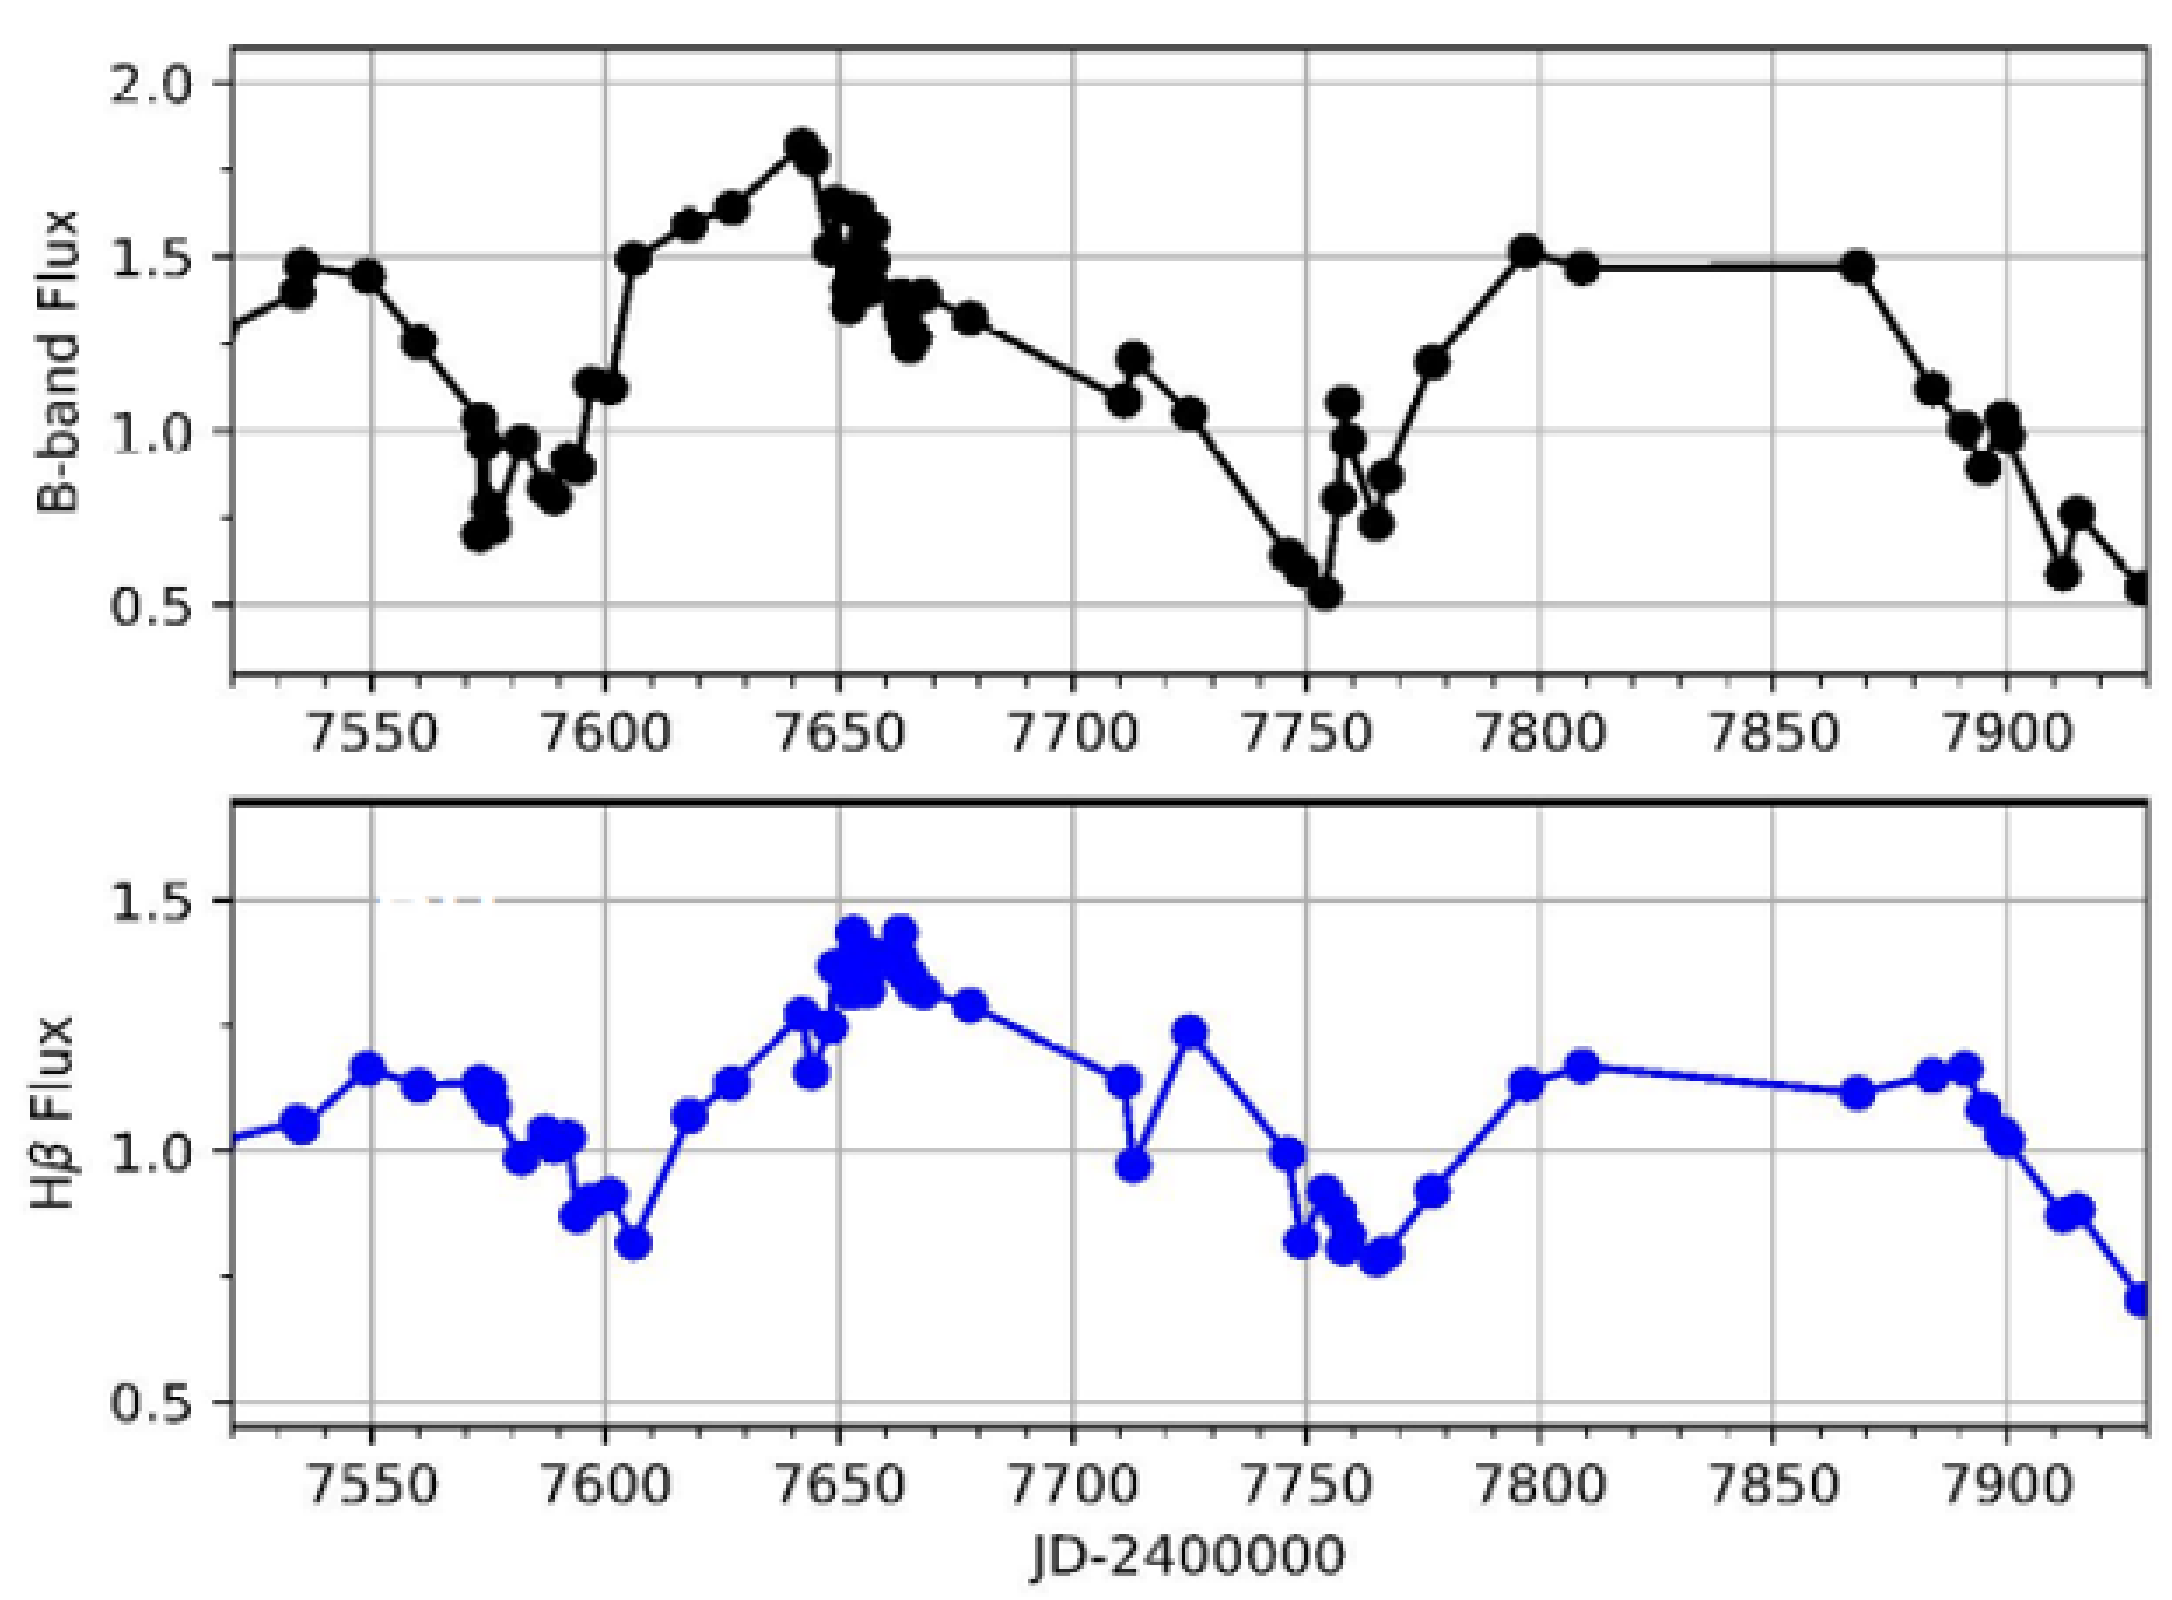
(a) Estimate the time lag (in days) between the B-band continuum and broad emission line () using the light curves shown below. The x-axis is in reduced Julian Dates (JD).
[1 т.]
(b) Estimate in parsecs (pc). [3 т.]
(c) Estimate the angular separation of this region (in arcsec) from the blackhole, if this AGN is 100 Mpc away from us.
It is possible to estimate the mass of the system using the Virial theorem if the velocity dispersion of the gasses in the BLR and the size of the system are known. Assume that the masses of the accretion disk and broad line region are negligible, as compared to the black hole. The velocity dispersion may be estimated from the broadening of the given emission line. We will take the corresponding wavelength dispersion to be
where FWHM is the full width at half maximum of the broad emission line. [2 т.]
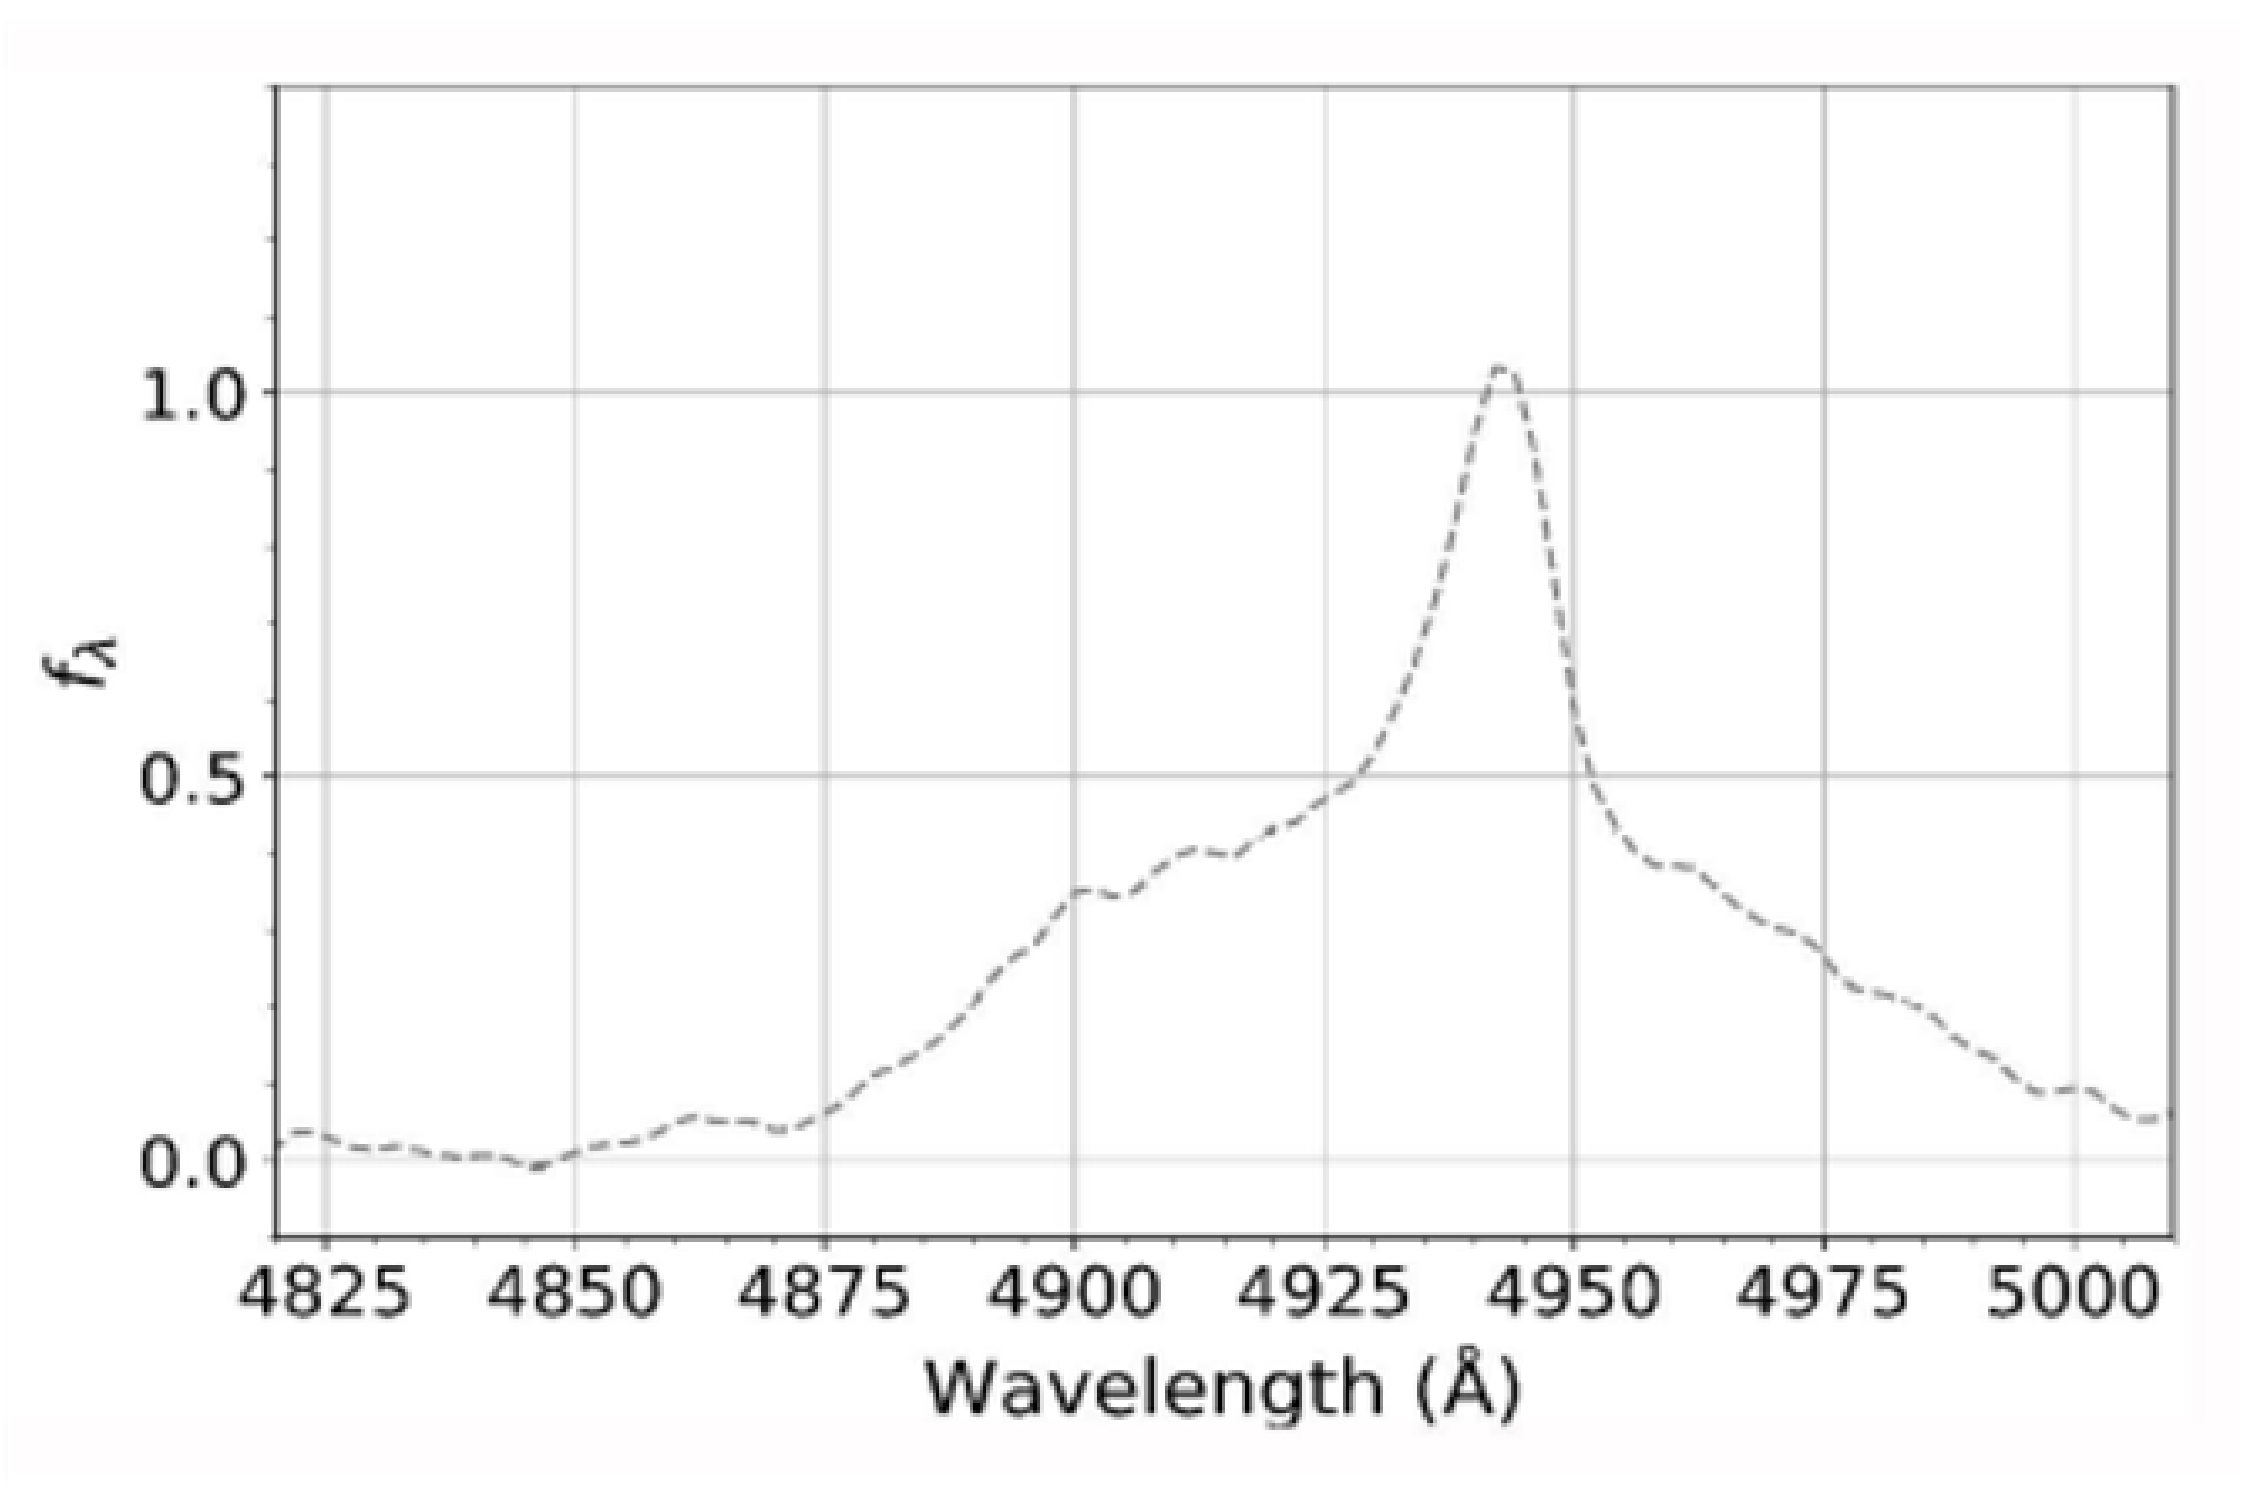
(d) Calculate the velocity dispersion in units of km/s, from the spectral line shown below.
[5 т.]
(e) Calculate the mass of the central BH () in Solar masses . [4 т.]
Отговори
- (a) 20-25 days (answers from 15 to 25 days are acceptable)
- (b) 0.017 pc
- (c) 0.000035 arcsec
- (d) 2200 km/s
- (e) Msun
Решение
It is believed that the accretion disk around supermassive black holes (BH) at galactic centres gives rise to UV thermal emission. This emission is associated with Active Galactic Nuclei (AGNs).
The optical spectra of bright AGNs show additional bright broad emission lines. Those emission lines arise from the dense gas in the Broad Line Region (BLR), which is ionized by the UV photons from the accretion disk. See the sketch to visualise this model.
We can assume that the flux of broad emission lines varies in response to the variation of the UV continuum with a time delay. This time delay should be proportional to the separation between the BH and the BLR.
Assume that the size of the accretion disk is negligible as compared to .
(a) (1 point) Estimate the time lag (days) between the B-band continuum and broad emission line (H-) using the light curves shown below. The x-axis is in reduced Julian Dates (JD).
(b) (3 points) Estimate in parsecs (pc).
(c) (2 points) Estimate the angular separation of this region (in arcsec) from the blackhole, if this AGN is 100 Mpc away from us.
It is possible to estimate the mass of the system using the Virial theorem, if the velocity dispersion of the gasses in the BLR and the size of the system are known. Assume that the masses of the accretion disk and broad line region are negligible, as compared to the black hole. The velocity dispersion may be estimated from the broadening of the given emission line. We will take the corresponding wavelength dispersion to be
where FWHM is the full width at half maximum of the broad emission line.
(d) (5 points) Calculate the velocity dispersion in units of , from the spectral line shown below.
(e) (4 points) Calculate the mass of the central BH () in a unit of .
Solution
(a) Taking multiple reference points, we get that the BLR emission lags by about 20-25 days. 1.0
Answers from 15 to 25 days are acceptable.
(b) As the AGN is located very far, the time lag can be approximated as the time taken by UV emission to reach BLR region. Thus,
3.0
(c) As this AGN is 100 Mpc away from us,
2.0
(d) The FWHM is approximately and the peak is approximately at 2.0
2.0
1.0
(e)
4.0
Оригинал в Архива: GeCAA-2020_Data_Analysis.pdf · официални решения: Data Analysis Solutions.pdf