IAO 2013, Практически тур, Група β — Задача 7. Distance to the galaxy NGC 4214
XVIII International Astronomy Olympiad. Vilnius, Lithuania, 6 – 14. IX. 2013. Round Prac, Group β. Practical round. Problems to solve · 6 септември 2013 г.
Условие
The usage of novae in outbursts as distance indicators is based on the correlation of their absolute magnitudes at maximum brightness with their rates of decline. The simplified relationship between the absolute magnitude at maximum of a nova and its rate of decline may be expressed through the linear expression:
where and are constants to be determined using observational data of a certain number of galactic novae with spatially resolved shells, is the rate of decline, i.e. the time (expressed in days) that it takes the nova to drop by 2 magnitudes below its light maximum. should be evaluated from the graph of the light curve of a nova.
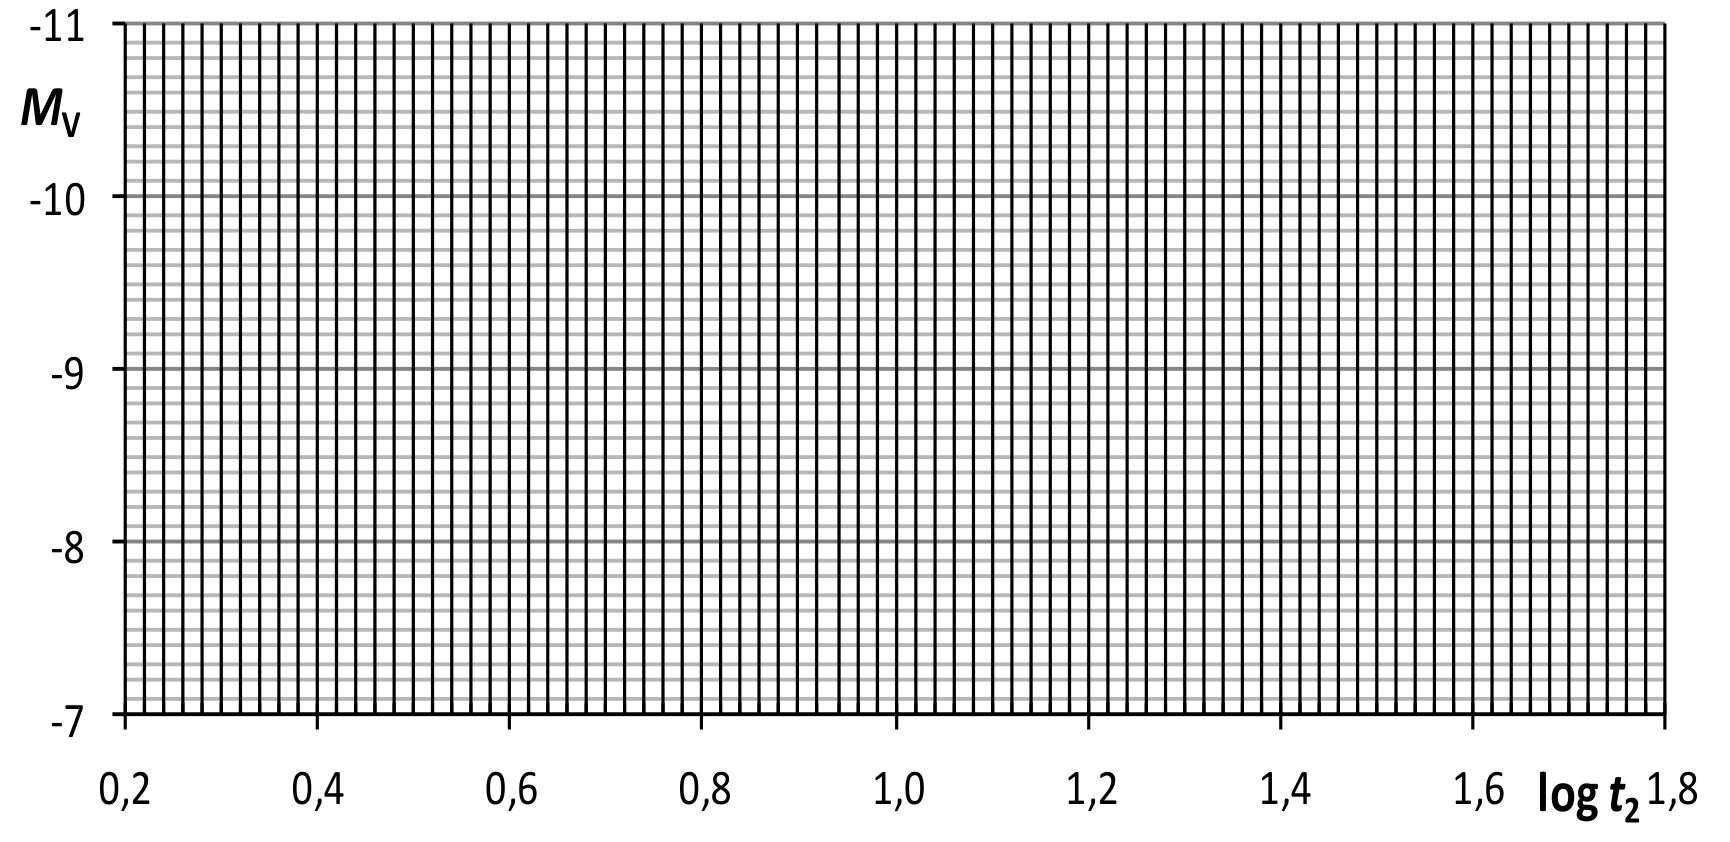
7.1. Using data of Table 1 determine the constants and in the expression (1). The results of the calculations should be written in Table 1a. A graph template (Fig. 1a) should be used for determination of constants and .
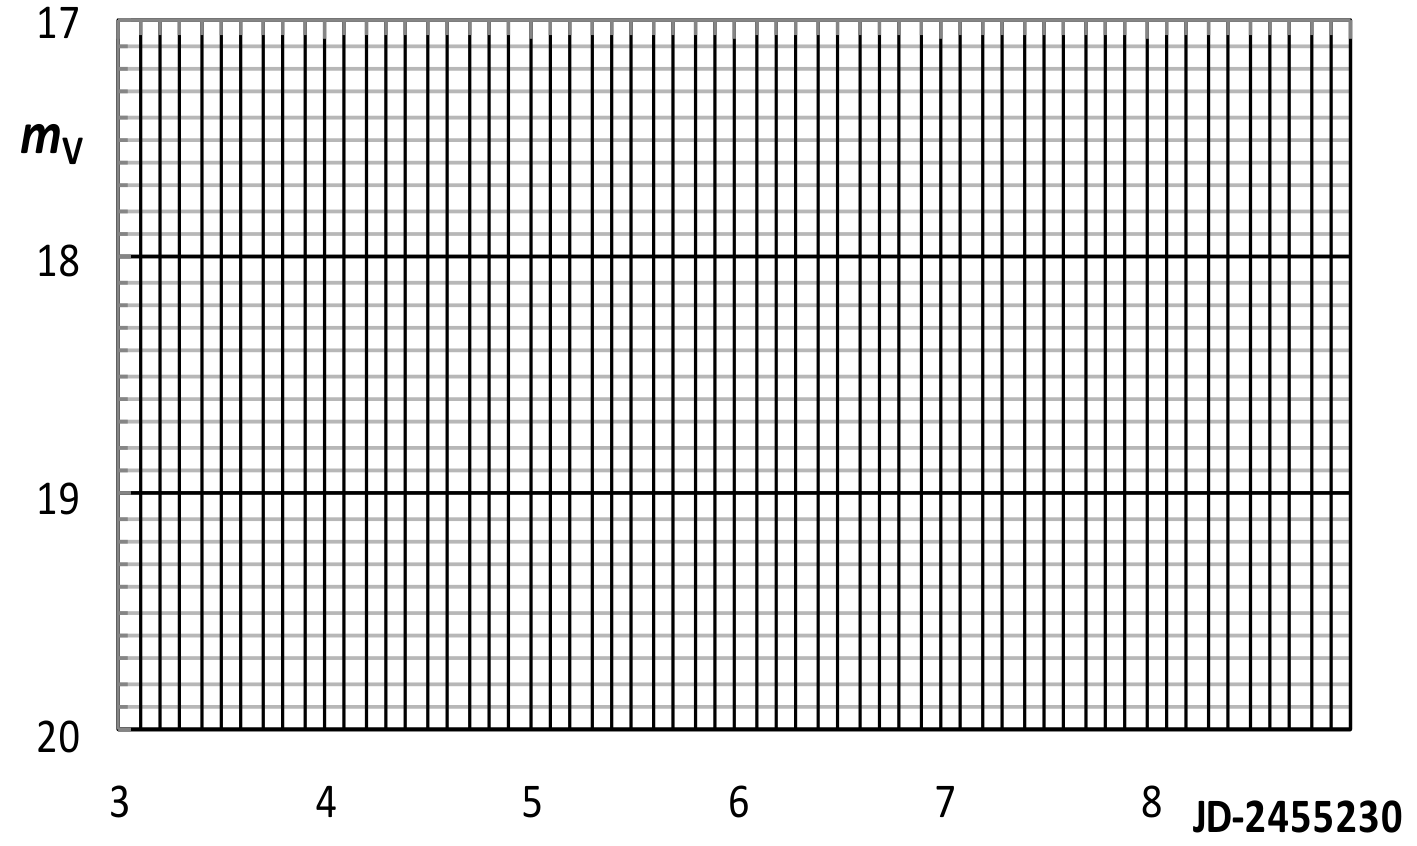
7.2. Using the obtained expression and photometric data of a nova, which erupted in the galaxy NGC 4214, calculate the distance to this galaxy. Photometric data of this nova are given in Table 2. A graph template (Fig. 2a) should be used for the plot of the light curve of the nova.
Observational data
Data of Table 1:
- Number of the nova.
- Time of maximum brightness of the nova, , in Julian Days (JD).
- Apparent magnitude of the nova at maximum brightness, .
- Rate of decline: time to drop by 2 magnitudes below maximum, , in days (d).
- Angular radius of the expanding shell, , in arcsec.
- Time of measurement of the shell radius, T, in Julian Days (JD).
- Shell expansion rate, v, in km/s.
- Interstellar extinction in the direction of the nova, .
Table 1. Data of galactic novae for determination of a and b
| No. | (JD) | (d) | (arcsec) | T (JD) | v (km/s) | (mag) | |
|---|---|---|---|---|---|---|---|
| 1 | 2412083 | 4.5 | 45 | 9 | 2444798 | 600 | 1.3 |
| 2 | 2442655 | 1.9 | 2 | 1.5 | 2445707 | 1500 | 1.4 |
| 3 | 2427794 | 1.6 | 39 | 10 | 2444798 | 500 | 0.3 |
| 4 | 2438061 | 3.5 | 22 | 3.5 | 2445707 | 1100 | 0.6 |
| 5 | 2428340 | 2.0 | 5 | 11 | 2444798 | 1600 | 0.8 |
| 6 | 2430676 | 0.7 | 6 | 9 | 2450898 | 800 | 0.3 |
Data of Table 2: first column is time of observation in Julian Days (JD); second column is the apparent magnitude of the nova.
Table 2. Observations of the nova in NGC 4214
| Time (JD) | Apparent magnitude |
|---|---|
| 2455233.1 | 17.6 |
| 2455233.8 | 17.3 |
| 2455234.5 | 17.6 |
| 2455236.5 | 18.7 |
| 2455237.5 | 19.4 |
| 2455238.5 | 19.8 |
Table 1a and graph templates
Table 1a. Results of calculations of the parameters of the galactic novae
| No. | (JD) | R (AU) | d (pc) | ||
|---|---|---|---|---|---|
| 1 | |||||
| 2 | |||||
| 3 | |||||
| 4 | |||||
| 5 | |||||
| 6 |
Fig. 1a. Graph template for determination of the constants in expression (1).
Fig. 2a. Graph template for the plot of the light curve of the nova NGC 4214.
Data of Table 1:
column is the number of the nova;
– the time of the maximum brightness of the nova, , in Julian Days (JD);
– the apparent magnitude of the nova at maximum brightness, ;
– the rate of decline, i.e. the time that it takes the nova to drop by 2 magnitudes below maximum, , in days (d);
– the angular radius of the expanding shell of the nova, (in arcsec);
– the time of the measurement of the radius of the nova shell, , in Julian Days (JD);
– the rate of expansion of the shell of the nova, , in km/s;
– the interstellar extinction in the direction of the nova, .
Data of Table 2:
column is the time of observation in Julian Days (JD);
– the apparent magnitude of the nova.
Table 1. Data of the galactic novae for determination of the constants a and b;
Table 2. Observations of the nova in NGC 4214;
Table 1a. Results of calculations of the parameters of the galactic novae;
Fig. 1a. Graph template for determination of the constants in the expression (1);
Fig. 2a. Graph template for the plot of the light curve of the nova NGC 4214.
Решение
Official English solution.
7.1. Calibration from galactic novae
Distances of the novae from Table 1 are calculated using their shell radii assuming that their rates of expansion are constant. Linear radius of the nova’s shell:
where v is the expansion rate of the nova’s shell, and is the time interval that elapsed from the nova’s outburst up to time when the angular radius of nova’s shell have been measured. Radii of the shells should be expressed in astronomical units (au). Since 1 au = km and 1 day = 24 h × 3600 s = 86400 s we get
Distance to a nova is calculated by the formula:
Since is a small angle and is measured in arcsec, and R is expressed in au, we get the distance expressed in parsecs:
Then absolute magnitudes of the novae are calculated by the formula:
Table 1a. Results of calculation of the parameters of the galactic novae
| No. | (JD) | R (au) | d (pc) | ||
|---|---|---|---|---|---|
| 1 | 32715 | 11336 | 1260 | −7.3 | 1.65 |
| 2 | 3052 | 2644 | 1763 | −10.7 | 0.30 |
| 3 | 17004 | 4910 | 491 | −7.2 | 1.59 |
| 4 | 7646 | 4857 | 1388 | −7.8 | 1.34 |
| 5 | 16458 | 15207 | 1382 | −9.5 | 0.70 |
| 6 | 20222 | 9343 | 1038 | −9.7 | 0.78 |
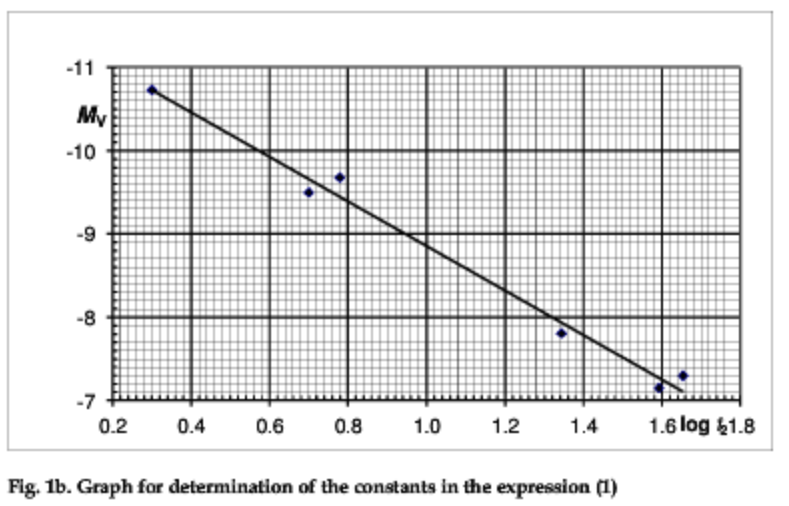
Now we plot the graph and draw the straight line best fitted through the points (Fig. 1b).
The equation of the line is
7.2. Distance to NGC 4214
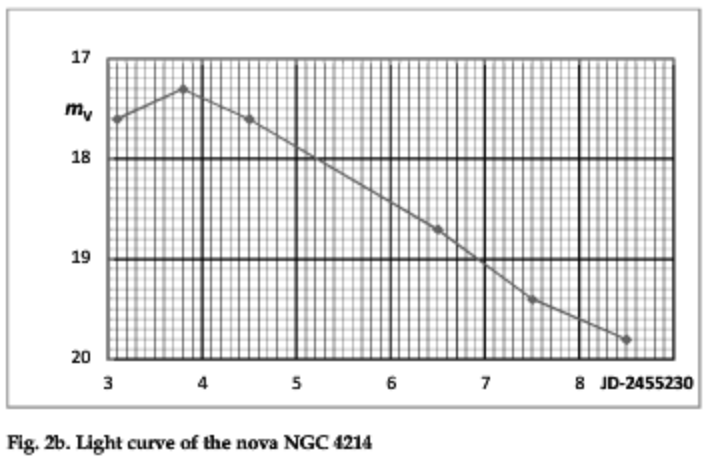
We use the data of Table 2 to plot the light curve of the nova in NGC 4214 (Fig. 2).
From this graph we see that the nova reached its light maximum, , at JD = 2455233.8. Brightness of the nova dropped by 2 mag from its maximum at about JD = 2455237.35. So we get the time days.
Using the relation (1a) we get the absolute magnitude of the nova NGC 4214 at its maximum
We assume that interstellar extinction in the direction of the nova (as well as NGC 4214) is negligible and calculate distance to the galaxy NGC 4214:
Answer: Distance to the galaxy NGC 4214 is 3.0 Mpc.
Оригинал в Архива: betapract7.pdf · официални решения: b7sol1.png · допълнителни данни: betapract7data.pdf · допълнителни данни: b7sol2.png · допълнителни данни: b7sol3.png