IAO 2016, Практически тур — Задача 7. The Initial Mass Function and supernovae
XXI International Astronomy Olympiad — Practical round (Group α, β) · 5 октомври 2016 г. · 8 т.
Условие
The evolution of a single star depends solely on its mass, therefore mass is the most important parameter of stars. It is believed that the distribution of stars by mass at the time of their birth (also known as Initial Mass Function, IMF) is universal.
7.1. The star formation rate in our galaxy is / year. Stars born with mass greater than explode as core-collapse supernovae. Estimate the core-collapse supernova rate in the galaxy. (Or: how often do core-collapse supernovae explode in our galaxy?)
Hint: What is the average initial mass of a core-collapse supernova? What fraction of the total star formation mass goes into supernovae ()? Find the answers to these questions by doing measurements on the IMF figure (Fig.2). [6 т.]
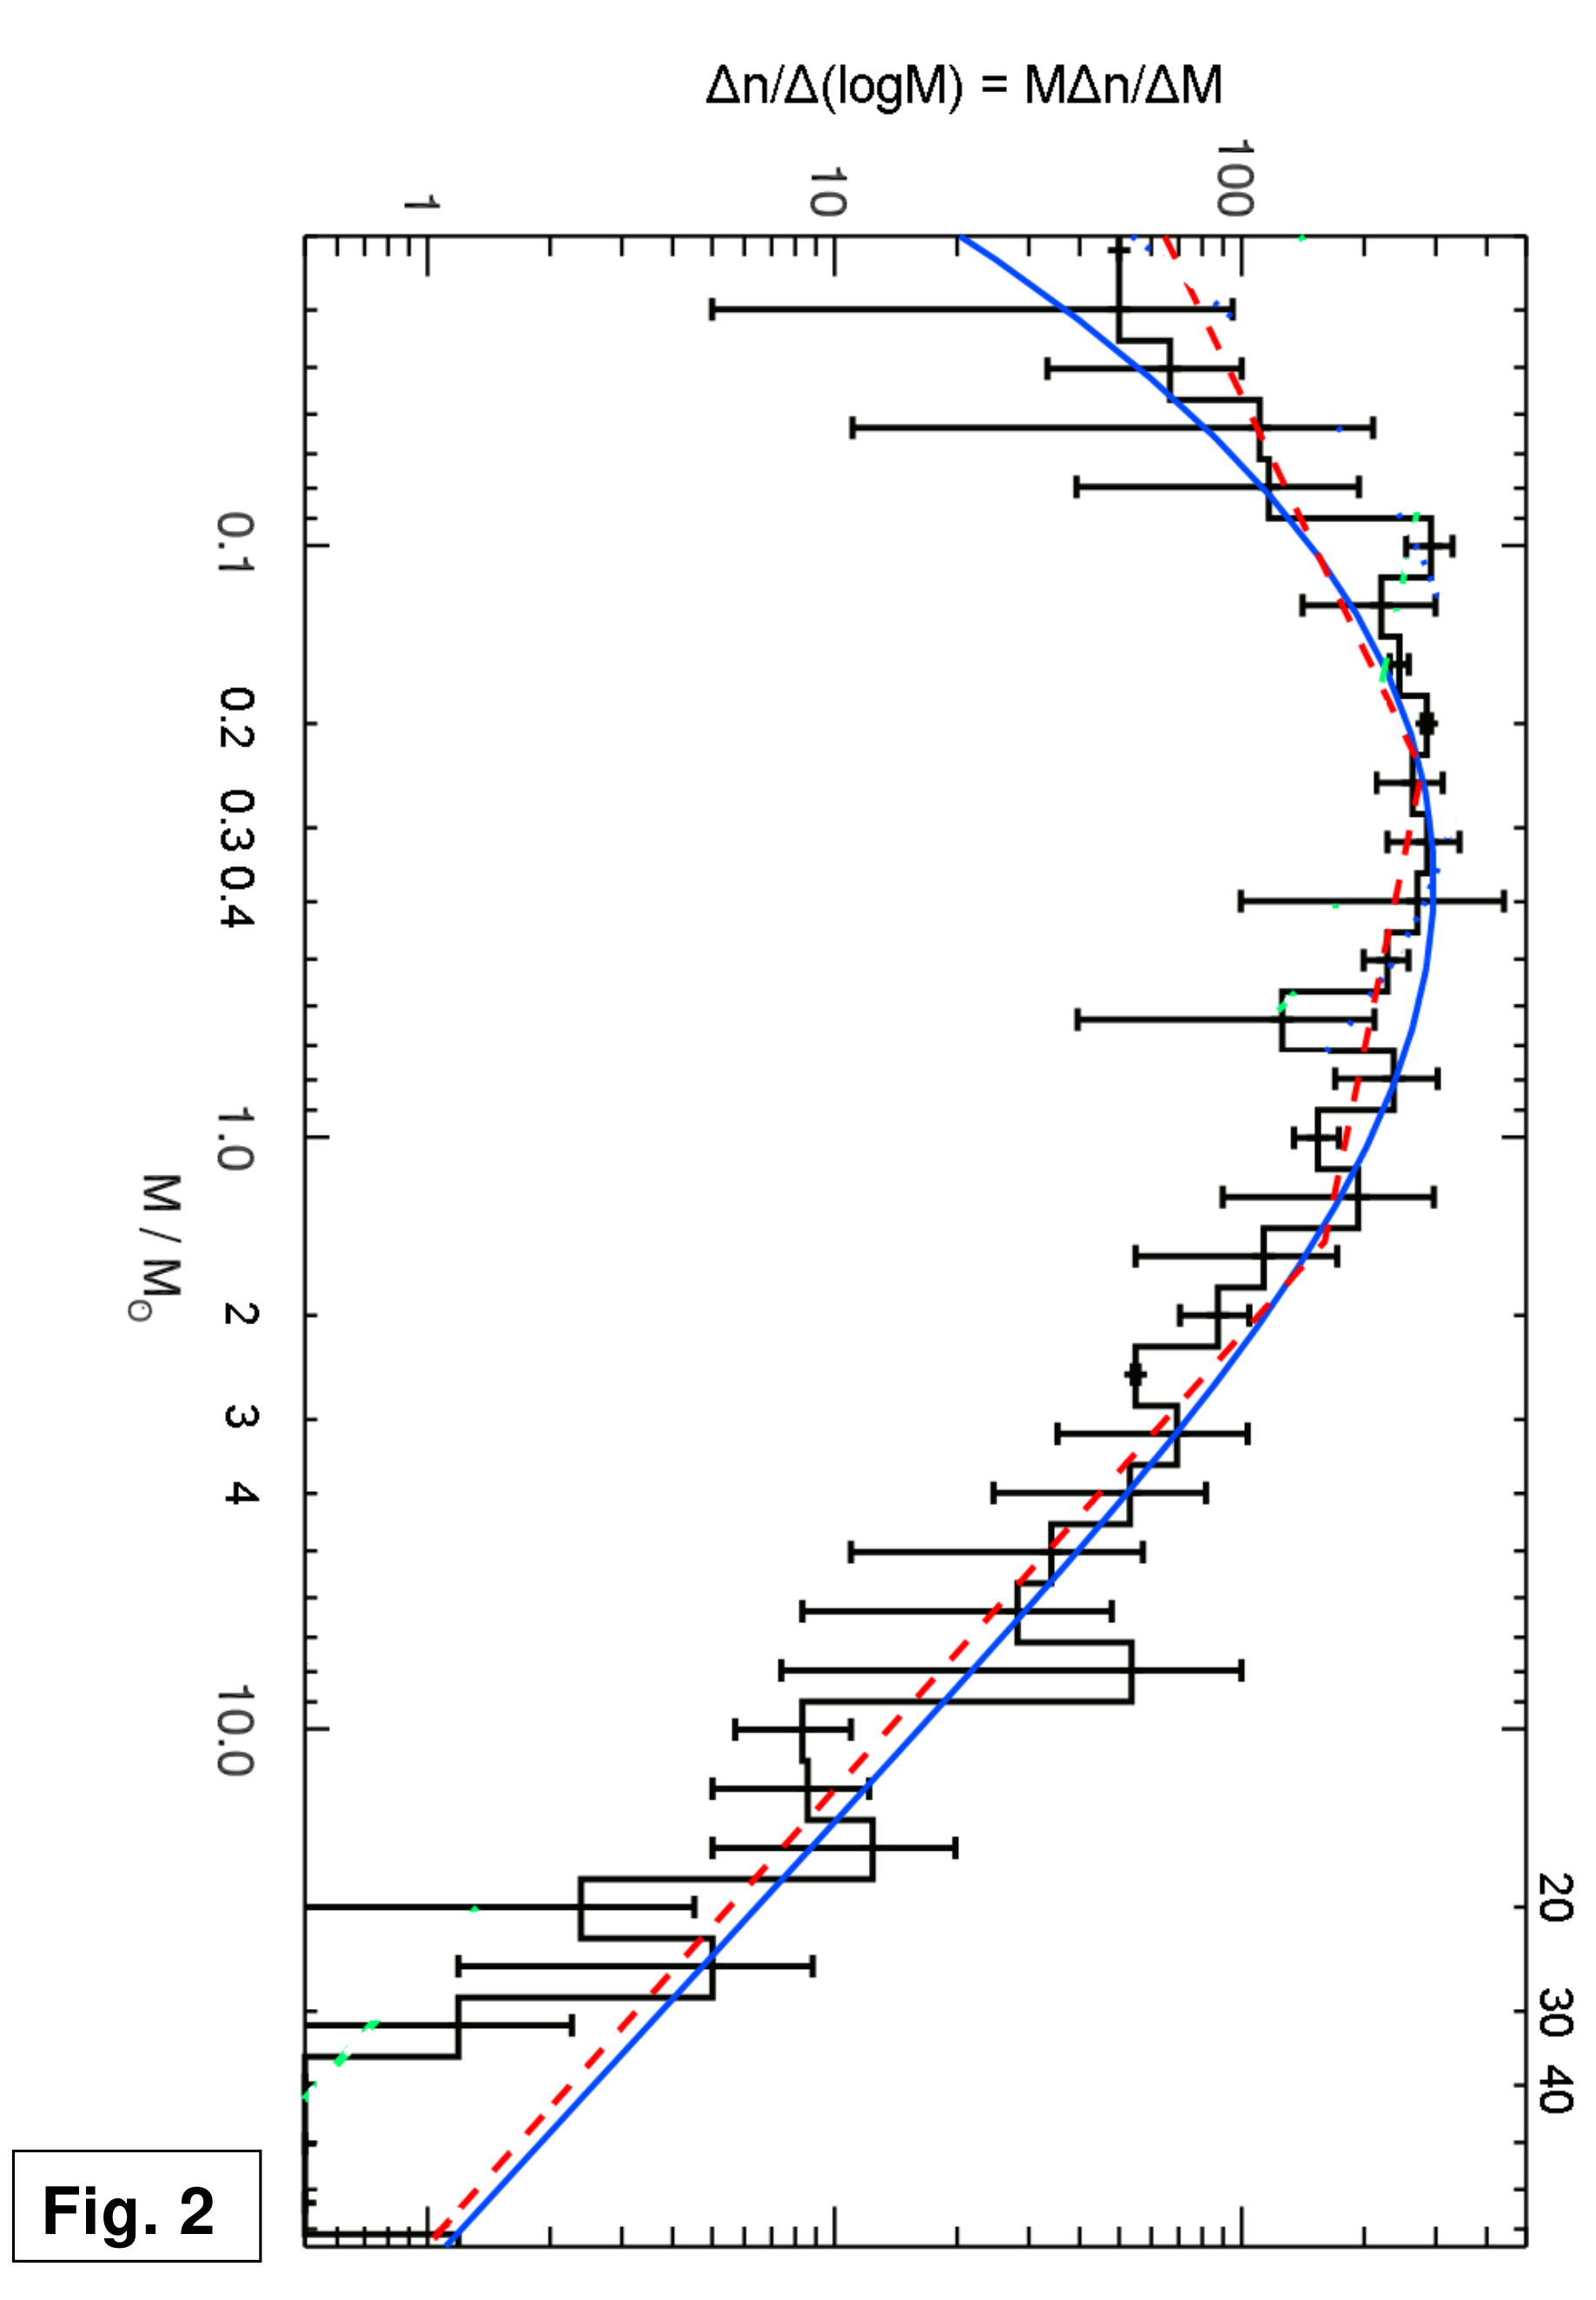
7.2. What is the frequency [yr] of directly observed supernovae in the Milky Way? If there is a significant difference to your result from 7.1., provide an explanation by drawing schemes and, if necessary, by including a very short text (not more than 20 words). [2 т.]
Отговори
7.1. 0.12 yr⁻¹
Official solution: MSN ~ 20 M☉, q ~ 30%, f = q(ΔM/Δt)/MSN ~ 0.12 yr⁻¹ (a supernova each 8 years); values within an order of magnitude are accepted. The actual values quoted are MSN ~ 12 M☉, q ~ 8%, f = 1/20 yr⁻¹.
7.2. 0.0025 yr⁻¹
Official solution: f ~ 1/400 yr⁻¹; many explosions are obscured by dust in the galactic disk.
Решение
The gravitational constant is or
Problem αβ-7. The Initial Mass Function and supernovae.
7.1. 6pts (3pts for reasonably accurate measurements + 3pts for further considerations)
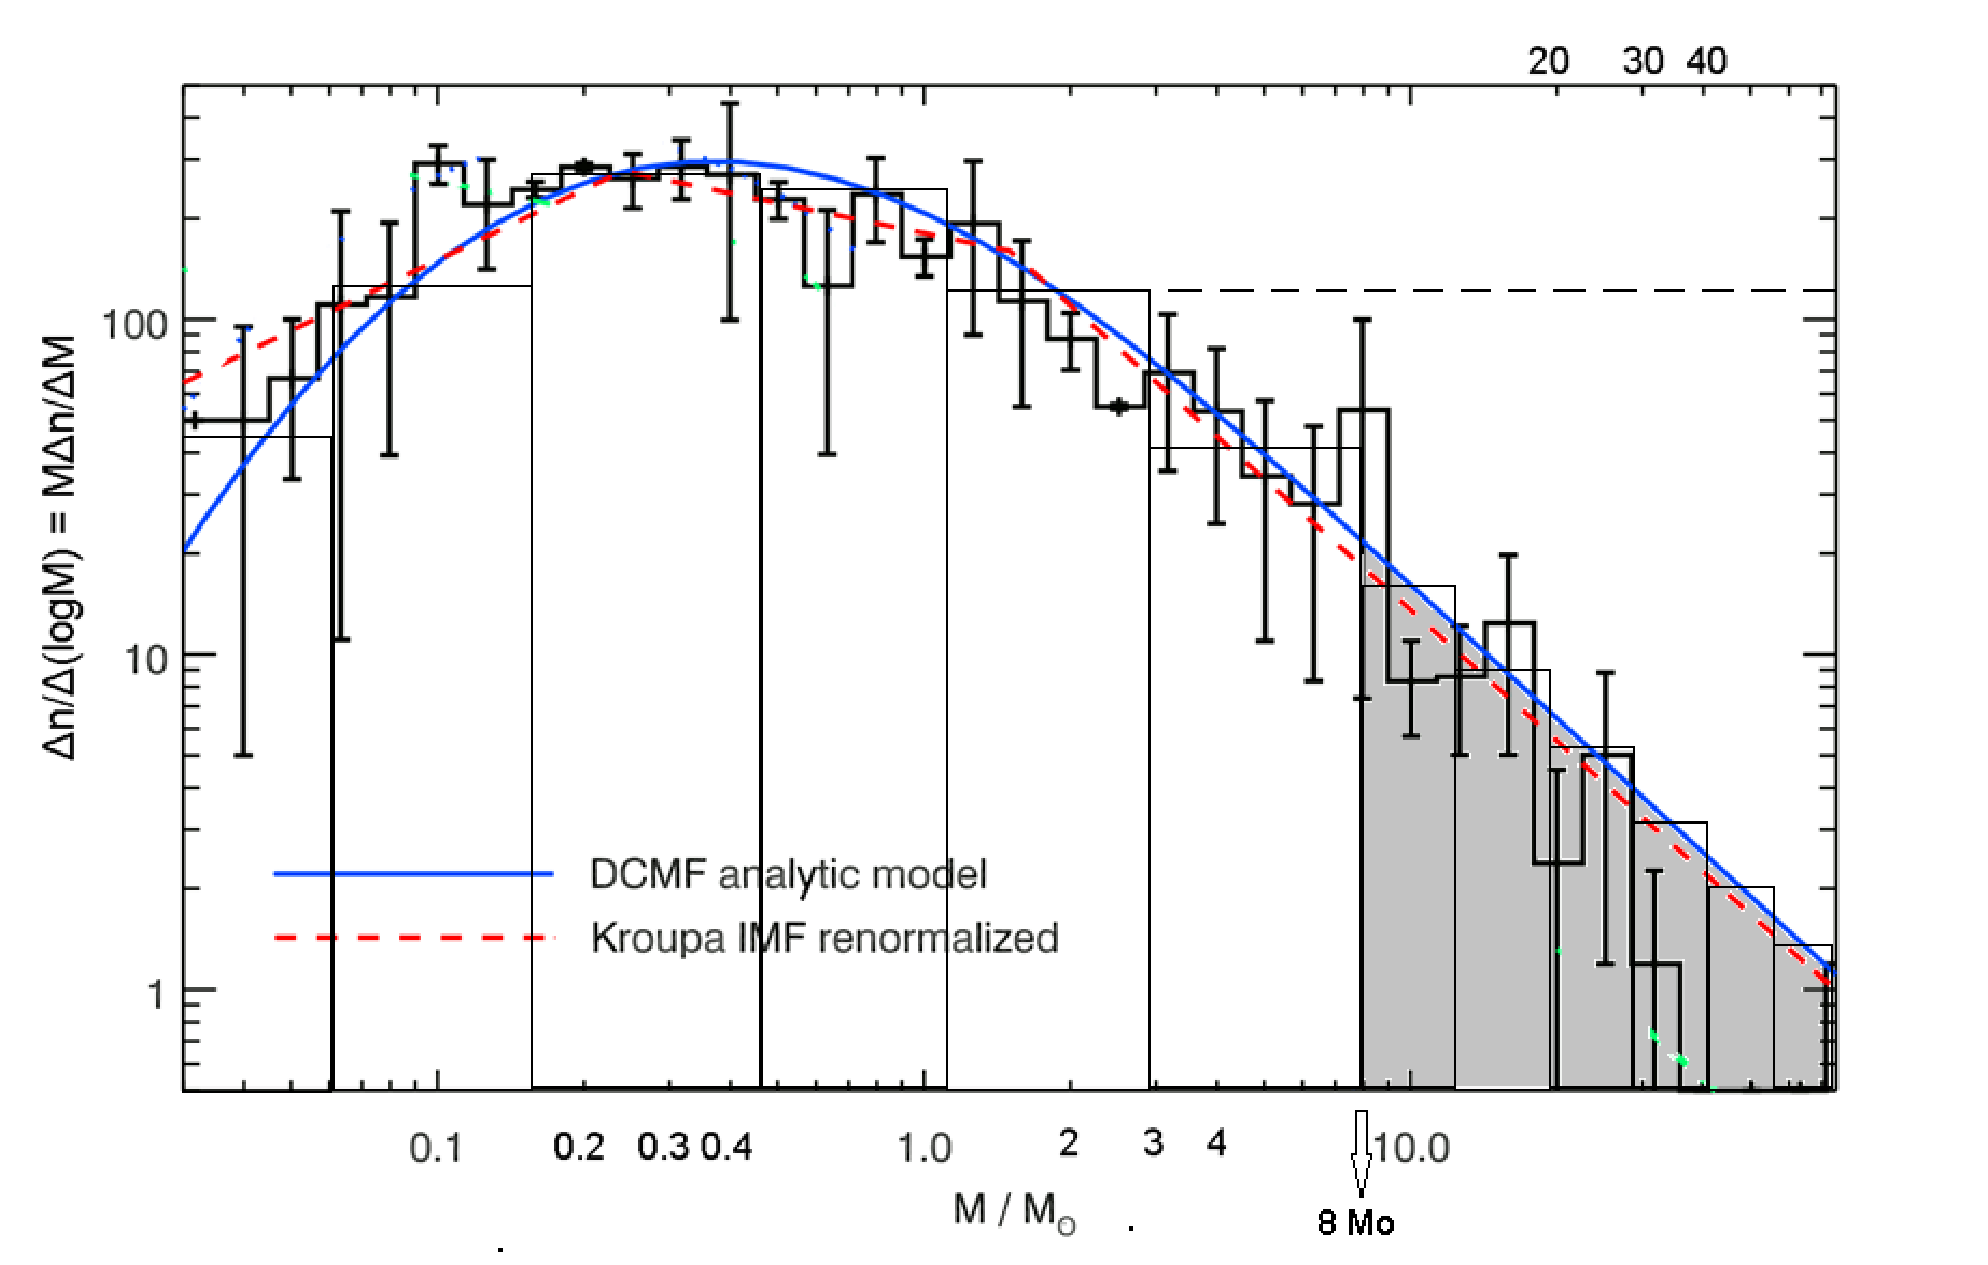
Stars with an initial mass > explode as core-collapse supernovae. Let us mark on the IMF figure the space where these stars reside with grey. Then we divide both the left and the right part of the graph with bins. We calculate the scales on both axes:
X:
Y: (defining )
The base of the Y-axis logarithm is irrelevant – if it is changed, the function is multiplied by a constant and the final results should be the same.
For each bin we calculate the width and the height . We make the rough approximation that so the process is analogous to numerical integration and can be expressed with integrals as well. For further accuracy the function can be extrapolated linearly until it crosses the X-axis at ~ .
For each bin we then calculate the X-axis center M and the value of that corresponds to the bin width. If the values to the left of the vertical line are , and to the right are , , we can obtain
A reasonable result would be , .
Other mathematical methods and bin distributions may be used so these values are correct within an order of magnitude. Participants from group α can avoid the usage of logarithms by considering the Y-axis in the form and by doing linear approximations between the X-axis ticks (or by choosing bins using the ticks).
As the galactic star formation rate is said to be , and the timescale of the evolution of massive stars is much lower than the change of this rate, the mass rate of supernova explosions is
This mass is distributed among objects with an average mass therefore the expected frequency is
or the derived expectations are that there should be a supernova each 8 years on average. Please note that the mass loss of massive stars is not taken into account which leads to significant systematic errors. The mass of supernova progenitors right before the explosion is significantly lower than their initial mass. The actual values are , , and .
7.2. 2pts
The last directly observed galactic supernovae exploded in 1006, 1054, 1572 and 1604 and some of them were type Ia, which are less massive systems with a different mechanism of explosion. So the approximate value of the observed frequency is
This value is significantly lower than the one derived in 7.1. A possible explanation is that many explosions are obscured by dust as massive stars are situated in the galactic disk. As we lie inside it, the galactic disk covers a large angular area on the sky which is not easy to monitor. Furthermore, most of the observations historically were conducted from the Northern Hemisphere.
Оригинал в Архива: practical_7ab.pdf · официални решения: practical_7ab-solution.pdf