IAO 2018, Практически тур — Задача 7. Calibration of solar spectrum
IAO 2018 — Practical round (α and β)
Practical round. Problems to solve
XXIII International Astronomy Olympiad. Colombo, Sri Lanka, 6–14 X 2018. This source combines groups α and β. The distinct task 6 of each group is identified as 6α and 6β; tasks 7 and 8 are shared and are reproduced once.
Бележки от източника
The repeated 0.25, 0.32 and 0.37 Julian-day entries in the α table 6 are retained exactly. The α data sheet bears the header Theo although the body says Practical round. Question 8.5 refers to provided graph paper, which is absent from this source pack. Matching official practical solutions were not found in the complete same-year catalogue.
Shared reference inventory
The two separately archived data photographs are labelled Theo: data_1 contains Solar-System properties, the equation of time and Colombo coordinates; data_2 contains physical constants and formulae. They were read to check reference coverage and do not contain missing practical graph paper, additional practical tasks or official solutions.
Условие
The spectrograph equipped with 45 cm Cassegrain telescope at Arthur C Clarke observatory, Sri Lanka, observed the Sun. A part of the solar absorption spectrum is shown in figure 7.1. The spectrum is colour inverted for the clarity of the spectral lines. The bottom line is the solar absorption spectrum and the top line is the emission spectrum of Fe-Ne lamp. This emission spectrum is used for calibration of the solar spectrum. Both spectra are in same image frame.
Figure 7.2. demonstrates solar absorption spectrum and the Fe-Ne emission spectrum. The red line is solar absorption spectrum and black line is Fe-Ne emission spectrum. The wavelength in angstrom (Å) of few emission lines of Fe-Ne are given in the figure 7.2. Y axis is the normalized flux. Assume the X axis is pixels of the CCD image.
7.1 Copy the table 7. to your answer book and find out the corresponding pixel using the grid in figure and fill the table.
7.2 Plot the wavelength (Å) vs pixels for the data in table 7.
7.3 Draw the best fit straight line through the data points.
7.4 Hence determine the wavelength of the marked absorption line (L1) in figure 7.2.
Figure 7.1
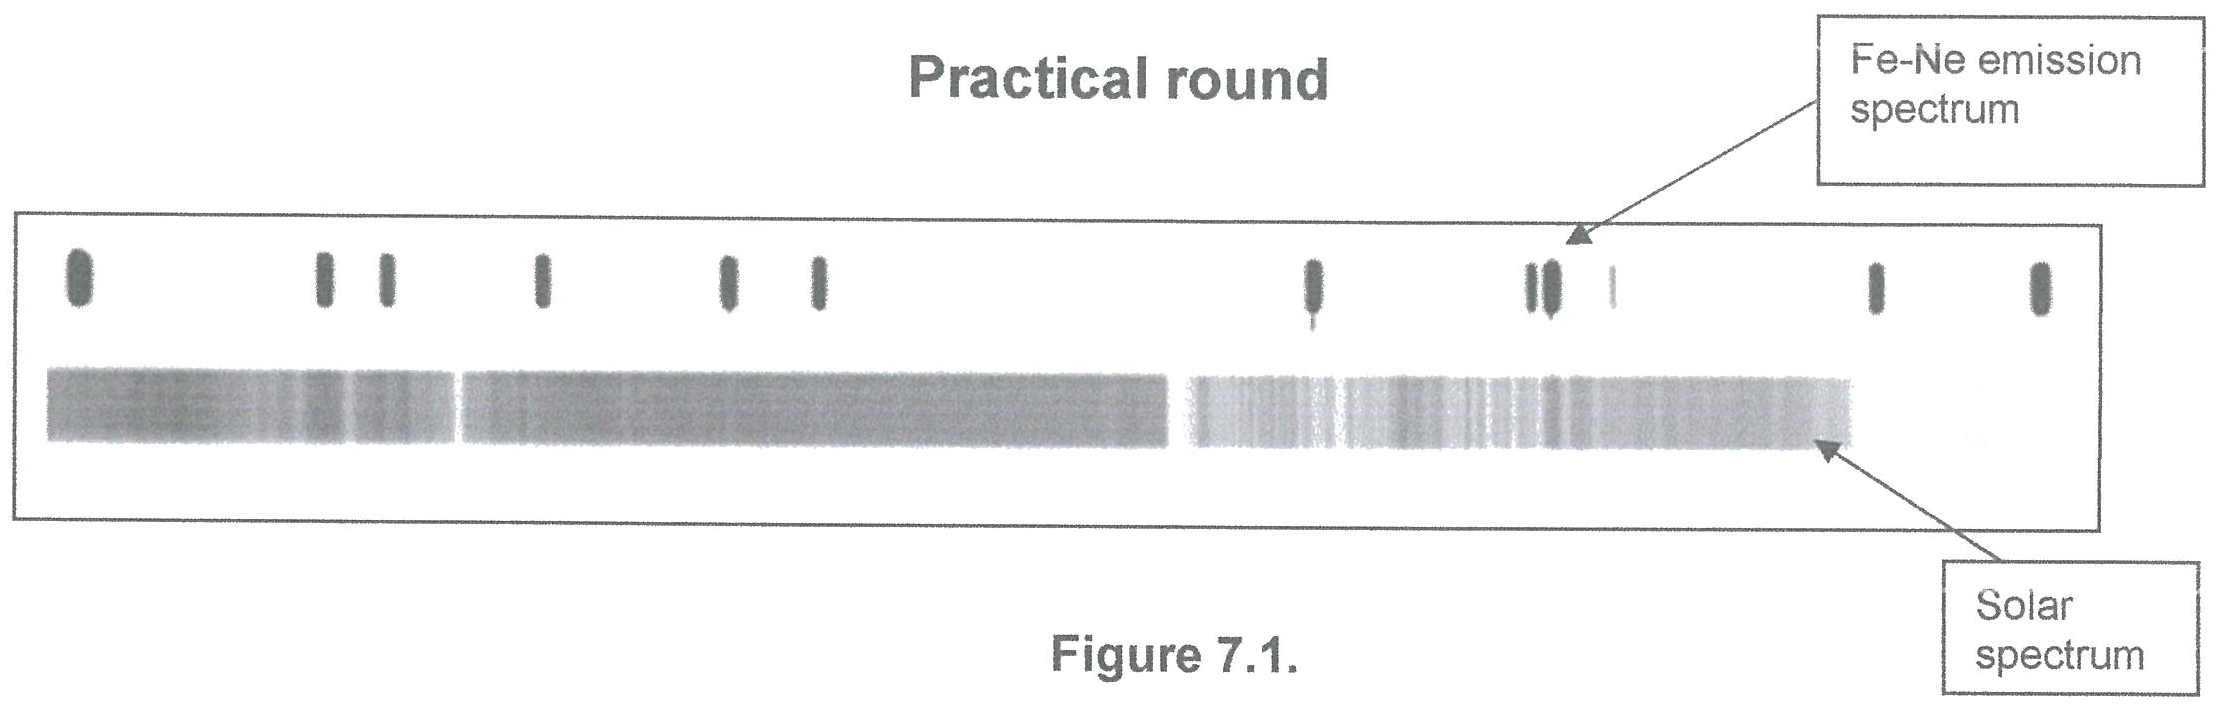
Figure 7.2
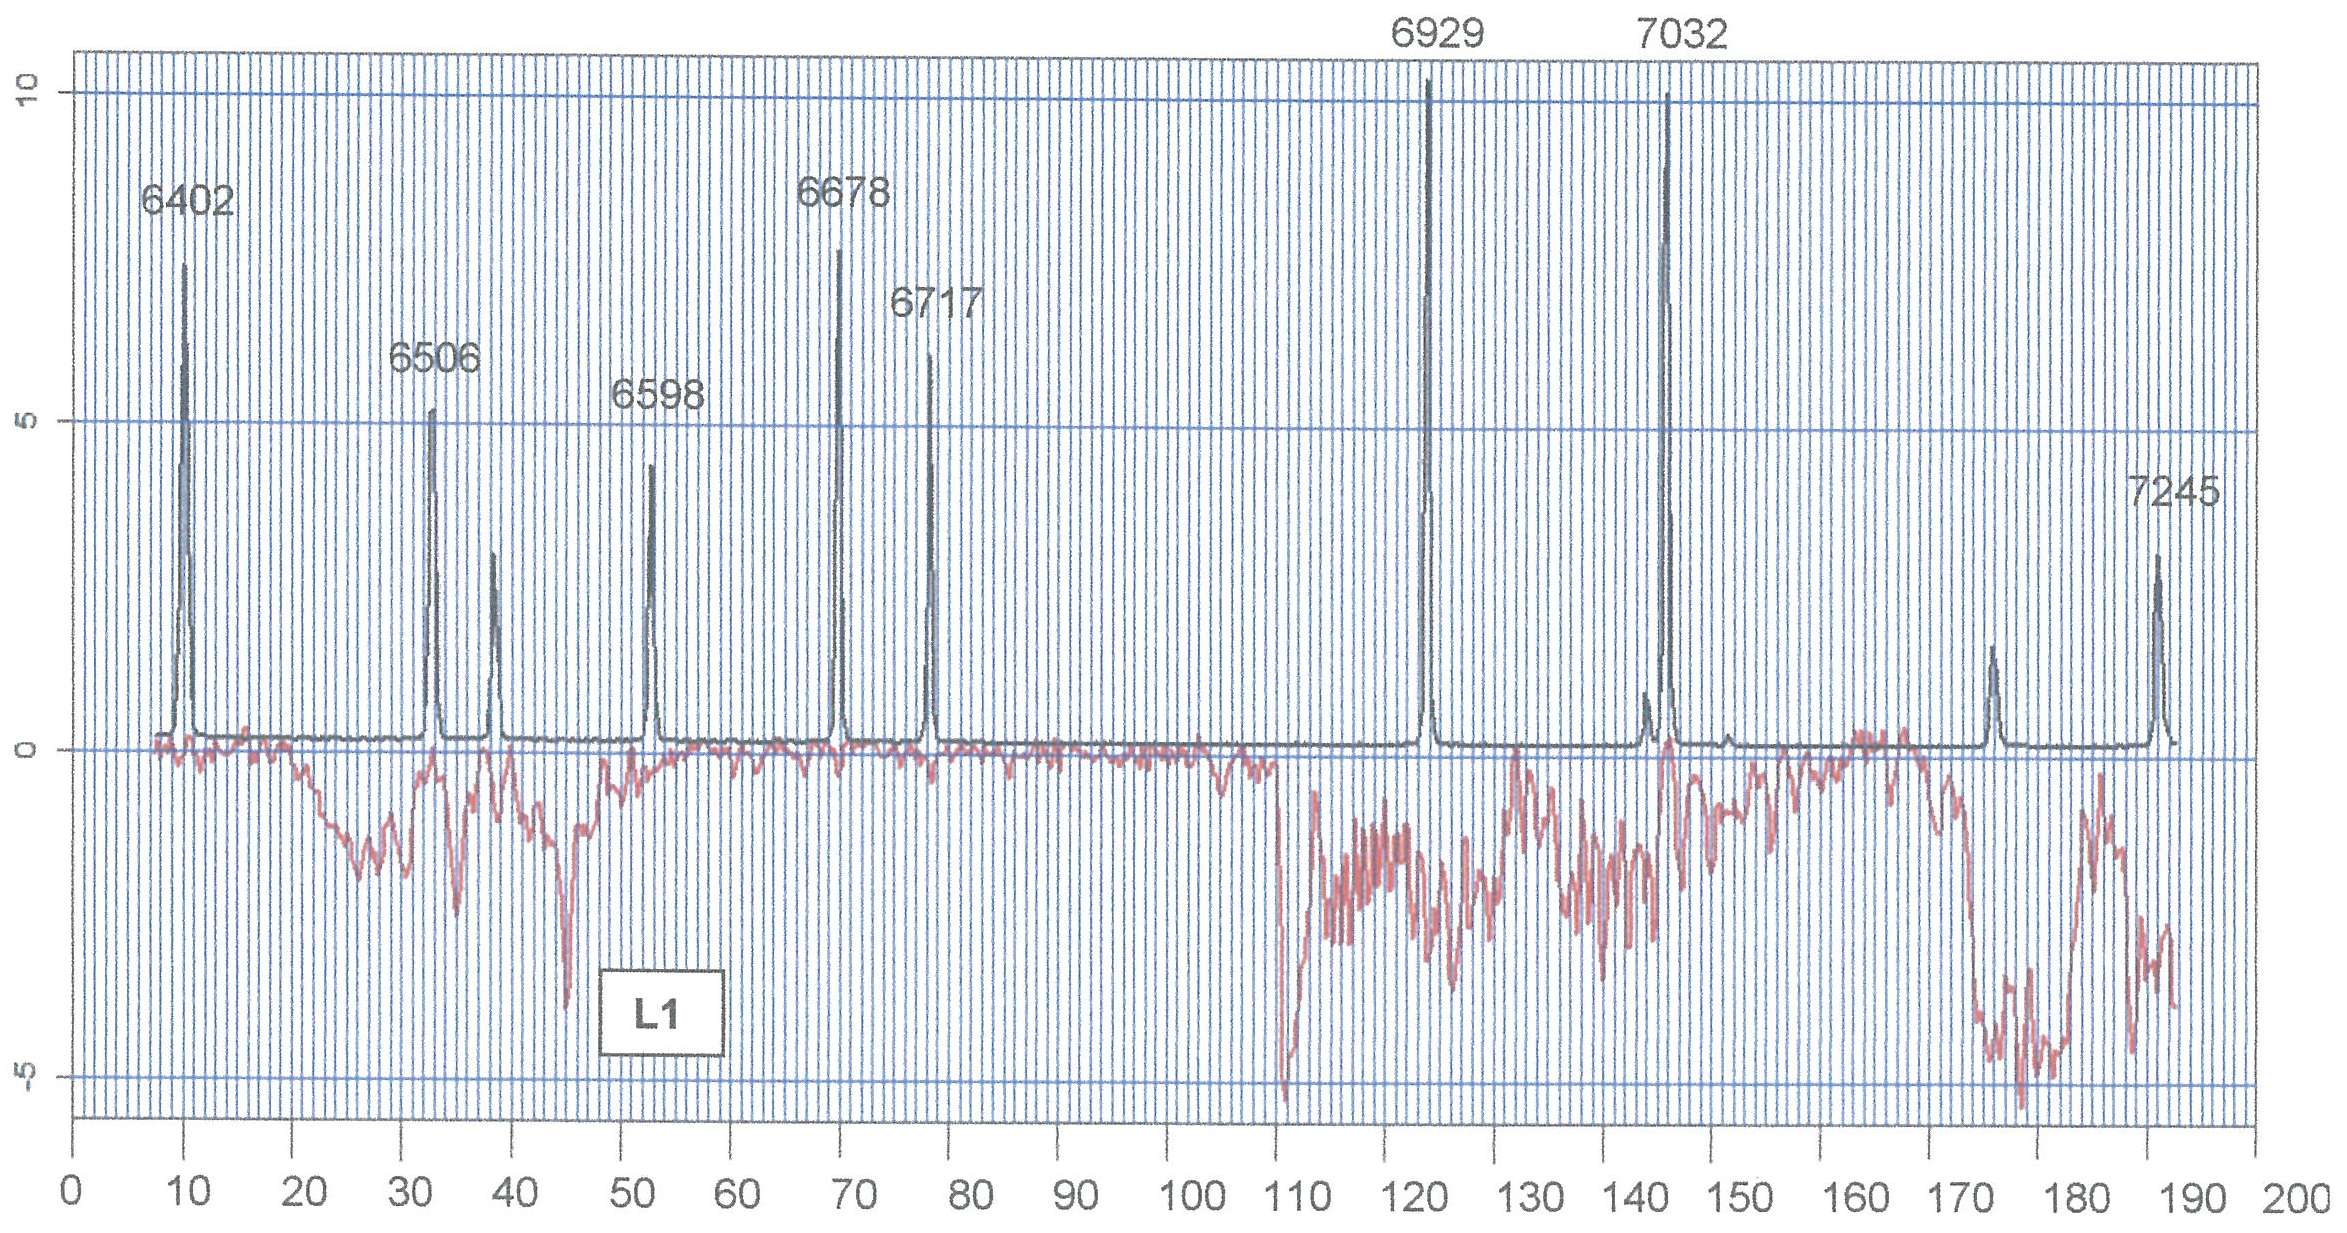
Table 7
| Wavelength (Å) | Pixel |
|---|---|
| 6402 | |
| 6506 | |
| 6598 | |
| 6678 | |
| 6717 | |
| 6929 | |
| 7032 |
Решение
Внимание: Непълно решение
В архива няма официално решение на тази задача.
Теми и трудност
Трудност: неоценена.
Светлина и астрономически измервания · Уреди и наблюдения · Спектри и спектрални линии · Детектори и изображения
Предпоставки: Разширена олимпиадна подготовка
Оригинал в Архива: pract.pdf · допълнителни данни: data_1.jpg · допълнителни данни: data_2.jpg