RMPh 2010, Експеримент — Задача 1. Determining the values of the parameters of a real diode by studying its current-voltage characteristic
3rd Romanian Master of Sciences 2010 Physics – Experimental Tour · 10 т.
Условие
A theoretical model is a number of mathematical equations which relate the quantities involved in a physical phenomenon. The validity of a model consists in the concordance between the measured data and the predicted values.
The simplest situation which can occur in a model is the case when two quantities are in a linear dependency. It is to be expected that the experimental pairs of measured values are subject to imprecision. This is why the plotted pairs of coordinates form a “cloud” around the predicted straight line, called fitting line.
It is assumed that the best fit of the experimental data with the theoretical model is attained when the sum of the squared distances from these points to the predicted line has the smallest possible value. The slope and the slope-intercept for a linear model are given by
Whether there really is a linear dependency between the two quantities is a matter described by the so-called correlation coefficient .
if there truly is a linear dependency with positive slope. if there truly is a linear dependency with negative slope. In general, and the more G gets closer to 0, the less credible the linear dependency is.
Very few of the physical models imply a linear dependency, but often a suitable rearrangement of a mathematical function can lead to one. The relation between the current and the voltage for an ideal diode is given by
where is the elementary electrical charge, and is the Boltzmann constant. For ordinary experimental conditions, and . The quantities which determine the non-linear dependency of I with V are the diode factor and the saturation current . The curve I versus V looks something like in Figure 1. When subject to large enough positive voltages, the diode’s resistance can be considered zero. When subject to large enough negative voltages, the diode’s resistance can be considered infinite.
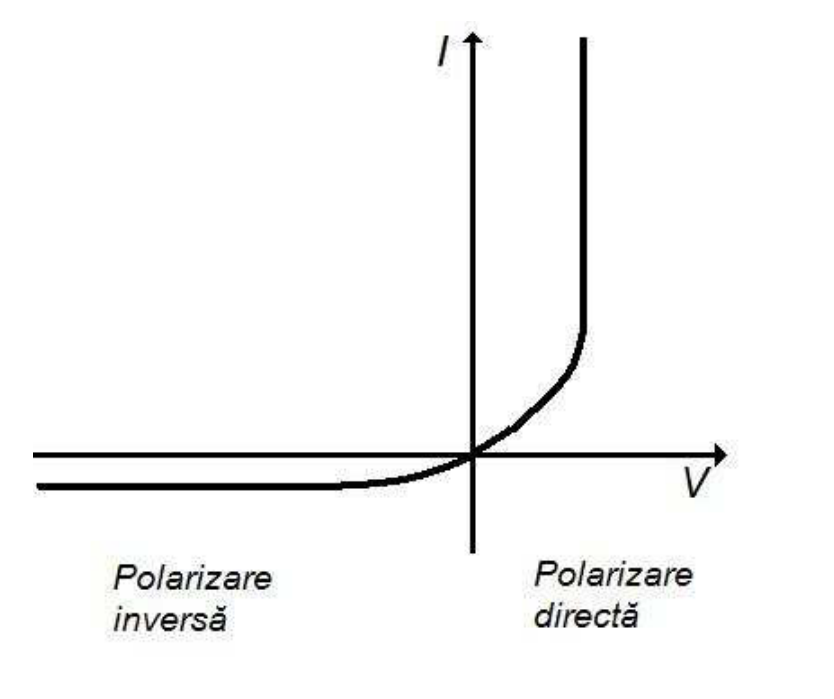
Admitting that , for we get and thus . So, for reversed polarity, (4) reduces to
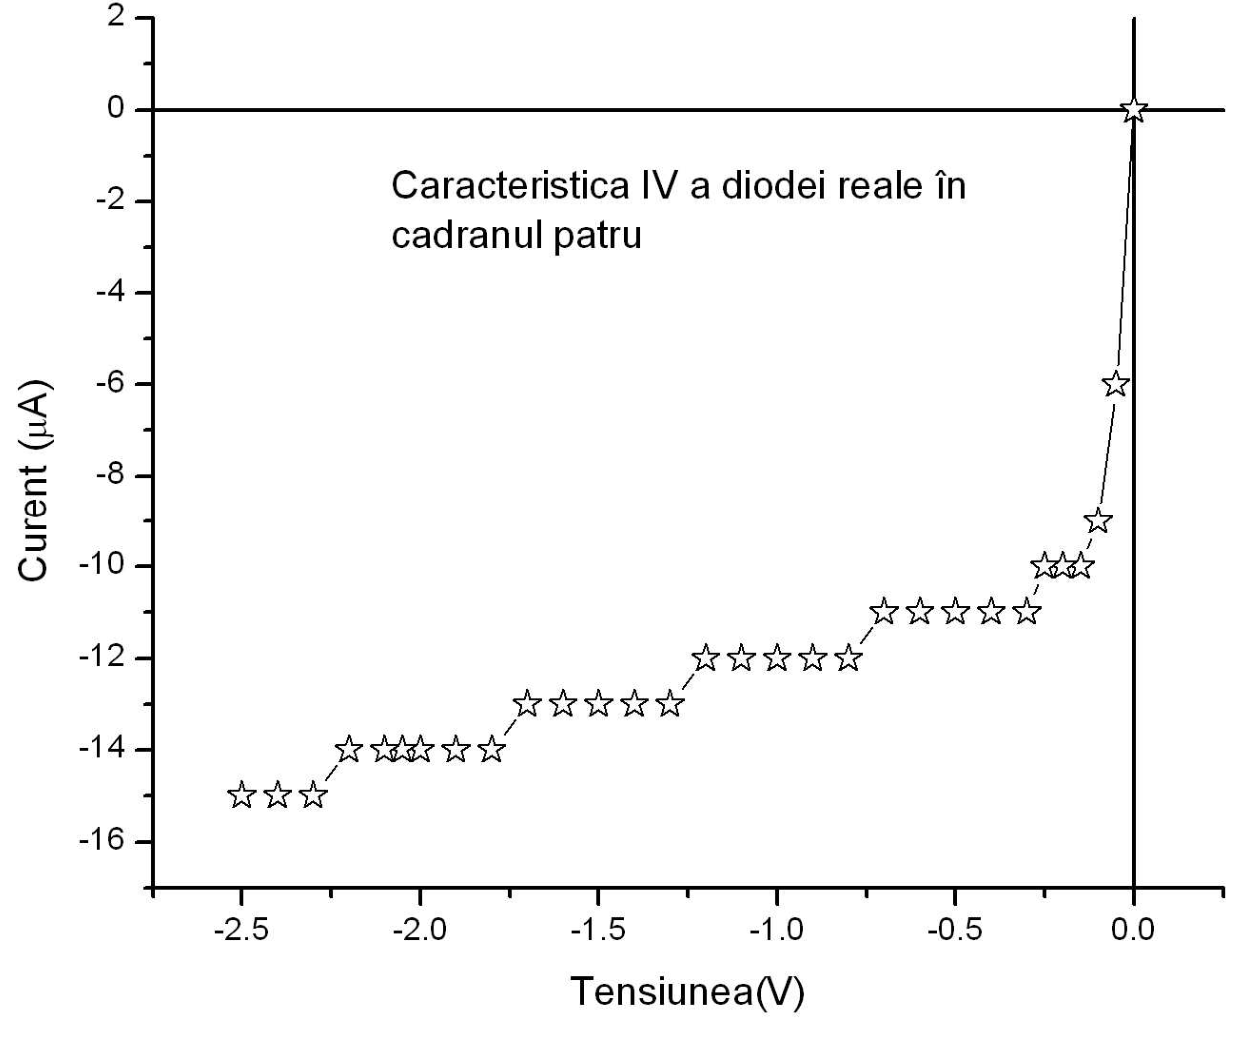
Plotting the I-V characteristic for negative polarity we get a line parallel to the V-axis, which allows us to determine the value of .
For , and thus . Consequently, (4) becomes
or
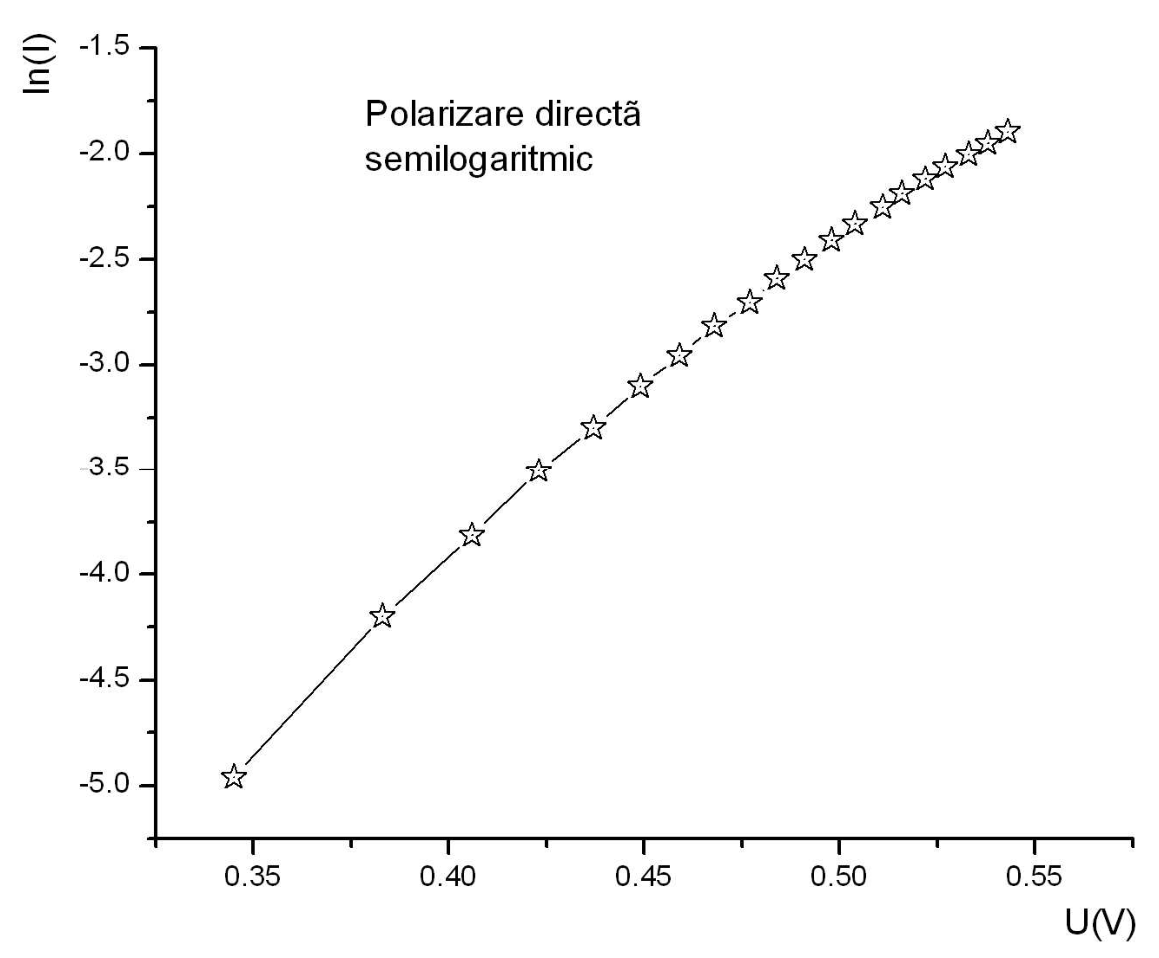
As you can see, writing the I-V characteristic as , we get a linear dependency. The slope allows us to determine the value of the diode factor, while the slope-intercept allows us to determine the value of the saturation current.
One can consider that a „real” diode consists of an ideal diode connected in parallel with a shunt with resistance R, and the whole connected in series with a resistor . Typical values for the characteristic resistances of r and R are , and respectively.
The I-V characteristic of a real diode is given by
Experimental problem 1 asks you to determine the values of the parameters of a diode, by using the data in the following two tables.
Table 1. Pairs of experimental data current-voltage for a real diode with reversed polarity
| No. | U(V) | I(µA) | Nr. | U(V) | I(µA) | Nr. | U(V) | I(µA) | Nr. | U(V) | I(µA) |
|---|---|---|---|---|---|---|---|---|---|---|---|
| 1 | 0 | 0 | 9 | -0.5 | -11 | 16 | -1.2 | -12 | 24 | -2 | -14 |
| 2 | -0.05 | -6 | 10 | -0.6 | -11 | 17 | -1.3 | -13 | 25 | -2.05 | -14 |
| 3 | -0.1 | -9 | 11 | -0.7 | -11 | 18 | -1.4 | -13 | 26 | -2.1 | -14 |
| 4 | -0.15 | -10 | 12 | -0.8 | -12 | 19 | -1.5 | -13 | 27 | -2.2 | -14 |
| 5 | -0.2 | -10 | 13 | -0.9 | -12 | 20 | -1.6 | -13 | 28 | -2.3 | -15 |
| 6 | -0.25 | -10 | 14 | -1 | -12 | 21 | -1.7 | -13 | 29 | -2.4 | -15 |
| 7 | -0.3 | -11 | 15 | -1.1 | -12 | 22 | -1.8 | -14 | 30 | -2.5 | -15 |
| 8 | -0.4 | -11 | 23 | -1.9 | -14 |
In order to determine the values of the parameters of the diode for reversed polarity follow de below procedure:
1. In the corresponding box on the answer sheet write down the expression of (6) for large values of the negative voltage . [0,4 т.]
2. Using the experimental data, plot on the provided millimetric paper the I-V curve for reversed polarity. [0,6 т.]
3. In the corresponding box on the answer sheet write down the linear form of the I-V characteristic for reversed polarity and indicate the expressions of the slope and of the slope-intercept . [0,6 т.]
4. Neglect from the experimental data the entries corresponding to small values of the negative voltage, and fill in Table 3 on the answer sheet. [0,8 т.]
5. Determine the parameters of the fitting line and fill in the corresponding boxes on the answer sheet. [0,8 т.]
6. Determine the correlation coefficient and write it down in the corresponding box on the answer sheet. [0,4 т.]
7. Determine the values of the parameters and write them down in the corresponding boxes on the answer sheet. [0,8 т.]
Table 2. Pairs of experimental data current-voltage for a real diode with forward polarity
| No. | Voltage (V) | Current (A) | No. | Voltage (V) | Current (A) |
|---|---|---|---|---|---|
| 1 | 0.345 | 0.007 | 11 | 0.491 | 0.082 |
| 2 | 0.383 | 0.015 | 12 | 0.498 | 0.090 |
| 3 | 0.406 | 0.022 | 13 | 0.504 | 0.097 |
| 4 | 0.423 | 0.030 | 14 | 0.511 | 0.105 |
| 5 | 0.437 | 0.037 | 15 | 0.516 | 0.112 |
| 6 | 0.449 | 0.045 | 16 | 0.522 | 0.120 |
| 7 | 0.459 | 0.052 | 17 | 0.527 | 0.127 |
| 8 | 0.468 | 0.060 | 18 | 0.533 | 0.135 |
| 9 | 0.477 | 0.067 | 19 | 0.538 | 0.142 |
| 10 | 0.484 | 0.075 | 20 | 0.543 | 0.150 |
In order to determine the values of the parameters of the diode for forward polarity follow de below procedure:
8. In the corresponding box on the answer sheet write down the expression of (6) for large values of the positive voltage, . [0,4 т.]
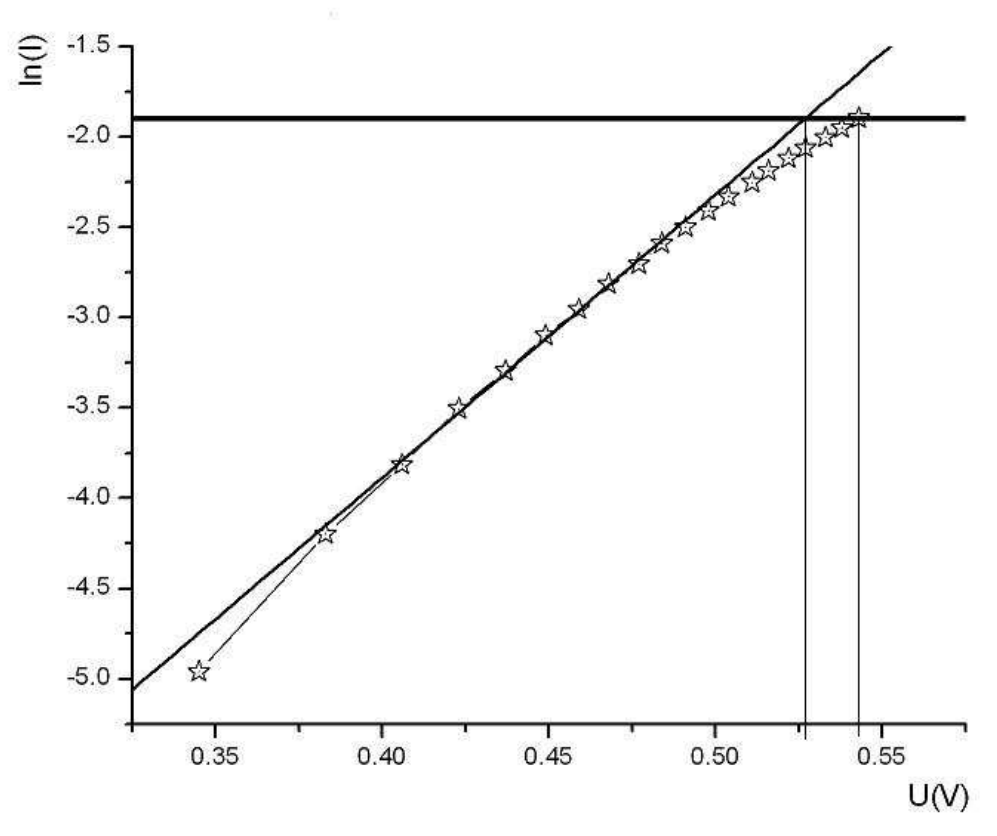
9. Using the experimental data, plot on the provided millimetric paper the graph for forward polarity. [1 т.]
10. Fill in Table 4 on the answer sheet only with the experimental data corresponding to moderate values of the positive voltage. [0,8 т.]
11. Determine the parameters of the fitting line and fill in the corresponding boxes on the answer sheet. [0,8 т.]
12. Determine the correlation coefficient and write it down in the corresponding box on the answer sheet. [0,4 т.]
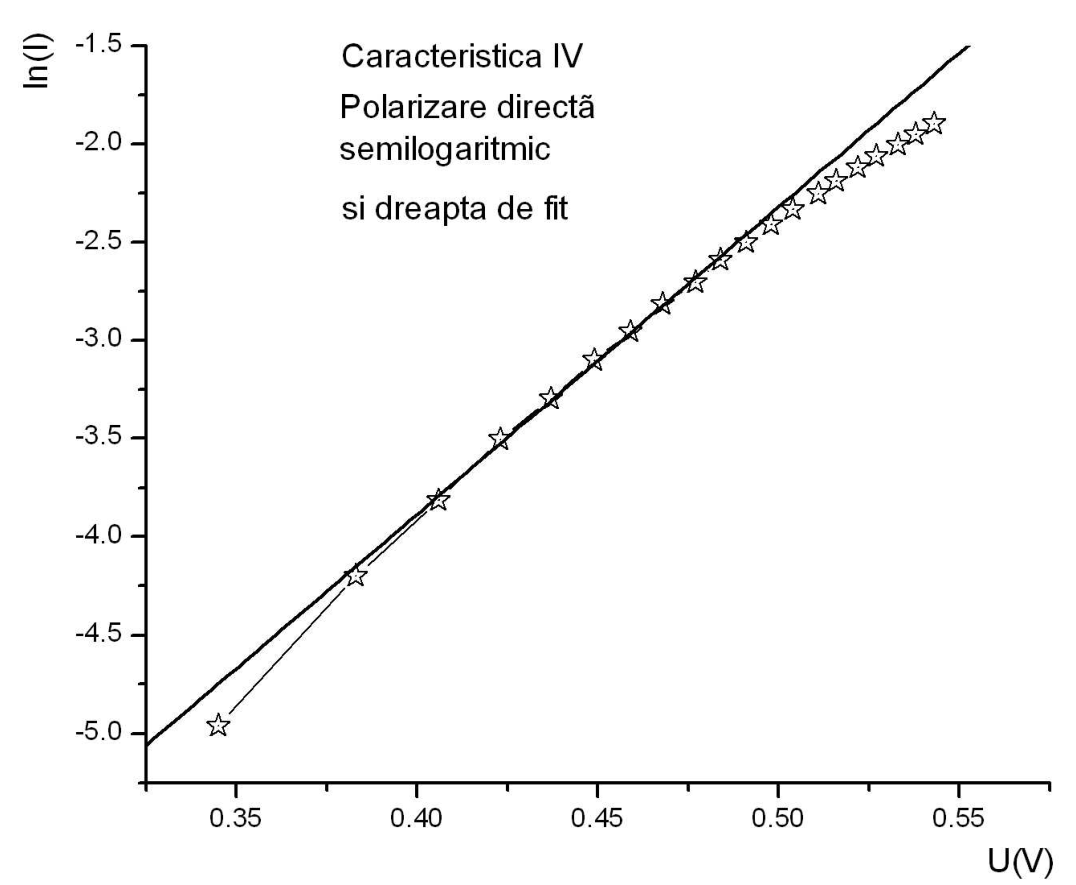
13. Draw on the graph plotted at point 9 the resulting fitting line. [0,6 т.]
14. Determine the values of the parameters and write them down in the corresponding boxes on the answer sheet. [0,8 т.]
15. The measured data for large positive voltages lay below the fitting line. Try to provide an explanation for this fact [0,6 т.]
16. Determine the value of the resistor and write it down in the corresponding box on the answer sheet. [0,2 т.]
Delia DAVIDESCU – National Centre for Assessment and Examination - MECTS
Adrian DAFINEI, Ph.D. – Faculty of Physics – University of Bucharest
Answer Sheet
1. The expression of (6) for large values of the negative voltage:
2. The graph: drawn on the provided millimetric paper.
3. The linear form of the curve for reversed polarity:
The expression for the slope :
The expression for the slope-intercept :
4. Table 3 – Processed data for reversed polarity
| No. | |||||
|---|---|---|---|---|---|
| 1 | |||||
| 2 | |||||
| 3 | |||||
| 4 | |||||
| 5 | |||||
| 6 | |||||
| 7 | |||||
| 8 | |||||
| 9 | |||||
| 10 | |||||
| Σ |
5. The parameters of the fitting line
The slope of the fitting line:
The slope-intercept of the fitting line:
6. The correlation coefficient :
7. The value of the parameter :
The value of the parameter :
8. The form of (6) for large values of the positive voltage :
9. The graph for forward polarity: drawn on the provided millimetric paper.
10. Table 4 - Processed data for forward polarity
| No. | ||||||
|---|---|---|---|---|---|---|
| 1 | ||||||
| 2 | ||||||
| 3 | ||||||
| 4 | ||||||
| 5 | ||||||
| 6 | ||||||
| 7 | ||||||
| 8 | ||||||
| 9 | ||||||
| 10 | ||||||
| Σ |
11. The parameters of the fitting line
The slope of the fitting line
The slope-intercept of the fitting line
12. The correlation coefficient
13. The drawing of the resulting line on the graph plotted at point 9.
14. The expression of the parameter :
The value of the parameter :
The expression of the parameter :
The value of the parameter :
15. The explanation you provide for the fact that the measured data for large positive voltages lay below the fitting line.
16. The value of the resistor
Отговори
7. I0 = 9.6 µA; R ≅ 460 kΩ
From the official evaluation sheet (R = 1/a).
14. η = 2.4; I0 = 3.7×10⁻⁵ A ≅ 30 µA
As printed in the evaluation sheet; 3.7×10⁻⁵ A is 37 µA, so the printed approximation „≅ 30 µA” is inconsistent with the value before it.
16. 0.2 Ω
From ΔV = rI, 0.02 = r · 0.15 in the evaluation sheet.
Решение
Evaluation Sheet
Any other correct solution will be evaluated accordingly
Experimental problem 1
1. For: 0.4p
0.4p
2. For: 0.6p
(graph) 0.6p
3. For: 0.6p
Linear expression of the characteristic for reversed polarity
0.2p
0.2p
0.2p
4. For: 0.8p
correctly filling in the Table 3 0.8p
5. For: 0.8p
the slope of the fitting line
0.4p
the slope-intercept of the fitting line
0.4p
6. For: 0.4p
the correlation coefficient for the presumed linear dependency
0.4p
7. For: 0.8p
0.4p
0.4p
8. For: 0.4p
0.4p
9. For: 1.0p
0.2p
for experimental data within the range
0.2p
(graph) 0.6p
10. For: 0.8p
correctly filling in table 4 0.8p
11. For: 0.8p
the slope of the fitting line
0.4p
the slope-intercept of the fitting line
0.4p
12. For: 0.4p
the correlation coefficient for the presumed linear dependency
0.4p
13. For: 0,6p
(graph) 0.6p
14. For: 0.8p
0.4p
0,4p
15. For: 0.6p
(graph) 0.6p
16. For: 0.2p
0.2p
TOTAL 10p
Оригинал в Архива: experimental_tour_problems_EN.pdf · официални решения: experimental_tour_solutions_EN.pdf