USAAAO 2026, I кръг — Задача 22
USAAAO 2026 - First Round · 9 февруари 2026 г.
Problem writers
Problem writers: Srihari (Hari) Balaji, Vincent Bian, Ferdinand, Hagan Hensley, Elizabeth Lee, Joe McCarty, Lucas Pinheiro, Feodor Yevtushenko
Условие
Use the following information for Questions 21, 22, and 23. Consider the following graph, which shows the mean orbital velocity of stars around a galaxy’s center as a function of distance from the center. The graph also shows the expected orbital velocities (dashed line) from observations of visible matter. The discrepancy between the observed and expected values is assumed to be due to invisible dark matter.
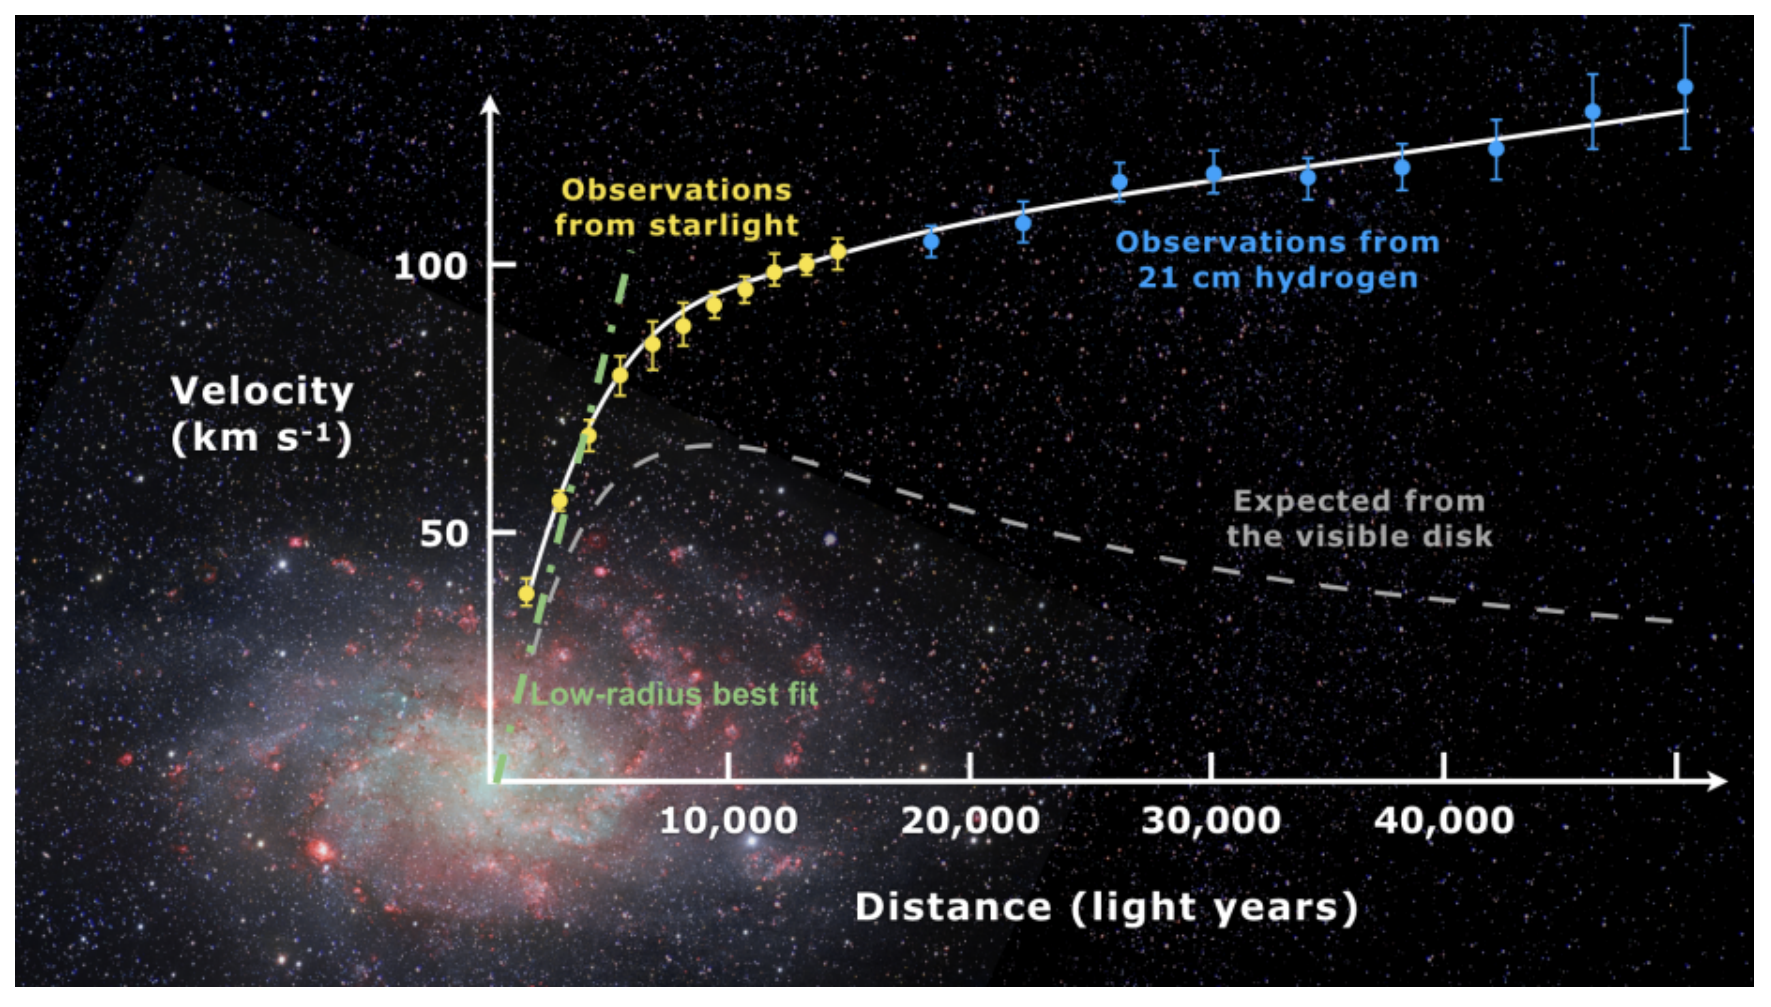
Now, for larger values of , the discrepancy between the observed and expected rotation curves begins to appear more significant. Assume that the expected rotation curve (dashed gray) curve is calculated off the distribution of all baryonic (“standard”) matter, while the observed rotation curve (solid white) is due to the combination of baryonic matter and dark matter. Within a radius of ly from the galactic center, and according to the graph, which of the following is closest to the ratio between the dark matter mass and the baryonic matter mass enclosed?
(a) 2
(b) 5
(c) 10
(d) 25
(e) 50
Отговори
- C
Решение
Solution: Using the same equation as before, we get . It is relatively clear that the value of the true velocity curve is around 3.5 larger than that of the expected velocity curve, meaning that the answer is around , giving answer choice C. This is the only answer choice within the ballpark of any reasonable estimation.
[Note: measuring the two heights with a ruler gives a more precise estimate of , which is reasonably close.]
Answer: C
Оригинал в Архива: usaaao_first_exam_2026.pdf · официални решения: usaaao_first_exam_solutions_2026.pdf